Leiden Madtrics2024-05-16T23:20:47+02:00https://www.leidenmadtrics.nl/atom/An update on the Scholars on Twitter datasethttps://www.leidenmadtrics.nl/articles/an-update-on-the-scholars-on-twitter-dataset2024-04-24T10:00:00+02:002024-05-16T23:20:47+02:00In 2022, we published a dataset of Scholars on Twitter. This blog post introduces an update to this dataset and discusses some of the challenges with our data providers: Twitter, Crossref, and OpenAlex. These challenges made the original dataset and process obsolete and this update necessary.Introduction

On August 21, 2022, we made available the first version of our dataset of scholars on Twitter created with two open data sources: Crossref Event Data and OpenAlex. We reported on the dataset’s creation and validation in a data paper published in Quantitative Science Studies (Mongeon et al., 2023). Soon after the publication of the dataset, the procedure and the accompanying paper, two unexpected changes occurred with the source data providers, Crossref and OpenAlex. One made our process impossible to repeat in the future, and the second made the dataset to a large extent less usable. This short blog post describes those two issues and their impact on the reproducibility and usability of the dataset, and how we mitigated those issues to produce a new, usable version of the dataset, that is now available on Zenodo.

Reproducibility issue - Musk buys Twitter

One of the consequences of Elon Musk buying Twitter in 2022 was an increased barrier to Twitter data access. Two weeks after Crossref’s first announcement, on February 1st, 2023, to abandon the collection of Twitter data, a follow-up post confirmed it asstated below:

“Since 22 February 2023, we no longer have access to the Twitter API to gather events for Twitter. Tweets will be available until the end of February, however we are required to remove all data we have collected from Twitter and will begin to do so in the coming days.“

What this meant for our dataset is that we were no longer going to be able to use Crossref Event Data to collect information on accounts tweeting scholarly works - one of the two crucial pieces of our process - making dataset updates using the same approach impossible. At the same time it also made it a unique dataset in itself, since with the disappearance of the academic Twitter API, it became virtually impossible to develop similar approaches with the currently available tools.

Usability issue - OpenAlex changes all author IDs

On June 20th, 2023, OpenAlex announced a major update in its author disambiguation system. They then announced its successful implementation on August 11th, 2023. This update introduced a new disambiguation model and a live assignment system for authors and affiliations, necessitating the complete replacement of all previous OpenAlex author IDs with new ones. Although this systemic refresh significantly reduced "author splitting" and improved the integration of ORCID identifiers—resulting in a more accurate count of authors dropping from 127 million to 92 million and a leap in works linked to ORCID from 15% to 41%—it also introduced challenges related to data consistency and traceability. Users who had relied on previous author IDs found themselves facing the need to update their datasets as the old IDs were rendered obsolete and began returning 404 errors.

While bolstering the database's accuracy and user experience, this move rendered our dataset obsolete by invalidating the OpenAlex author IDs that we had paired with Twitter accounts. This illustrates the delicate balance between enhancing data integrity and maintaining continuity for users reliant on the persistence of identifiers and the intricate challenges of advancing open infrastructures for scholarly metadata (Hendricks et al., 2021).

Updating the Scholars on Twitter dataset in light of these changes

The matching process

Following the significant update to OpenAlex's author identification system, the Scholars on Twitter dataset, which previously linked Twitter IDs to OpenAlex author IDs, immediately became outdated. This called for a new approach to re-establish these links, as the absence of new Twitter data made it impossible to replicate the original method of matching Twitter profiles with scholarly authors. To navigate this challenge, a bridge was constructed between the June 2022 snapshot of the OpenAlex database—used in the original matching process—and the most recent snapshot from February 2024. We employed the public versions of OpenAlex in Google BigQuery made available at the InSySPo project, in Campinas, Brazil (see an introduction to this system in this open course), and the scripts are available in a GitHub repository. This bridge utilised OpenAlex work IDs and DOIs to match authors in both datasets by their shared publications and identical primary names. When a connection was established between two authors with the same name, the new OpenAlex author ID was assigned to the corresponding Twitter ID. When direct matches based on primary names were not found, an attempt was made to establish connections by matching the names from June 2022 with any corresponding alternative names found in the 2024 dataset. This method ensured continuity of identity through the system update, adapting the strategy to link profiles across the temporal divide created by the database's overhaul.


Announcing the Scholars on Twitter dataset version 2.0

Our method for re-establishing links between author IDs and Twitter profiles has been notably successful, managing to rematch 432,417 (88%) OpenAlex author IDs. This effort successfully restored connections for 388,968 unique Twitter users, which represents 92% of the original dataset. Of these, 375,316 were matched using their primary names, and 57,101 through alternative names. The simplicity and quick execution of this approach led to exceptionally favorable results, with a minimal loss of only 8% of the original Twitter-linked scholarly accounts.

We have republished the dataset in Zenodo and it can be found here. While the dataset still cannot be updated with new Twitter profiles and our original process remains unreproducible, we are happy to bring to the research community an open dataset of 388,968 Twitter accounts linked to OpenAlex author IDs that can be used in the study of the activities of scholars on Twitter and science-social media interactions more generally.

Finally, our case represents a cautionary reminder for open research information systems like OpenAlex, which should work not only to ensure the persistence of their identifiers (for authors, affiliations, journals, works, etc.) but also to support the sustainability of other infrastructures that other communities may build around their open data, like in the case of our dataset or, similarly, the new Open Edition of the Leiden Ranking.


Header image created with GPT-4/Dall-E
DOI: https://doi.org/10.59350/abapf-y4f53 (export/download/cite this blog post)

]]>
Philippe Mongeonhttps://orcid.org/0000-0003-1021-059XTimothy D. Bowmanhttps://orcid.org/0000-0003-0247-4771Rodrigo Costashttps://orcid.org/0000-0002-7465-6462Wenceslao Arroyo-Machadohttps://orcid.org/0000-0001-9437-8757
Not only Open, but also Diverse and Inclusive: Towards Decentralised and Federated Research Information Sourceshttps://www.leidenmadtrics.nl/articles/not-only-open-but-also-diverse-and-inclusive-towards-decentralised-and-federated-research-information-sources2024-04-22T11:07:00+02:002024-05-16T23:20:47+02:00The Barcelona Declaration on Open Research Information highlights that research information systems should not only be open but also diverse and inclusive. We argue that this can only be achieved by interlinking various and decentralised research information sources.The Barcelona Declaration: a call for openness… but also for diversity and inclusion

The launch of the Barcelona Declaration last week aims to mobilise the global research community towards making research information open and accessible. The most common argument for openness is that research information plays a central role in the evaluation of institutions and researchers, and in the retrieval of scientific outputs. Given this centrality, research information should not be locked inside proprietary infrastructure for science to advance.

In this blog post, we highlight that the Barcelona Declaration states that openness is indeed very important, but that openness is not enough: research information sources should also be diverse and inclusive, in line with the UNESCO Recommendations on Open Science.

Research information should avoid the biases documented in current mainstream sources, which are based in Western Europe and North America and tend to make less visible the science produced in other world regions, especially in the Global South. This is highlighted in the Barcelona Declaration which explains that decisions are routinely made ‘based on information that is biassed against less privileged languages, geographical regions, and research agendas’.

In short, diversity and inclusion of information are crucial for achieving fair and comprehensive monitoring and evaluation. But how do we achieve diversity and inclusion in research information?

Inclusion and diversity require multiple information sources

Research information is understood as including all bibliographic metadata, as well as metadata on other aspects of research such as samples, materials, research data, organisations, funding sources and grants.

In an ideal world, one might dream of a single database that would provide all this data for all the research across the planet. Yet in practice, this is not possible, perhaps not even desirable. Linguistic, institutional, local or regional research agendas and representation biases can be more effectively mitigated by ensuring the use of multiple sources that expand the thematic, geographical and linguistic scope of research information. The multiplicity of sources provides not only richer data but also broadens the cultural perspectives, thus supporting pluralism.

We propose three arguments why multiple sources lead to better monitoring and evaluation.

First, coverage (i.e. the number of relevant documents included) is not very high for many world regions, even in the largest databases such as OpenAlex. The deficit is particularly acute in territories where many journals do not use DOIs, such as Latin America or parts of Asia (e.g. South Korea), due to economic sanctions on countries such as Cuba, and to the high costs of DOIs in relation to journal resources. For example, only 20% of the documents captured in LA Referencia (a federation of repositories) and only 22% of the content published in Diamond OA journals in Latin America have DOIs; and none of the publications from SciELO Venezuela have DOIs.

In short, the adoption of some standards which are believed to be universal by the average Western expert is, in practice, very difficult in the contexts of many countries. Therefore, databases that aim to be global should include other Digital Unique Identifiers or the IDs of regional databases. The Decentralized Archival Resource Key (dARK) is a project by LA Referencia and IBICT that will provide a decentralised infrastructure and governance solution for persistent identifiers. Operating on a public good institutional network, dARK will offer an inclusive and interoperable approach, compatible with existing PID infrastructures.

The second argument is the richness of the metadata. A single global information source cannot support the same degree of detailed metadata that regional and specialised databases can provide for some specific issues. Just as PubMed offers richer metadata with regard to medical perspectives, when it comes to place, local information sources provide contextual know-how and a more detailed curation. For instance, the catalogue Latindex has rich journal metadata to help users distinguish among journals with more or less rigorous editorial practices. Redalyc’s open infrastructure provides access to the full text of Diamond OA journal articles as well as structured data in XML JATS, including mathematical expressions in MathML, audio, image, video and other multimedia content available in journal articles.

Moreover, local databases also produce classifications (e.g. disciplinary) in alignment with national institutions. Some local repositories cover some of the literature (including ‘grey’ documents such as policy reports) on socially relevant issues that are relatively neglected in the ‘international’ databases, such as tropical diseases or local policy.

The third argumentfor preserving a variety of information sources ispluralism. In a world that is unequal and undergoing serious conflicts, research information sources need to remain decentralised to accommodate a variety of perspectives on knowledge (local creativity, language, worldviews, histories, etc.), and preserve regional independence. Otherwise, there is a real danger that the choices of larger or dominant groups (for example, with regards to ontologies or selections) are adopted by default, without questioning, as has happened with commercial providers with problematic consequences in research assessment.

Figure 1. An illustration of a potential federation of open research information sources, with some prominent open research information sources. Based on Ficarra et al. (2020).

Opportunities for cooperation among already existing Open Research Sources

The path to open resource information is not about replacing Web of Science or Scopus with a single alternative source. On the contrary, we believe that a decentralised and federated research information ecosystem must be developed, so that diverse research information sources contribute to better coverage, richer metadata and pluralism.

Through interoperability agreements and interconnection of various sources, the use of communication protocols, standards and persistent identifiers, it should be possible to bring together information from multiple sources into applications designed for specific purposes in particular institutions. For instance, LA Referencia and Redalyc are collaborating to connect Diamond OA with Green OA content to improve visibility and research assessment.

With a multiplicity of sources, it becomes possible to pose questions in a plural and conditional manner, recognising that relevant knowledge differs across contexts. Instead of creating a singular “Observatory of Science” with a unique but inevitable partial perspective, the multiplicity of sources allows to organically build up a Multiversatory through the observation of the pluriverse of knowledge, showing different epistemic perspectives created under the lenses of particular languages, disciplines, communities and places, in contrast to mainstream descriptions.

The Barcelona Declaration explicitly supports this plural vision. It advocates that “information from different sources to be linked and integrated, so that decision making can take full advantage of all available information and can be based on a diversity of perspectives and an inclusive understanding of the issues at stake.”

Similarly, the declaration on research assessment (FOLEC) of the Latin American Council of Social Sciences (CLACSO) stresses that data sources should “reflect both the production disseminated in international repositories as well as that which is included in regional and local databases”.

In summary, there is an agreement that plural (i.e. decentralised) and interlinked (i.e. federated) research information sources are the way forward to ensure not only openness, but also diversity and inclusion. The Barcelona Declaration creates the momentum for all of us to continue working towards this goal.

Note: This blog post is based on some of the contributions from a webinar held on 22nd of March 2024 jointly organised by FOLEC-CLACSO and the CWTS UNESCO Chair. The recording is available here. The Spanish version of this blog post is available at the CLACSO website.

Header image by Susann Schuster on Unsplash
DOI: 10.59350/gmrzb-e2p83 (export/download/cite this blog post)

]]>
Dominique BabiniArianna Becerril GarciaRodrigo Costashttps://orcid.org/0000-0002-7465-6462Lautaro MatasIsmael Rafolshttps://orcid.org/0000-0002-6527-7778Laura Rovelli
Walking the talk: a peak into Open Science practices at CWTShttps://www.leidenmadtrics.nl/articles/walking-the-talk-a-peak-into-open-science-practices-at-cwts2024-04-08T09:30:00+02:002024-05-16T23:20:47+02:00At CWTS, Open Science is a prominent topic, but what do we actually do about it? Ana Parrón Cabañero, PhD candidate at CWTS, interviewed colleagues and explored the integration of Open Science into mission and practice at the institute. Here, she reflects on her findings and links them to theory.Open Science at CWTS in retrospect

Leiden University sees Open Science (OS) as a key element on the path towards making greater scientific and societal impact and fostering research quality and integrity. OS is encouraged across the university and, to ensure that the transition is based on evidence, the Open Science Lab (stay tuned to learn more about it soon!) has been established at the Centre for Science and Technology Studies (CWTS).

Almost three years ago, the former director of CWTS Sarah de Rijcke wrote a blog post discussing the changes taking place at CWTS and introducing the – then under development – value-based strategy. In this strategy, the CWTS Knowledge Agenda 2023 – 2028, OS holds a central position. Most importantly, the knowledge agenda is guided by some of the values that underpin the OS movement, like transparency, responsibility, and collaboration. In line with these developments, in September 2021, we became the first centre at Leiden University to have its own Open Science policy. The value that OS has for CWTS is reflected in our mission as well: ”we aim to contribute to the adoption of OS practices”. Following from “practicing what we preach”, this also means that not only do we study OS, but commit to open research practices ourselves.

But… what has been happening on the work floor? To take a glimpse into whether and how we are practising what we preach when it comes to OS, I had separate conversations with five of my colleagues.

The different flavours of Open Science

The broadness of OS has been recognised: the aspects it encompasses are manifold, but so are the variety of goals and motivations underpinning openness in research practices. A glimpse into CWTS allows us to observe a microcosm representing such variety. In an attempt to consolidate the diverse perspectives of my colleagues, I use the five OS schools of thought as devised by Fecher & Friesike (2014) to structure the insights from the interviews (Figure 1).

Some colleagues displayed an orientation towards a combination of public and democratic motivations, as our conversations centred around the need for transparency, engagement, quadruple helix collaboration, and inclusiveness (well reflected in this quote: “how are they [people who are doing research] thinking about who to include or who to reach with their material?”). They emphasised knowledge co-creation and a broader definition of “access” in open access, while also highlighting the need for a case-by-case decision on how and why to be open. Other colleagues put efficiency at the centre, sharing views that align more with pragmatic motivations. Open data and open code were the main topics in these conversations, but also the idea of openness resulting in collective benefit and a wider dissemination of research outputs. Citing one of my colleagues, “[being open] helps spreading knowledge, it helps other people getting new ideas”. The infrastructure perspective was also present across the interviews, with a particular focus on the challenges for qualitative researchers to store their data. Some of the concerns around infrastructure are well reflected in this quote from one of the interviews: “there are big questions about what are these different data cultures? And how do they relate or not to existing infrastructure? And can we build new infrastructure that speaks more to specific research communities?”. Finally, while measurement, and particularly alternative metrics to evaluate research, is an area of study at CWTS, this motivation did not emerge during my conversations with colleagues. In short, there is interest in both the technicalities of OS and the culture that it promotes, with some colleagues in a middle ground and others showing a stronger inclination towards one or the other.

5 OS Schools for blog
Figure 1. The five schools proposed by Fecher & Friesike (2014). Author's conceptualisation.

As open as possible: navigating the challenges

The first practice that popped up in conversations was open access publishing, the one that most scholars at CWTS are very familiar with. According to our OS policy, it is mandatory to make articles openly accessible via open access journals or depositing in a repository. Regarding open access publishing, concerns were expressed about expensive article processing charges (APCs). Our community is well acquainted with preprints and has experience with posting them, but it was conveyed that submitting a preprint with collaborators requires dialogue to ensure that everyone is supportive of the action. Additionally, there is awareness around open peer review, but it seems to be far from becoming the norm.

Open data and the FAIR (Findable, Accessible, Interoperable, Reusable) principles came up in all conversations, often discussed side by side. While they are well understood, the practical application of these principles is not straightforward. This is partly due to the fact that making datasets open and useful for others requires considerable effort. When it comes to Citizen Science involving non-academic collaborators who also collect data, structuring datasets can become even trickier because of the higher heterogeneity. To this, it can be said that our OS policy acknowledges this issue and does not mandate data openness when it would require excessive effort. On top of this, reusing existing open data is also seen as challenging, often requiring a substantial time investment. In this sense, it was hinted that openly sharing and carefully documenting research methods together with the data would make them more useful (and reusable!).

For researchers who work with code at CWTS, openly sharing code is common practice. While sharing it demands certain commitment, it seems that over time they have incorporated this practice as the norm. In cases where they feel their code is not good or useful enough, they tend to keep it closed. In addition, open code shared by others is regularly used by our scholars.

Citizen Science is practiced through projects like CitiObs within the Citizen Science Lab. While colleagues at CWTS are aware of Citizen Science, it does not appear to be practiced widely beyond that. This can be due to the nature of the larger part of the research undertaken here. However, there are good reasons to bring citizens to one’s research, and as our colleague stated, involving citizens from the start is key, especially if you want to have policy decisions change, since they are the ones affected by it.

Driving change: the role of CWTS in Open Science

How can we at CWTS contribute to OS beyond our boundaries? My colleagues highlighted our existing expertise in research evaluation, which might be used for assessing the impact and consequences of OS practices and policies on research. In addition, because of the various international networks that we are part of, we would be well positioned to engage in advocacy efforts to promote OS. It was also suggested that, as a renowned centre, we should lead by example, which brings us back to the start and to one of our important guiding principles: “We strive to practice what we preach. My colleagues at CWTS, driven by the will to enhance research quality and to have a wider scientific and societal impact, seem to be keenly interested in continuing to learn and uptake OS practices. We particularly appreciate the opportunity to learn about OS by engaging in conversations with other people here. Rephrasing one of my colleagues, to have a good OS culture you need to have a good culture as a foundation. This goes beyond mere infrastructure or research outputs; embracing openness and transparency is about fostering open communication. As our policy recognises, OS takes time, but CWTS is positioned to be moving in the right direction.

New to Open Science? Here is a piece of advice from my colleagues at CWTS:

Header image: Simon Hurry on UnsplashDOI: 10.59350/pnwwy-n4e81 (export/download/cite this blog post)
    ]]>
    Ana Parrón Cabañerohttps://orcid.org/0000-0002-6573-9012
    Transforming Research Culture - Introducing the Evaluation & Culture Focal Area at CWTShttps://www.leidenmadtrics.nl/articles/transforming-research-culture-introducing-the-evaluation-culture-focal-area-at-cwts2024-04-02T10:55:00+02:002024-05-16T23:20:47+02:00The Evaluation & Culture Focal Area at CWTS focuses on the changing faces of research quality, scholarly communication, and research assessment. In this blog post, we present our agenda for the coming five years.What reforms in how we assess and value research are necessary to better equip public science systems for the existential challenges of the 21st century? How can we understand and tackle issues such as inequitable access to scientific literature, increasing strain on peer review systems, and publisher oligopolies? How best to evaluate emerging knowledge infrastructures and their embedded values, e.g. of openness or sustainability?

    These are just some of the urgent puzzles members of the Evaluation & Culture Focal Area at CWTS are currently working on.

    Over the years, CWTS has concerned itself with understanding and advancing many of the basic building blocks of academic knowledge-making, from assessment tools & evaluation practices to scholarly communication infrastructure and databases. Recently, there has been an explosion of science reform movements that address a wide range of problems in these domains. For example, researchers in metascience aim to tackle urgent questions of reproducibility and research integrity, while academic institutions and funders have begun to initiate various reforms to improve the fairness and inclusivity of research assessment and research culture. This includes for example attempts to rethink and broaden quality criteria in evaluation through responsible metrics or by means of so-called narrative CVs. In the Evaluation & Culture Focal Area we seek to understand and intervene in this rapidly changing landscape while practising new forms of communicating and valuing research in the daily work of our centre.

    The focal area is divided into two complementary clusters: ReshapingScholarly Communication and Changing Notions of Research Quality.

    Our experts in Scholarly Communication will focus on the intertwining of evaluative practices and research culture in the distinct context of academic publishing. More specifically, the cluster will study the changing social, legal, economic and intellectual organisation of scholarly communication practices. Simultaneously, they will work to actively develop new infrastructures for open publishing and peer review, to be used across diverse research communities.

    Meanwhile, the Research Quality cluster will expand the knowledge base about new movements, interventions and innovations in research assessment reform. Specifically, we will strive to better understand and intervene in new social formations in science that are seeking to re-shape research quality. Of key concern for this cluster is how efforts to institutionalise alternative forms of research quality fare and what consequences this has for how research is organised and valued. Some examples of such dimensions of quality are Equity, Diversity & Inclusion (EDI); open science; societal engagement; sustainability; and research culture.

    Across these two clusters, we aspire to play an active and engaged role in “responsible research assessment transitions” on the local, national, and international stage, for example in the context of the Dutch Recognition & Rewards initiative or the Academia in Motion program at Leiden University. We will also contribute to aligning policy debates around research evaluation with debates around scholarly publishing. Siloing off these domains simply will not do: research assessment reform, after all, requires ‘whole system change’, with transformations in publishing practices needing to be accompanied by changes in funding, universities, research communities and other knowledge production and evaluation settings. One concrete setting in which we already combine our research and intervention activities across the two clusters is the Research on Research Institute, under whose umbrella we carry out a variety of projects co-designed with partner organisations in science funding.

    Like CWTS’s other two Focal Areas, Engagement & Inclusion and Information & Openness, our group brings together different skills, passions and interests. Together our staff members engage with various stakeholders on multiple fronts, be it through shaping policy and organisational processes for the better, delivering state-of-the-art evaluations for clients through our contract research projects, or working on new research frontiers – always with an eye to their implications and practical relevance for the broader research culture.

    If you are interested in exploring further opportunities for working with the Evaluation & Culture Focal Area, please feel free to contact one of our coordinators. For questions on our activities around Reshaping Scholarly Communication, please contact Wolfgang Kaltenbrunner. If you want to get in touch to discuss our activities around Research Quality, please contact Alex Rushforth, Andrea Reyes Elizondo, or Thomas Franssen

    Current members of the focal area: Anestis Amanatidis, Rinze Benedictus, Louise Bezuidenhout, Sarah Rose Bieszczad, Carole de Bordes, André Brasil, Clara Calero Medina, Carey Chen, Eleonora Dagiene, Tom van Drimmelen, Soohong Eum, Thomas Franssen, Margaret Gold, Kathleen Gregory, Laurens Hessels, Myroslava Hladchenko, Andrew Hoffman, Tjitske Holtrop, Wolfgang Kaltenbrunner, Dmitrii Kochetkov, Kwun Hang (Adrian) Lai, Erin Leahey, Thed van Leeuwen, Ed Noyons, Ana Parrón Cabañero, Ismael Rafols, Renate Reitsma, Andrea Reyes Elizondo, Sarah de Rijcke, Alex Rushforth, Alexander Schniedermann, Marta Sienkiewicz, Jorrit Smit, Clifford Tatum, Ludo Waltman, Inge van der Weijden, Jia Zhang

    Header image: SCRIBERIA

    DOI: 10.59350/s1ja4-tca36 (export/download/cite this blog post)

    ]]>
    The changing tunes of science policy: mapping research priorities of consecutive governmentshttps://www.leidenmadtrics.nl/articles/mapping-changing-priorities-in-science-policy-to-government-transitions2024-03-28T14:30:00+01:002024-05-16T23:20:47+02:00When governments change, science policy can be affected as well. This blog post discusses a method to track these shifts using the example of Colombia. Results show that over time, the number and connectedness of research fields in science policy increases, but only a few survive all governments.Imagine national science policy as a musical chair game. The contestants are the science system actors, such as researchers, research groups, universities, companies, among others. Some actors can have more expertise dancing at the rhythm of salsa than hip-hop, while others might be more agile in finding a seat when the music pauses. The government plays or pauses the music, modulates its speed or changes the genre. The hint is that the atmosphere of the game changes when there is a change of government: a government might play more salsa than hip-hop or pause the music more often, giving an edge to some actors over others.

    This is a common scenario in liberal democracies where citizens vote for government candidates each 4 to 6 years. Since each government might enforce policies according to a party’s ideology or program, it might also bring a novel vision and priorities for science policy to the table. Furthermore, in 2024, around half of the world population will vote in elections. It seems crucial to contrast this historical moment with insights on how changes in governments affect science policy priorities and how this can be mapped and analysed.

    In a recent study published in Quantitative Science Studies, we analysed how science policy changed priorities in Colombia from 2007 to 2022. We sourced the strategic fields prioritized in science policy during this period. Public funding and research-oriented calls are administered by Colciencias — now the Ministry of Science, Technology and Innovation. This was our main material to identify strategic fields prioritized by each government in office. We found that the number of strategic fields is getting larger and more interconnected as time passes. Despite this complexity, just a few fields maintained their higher strategic relevance, regardless of the government in office.

    Science Policy

    Science policy can be defined as a set of processes that affect how the rules and practices to develop basic or applied research are designed and implemented within national borders for private and public actors. It also gives shape and direction of knowledge production to actors in the science system.

    Science policy as a network

    Government research calls are a key strategy for science policies. Using co-word analysis, we built the internal structure of research calls, therefore science policy priorities. Co-word analysis enables to visualize the structure of concepts in relation to others.

    For instance, imagine that a given government —in its science policy vision— wants to support research on biotechnology applied to biodiversity, all of that under the purpose of building up bioeconomy capacities in research centres. We will name this Research call 1. In a different call, let's call it Research call 2, the government supports basic research on clean energy, particularly solar cells, to strengthen capacities in knowledge-intensive firms in the bioeconomy sector.

    In the scenario of Research call 1, biotechnology, diversity and bioeconomy are related via their simultaneous inclusion in Research call 1. Therefore, each term can now be transformed into a circle (node) connected with a line (link) to the other term, forming a network. The same happens for Research call 2.

    Even more interestingly, we can see that Research calls 1 & 2 have a term in common in their agenda: bioeconomy. Therefore, bioeconomy serves as an intermediary between Research call 1 & 2. In other words, bioeconomy is a term with relatively high betweenness centrality. Betweenness centrality quantifies the importance of a node in a network based on how often it lies on the shortest paths connecting other nodes (i.e., fields). It acts like a gatekeeper and enables or disables the flow of information between different segments of a network.

    In our context, a research field with higher betweenness centrality, such as bioeconomy in Research calls 1 & 2, facilitates the connection between distinct research areas. As we might suspect, some research fields will reach a higher betweenness centrality score than others.

    This procedure enabled us to determine each government’s science policy priority by grouping each administration's research calls, identifying the strategic research fields mentioned and mapping the connections between them. We can apply this technique to research calls with many research fields or the aggregated set of research calls by a government. We show this procedure in the figure below (Figure 1).

    To standardize research fields, we used the All Science Journal Classification standard. This standard is a Scopus in-house service used by experts when a serial title is set up for Scopus coverage by classifying the title in a subject and area, based on the aims and scope of the title and on the content it publishes. This standard groups science subjects into four areas (physical sciences, health sciences, social sciences, and life sciences) and 333 fields.

    Figure1
    Figure 1. Modelling research priorities in research calls via co-word and network analysis.

    Unveiling changing science policy priorities

    We analysed the structure of 389 research calls issued by Colciencias (now the Ministry of Science, Technology and Innovation, Colombia) between 2007 and 2022. During this period, there were four governments in office, with terms of four years each. We analysed the set of calls of each government. Figure 2 below shows the periods of each government and the numbers of fields with betweenness score per area. The areas with the most fields with betweenness centrality score were physical sciences and social sciences and humanities, followed by life sciences and health sciences.

    It is worth noting that not every field has a betweenness centrality score. Although a field can appear in the science policy vision of a government, this does not mean that it has a gatekeeper role amidst the flow of information between different segments of a network. It can be a peripheral field with a single link to another peripheral field with no particular strategic position.

    Figure2
    Figure 2. Number of fields identified in research calls with betweenness centrality score (y-axis) by area and government periods (x-axis).

    Short vs. long term priorities

    When we looked at the betweenness score changes for those fields identified throughout 2007-2022, we saw that out of 333 fields, 248 were mentioned at least once in all four periods. However, when we selected those with above median betweenness score, the sub-sample was reduced to only 14. These are the fields with sustained relevance for all governments and high strategic value as defined by their betweenness score. Interestingly, health sciences were absent from this list. The figure below shows the changing, although consistent, betweenness score of those 14 strategic fields (Figure 3).

    Image008
    Figure 3. Period-by-period of governments in office (x-axis) and betweenness centrality changes for 14 fields identified throughout 2007-2022 research calls (y-axis).

    When we reduce the list to the top-five most highly strategic fields —or those fields with the top-five highest betweenness centrality score—for all governments between 2007-2022, this results in the following research fields:

    What could explain our results?

    In Colombia, 2015 marked a year of significant research and development investment, reaching 0.37% of the gross domestic product, the highest since 1996. This substantial budget likely empowered policy-making actors, granting them greater influence. Additionally, the expansion of scientific output and interdisciplinary connections could account for the observed interconnected fields between 2015-2018 and 2019-2022. Furthermore, our findings align with a general trend of transition from science policy government to governance, emphasizing the involvement of a broader range of stakeholders in shaping research objectives both within and beyond the scientific ecosystem. This shift acknowledges that science policy priorities may evolve with changes in government and/or the formation of political coalitions.

    What do we learn from this?

    Just like governments change, so do their strategic research priorities. This research helps us understand these shifts and identify the medium-long term research fields prioritized in the underlying dynamic of science policy and its governance. Science policy acts as a rulebook for how governments, universities, and companies conduct research within a country. Ideally, these policies would have a long-term vision, but developing nations like Colombia often struggle with this (more here and here).

    The research presented here offers a way to understand how policy changes impact research focus and provides policymakers with tools to strategically allocate funding. To come back to our analogy from the beginning of the post, our approach shows how to visualize the music score currently being played in the science policy-musical chair game and what have been the most played genres and how pauses might produce a change in this. As a result, we, the science policy players, can learn to dance salsa rather than hip-hop and be more attentive to the position of the chair so as to keep on playing the game.


    Header image: Ardian Lumi on Unsplash
    Doi: 10.59350/6zjf4-wyd11 (export/download/cite this blog post)

    ]]>
    Julián D. CortésCatalina Ramírez
    Global reach, local insights: Using book ISBNs to map publishing behaviourhttps://www.leidenmadtrics.nl/articles/global-reach-local-insights-using-book-isbns-to-map-publishing-behaviour2024-03-21T10:30:00+01:002024-05-16T23:20:47+02:00Hidden data hinders book evaluation. Analysing ISBNs in the Global Register of Publishers gains a powerful tool for bibliometrics, policy development, and nuanced book metrics.Scholarly book evaluation often prioritises ‘prestige’, which leads to inconsistent and unfair outcomes. My previous research shows that such systems consider neither the intrinsic quality of the research nor the accessibility of the work itself. This is why I have cautioned against judging books by their publishers in multiple posts here, here (in English), and here (in Lithuanian).

    After all, how impactful are groundbreaking findings if they remain locked away behind expensive paywalls or inaccessible formats? This disparity demands innovative and responsible metrics that assess both quality and availability, promoting fairer and more effective research evaluation.

    To address this challenge, I embarked on a research journey to understand who publishes the books submitted for evaluation in different countries, including my home country of Lithuania.

    Specifically, I wanted to know whether Lithuanian policymakers reached their goals by financially incentivising publication with ‘prestigious’ foreign publishers for decades. For this, I needed to identify the core businesses of the book publishers as well as the countries where researchers published their works.

    I also wanted to compare Lithuanian results with those of other countries. Thus, I obtained from the Research Council of Lithuania the lists of books submitted to the annual research assessments along with their ISBNs (International Standard Book Numbers).

    Two further data sources were necessary: first, the lists of books submitted for research assessment in another country for comparison, and second, a source of reliable metadata for these books.

    But finding suitable data proved challenging. First, no single database covers all publications across all countries. Second, not every country has a complete list of national outputs. Fortunately, the UK’s REF (Research Excellence Framework) submissions are available to download and explore freely.

    Then came the key breakthrough: I uncovered the power of ISBN codes and their metadata within the Global Register of Publishers, maintained by the International ISBN Agency. Utilising data from this registry, I not only found metadata for every ISBN in my datasets but also gained valuable insights into the publishing landscapes and researchers’ publishing habits in both the UK and Lithuania.

    Before diving deeper into the challenge of assessing academic books, let’s first review the potential of ISBN codes and the Global Register of Publishers for answering questions about scholarly publication norms and trends.

    Unveiling the book publishing world with ISBNs

    Originally designed for book supply chains, ISBNs hold surprising potential for research evaluation because they embed a publisher prefix (Figure 1). This acts like a fingerprint, allowing us to identify the true publisher behind the book, unlike the sometimes-misleading information on copyright pages.

    Figure 1. Structure of an ISBN code, where the first three elements identify the actual publisher.


    For example, a book might list a specific imprint on the copyright page, but the ISBN prefix reveals it belongs to a larger publishing group. If experts judge books by their publishers, this hidden information can be crucial for accurately assessing research outputs and ensuring fairness across institutions.

    And the best part? The publisher’s information is readily available through the Global Register of Publishers, a free database collecting ISBN data from over 150 agencies in 200 countries. As a registered user, anyone can access details about publishers’ main activities, which was crucial for my research.

    When I examined the ISBN data for the UK and Lithuanian books in my dataset, I discovered a complex world of imprints and multiple brands that was often at odds with the statements on the copyright page. For example, a single publisher like HarperCollins might use the same ISBN prefix for dozens of different names, making it hard to tell who is truly behind the book.

    The business dynamics of the publishing world add a further layer of intrigue to the story. Publishers merge and acquire competitors, and some imprints move back and forth between publishers. The same imprint may change hands multiple times and even be spun off as an independent company. This shifting landscape highlights the limitations of traditional evaluation methods that rely solely on publisher reputation.

    But what does this mean for fairer and more effective research assessment? My analysis of ISBN data offers surprising insights about book publishers and their relationships with researchers.

    An uneven playing field: Open access vs. prestige in scholarly book evaluation

    The metadata of book ISBNs from the UK and Lithuania revealed a disparity between national policies and publishing practices. While the UK prioritises open access, promoting accessibility over publisher prestige, some universities still emphasise established publishers for REF submissions. This contradiction between policy and practice might explain why the REF claims neutrality towards publisher standing. Since my study focused on publishing behaviour only, further research on book accessibility would be valuable to explore the proportion of REF books providing open access.

    Lithuania, on the other hand, explicitly encourages publishing with prestigious foreign academic publishers by offering financial incentives. Policymakers assume that prestigious publishers guarantee wide dissemination. No policy mentions accessibility. However, my research shows these incentives have not been effective. To the contrary, many Lithuanian academics struggle to access these coveted top-tier publishers, and a significant portion of their books are published domestically or through self-publishing channels.

    The data below illustrates the uneven playing field:

    • For the UK’s REF books, the concentration of renowned publishers potentially limits accessibility due to paywalls, despite the national open access policy (Figure 2).
    • For Lithuanian books, smaller occasional publishers collectively publish more books than the top ten, but some might lack the resources to ensure accessibility through various formats (Figure 3).
    Figure 2. Number of REF books published by the top 10 publishers and others.


    Figure 3. Number of Lithuanian books published by the top 10 publishers and others.


    Who publishes these books? UK scholars rely on established academic publishers, while Lithuanians show a shift towards universities, self-publishing, and firms or institutions whose core business lies outside publishing (Figures 4 and 5). This seems to indicate challenges for Lithuanians in securing a prestigious publisher, despite the financial incentive to do so.

    Figure 4. Share of REF books by publisher type.


    Figure 5. Share of Lithuanian books by publisher type.


    Where do researchers publish? Analysing ISBN data shows that UK researchers primarily publish in Europe, predominantly with domestic publishers (Figure 6). In contrast, Lithuanian scholars currently publish more books abroad, with domestic publications declining since only foreign publishers can be awarded the ‘prestigious’ label (Figure 7). This may seem to suggest that Lithuanian policymakers succeeded in incentivising publisher prestige, but Figure 5 shows that academic publishers produced only a quarter of Lithuanian books over 12 years, which casts doubt on the policy’s effectiveness.

    Figure 6. Share of REF books by country of publisher.


    Figure 7. Share of Lithuanian books by country of publisher.


    Both countries exhibit a disconnect between policy and practice. However, the UK's REF mandates open access from 2024 onward. This policy update should be a boon to accessibility in UK scholarly publishing. It also offers a framework for Lithuania and other countries to prioritise accessibility alongside merit of scholarly books.

    Advancing research evaluation: The scientometric potential of ISBN data

    Policy recommendations
    Based on my findings, I recommend a multi-pronged approach to address the identified issues in Lithuania's book evaluation system.

    Firstly, since most Lithuanian books were produced by universities and non-professional academic publishers, Lithuanian policymakers should stop incentivising publisher prestige alone. Instead, they can pilot an open access policy for research outputs, similar to the UK's REF, to ensure wider accessibility alongside merit-based evaluation. Notwithstanding potential concerns about cost or implementation complexity, the long-term benefits in terms of transparency and efficiency should be carefully considered.

    Secondly, exploring the adoption of a system that leverages ISBN codes and the Global Register of Publishers for book metadata could streamline data collection and provide valuable insights into the publishing landscape.

    Contribution to scientometrics
    By unlocking the potential of an important but underutilised data source, my work opens new avenues for scientometrics, policymaking, and book metrics development.

    Scientometricians can now access reliable and comprehensive book metadata, enabling them to conduct more accurate and nuanced analyses of each country’s research outputs. Policymakers, meanwhile, can learn about the practicalities of the book industry, guiding the development of more effective research evaluation practices. Developers of book metrics can leverage these findings to create new and improved indicators that reflect the diverse landscape of scholarly publishing.

    Future research
    My work also suggests several key research questions to further refine our understanding of scholarly book evaluation and publishing practices.

    Firstly, a comprehensive analysis of the accessibility of currently submitted books in Lithuania is needed. This would involve identifying the available formats and platforms for accessing these books and assessing any barriers that might exist.

    Secondly, exploring the availability and potential sources of additional metadata for national research outputs is crucial. This could entail investigating data from national libraries, repositories, and other book-relevant sources.

    Finally, it is essential to determine the feasibility and impact of incorporating ISBN-based metadata into existing book evaluation frameworks. Research along this line would involve pilot studies and comparisons with traditional methods to assess the effectiveness and potential benefits of this approach.

    By addressing these key questions, future research can build upon the findings of my study and contribute to the development of more robust and equitable book evaluation systems.

    I sincerely appreciate the help of Stella Griffiths, executive director of the International ISBN Agency, who not only answered practical questions about the standards and their application but graciously took the time to review the manuscript "The challenge of assessing academic books: The UK and Lithuanian cases through the ISBN lens." Her insightful suggestions greatly improved the clarity and precision of my research on ISBNs.


    Header image: marouh
    DOI: 10.59350/j5484-3zf84 (export/download/cite this blog post)

    ]]>
    Eleonora Dagienehttps://orcid.org/0000-0003-0043-3837
    Concurrent Evidence: a framework for using evidence from multiple disciplineshttps://www.leidenmadtrics.nl/articles/concurrent-evidence-a-framework-for-using-evidence-from-multiple-disciplines2024-03-07T10:51:00+01:002024-05-16T23:20:47+02:00In policy and legal systems, focusing too narrowly on one scientific discipline can lead to questionable conclusions. In this post, Tsuyoshi Hondou and Ismael Rafols introduce ‘Concurrent evidence’, a framework that considers evidence from multiple disciplines to reach more robust decisions.Studies on transdisciplinary research often focus on how different forms of expertise are brought together to build robust knowledge. However, in policy and legal affairs, there are many situations in which it is not possible to use new transdisciplinary knowledge due to contextual factors, such as urgency, political expediency, or lack of resources. Instead, policy and legal decisions often need to be made in the face of contradictory evidence coming from different disciplines. Under these conditions, advice is sometimes taken without sufficient scrutiny from the more legitimate or conventional disciplinary sources, which may lead to problematic decisions.

    In this blog post, we present two prominent examples of how the use of narrow disciplinary advice led to questionable policy choices. Then, we propose Concurrent Evidence as a methodological framework to improve the procedures for the adoption of evidence, building on a deliberative process of evidence initially developed for legal cases.

    Case 1: Likelihood of tsunamis hitting nuclear power plants in Fukushima: physics vs. geology

    The first case concerns the advice on the locations of nuclear plants in Fukushima. Using as evidence about 100 years of seismograph measurements (i.e. ground movements), geophysicists showed that there was no evidence that a tsunami could hit the locations proposed for the nuclear plants. In contrast, from observations of tsunami deposits formed over thousands of years in the physical structure of the earth, geologists concluded that tsunamis could hit plants in those locations and that this might constitute a problem. The geological evidence was reported in 2010 to the government, before the earthquake in 2011. However, the Japanese government listened to the advice given by seismology (physics) rather than by geology, despite a longer observation record from the latter – with the well-known disastrous consequences. 

    Case 2: Infection route of COVID-19

    The second case concerns advice on how to prevent COVID-19 infections. It was initially thought that COVID-19 infection was due to physical contact and droplets, and therefore appropriate prevention measures were thought to be disinfection and shielding. This advice was based on the common perception of medical doctors, who extrapolated from the dogma that airborne infection is restricted to tuberculosis, measles, and chickenpox. However, it was later shown by researchers with expertise in physics that masks and ventilation - the key to prevention against airborne infection - are much more effective than conventional prevention measures against infections. Nevertheless, even today, the Japanese government has not yet fully acknowledged the airborne nature of COVID-19. 

    As a result of this lack of attention to airborne infection, and also due to the resistance to challenge the old medical dogma, prevention measures against airborne infection have been insufficiently implemented in Japan. For example, ventilation systems that can easily accommodate heating and cooling are not widely installed in schools. Experts with knowledge of physics pointed out that the National Institute of Infectious Diseases wrongly classified the cases of airborne infection into contact or droplet until 2022, and sent an open question to the national institute, which was not specifically answered. In 2022, after this open question, the government finally acknowledged the key role of aerosol transmission. But even in 2023, the government stated that airborne transmission is different from aerosol transmission. Meanwhile, the infection situation worsened: the annual number of deaths from COVID-19 in Japan in 2022 was 12 times higher than in 2020. In this case, advice from traditional voices within the medical sector took priority over advice based on perspectives more grounded in physics. 

    How to deal with expert evidence from different disciplines?

    We propose that the advice assessment in cases such as those above could have been substantially improved with a policy process that was more open to multi- and interdisciplinary perspectives. Here, we review a method, Concurrent Evidence, that was initially developed in Australia and that has been adopted by courts in several countries. 

    Photo 1515187029135 18ee286d815b

    The method of Concurrent Evidence was inspired by the ‘conferences’ in hospitals (meeting for discussion) held among medical doctors from different disciplines (e.g. surgeon, physician, and radiologist) in order to find the best therapeutic approach, for example, a cancer treatment. In several court experiences, the method of Concurrent Evidence has demonstrated the importance of plural advice, which is emphasized by Andy Stirling in the context of science policy. 

    Concurrent Evidence consists of two stages:

    Stage 1: Joint Conference

    In the first stage, called Joint Conference, the questions to be discussed among experts are provided by the court. The experts autonomously debate the answers to the questions and write a Joint Report (by themselves). The experts have to clarify on which points they agree and on which points they do not agree. For issues they do not agree on, they have to clarify on what and why they do not agree.

    Stage 2: Hot Tubbing

    In the second part, the experts are invited to the court simultaneously. They are usually seated together in the witness box; hence the situation is called Hot tubbing. The judge chairs and both the judge and the lawyers ask questions to the experts based on the report of the Joint Conference. At this stage, discussions on disagreements across experts are encouraged. This process reveals the basis of the different opinions of the experts and allows the judge to quickly and easily determine which evidence is suitable for legal judgement.

    Developing science policy methods of transdisciplinary evidence inspired by legal experiences

    We propose that the structured discussion proposed for legal cases may under certain conditions be suitable for the use of evidence from multiple disciplines in policy. This raises a number of issues regarding the specific choices in implementation, such as who makes the questions to the experts and who chairs the discussion during the Hot tubbing. These issues can be best addressed in specific policy contexts.

    As we have seen, undesirable decisions are sometimes made due to a lack of attention in policy to the contrasting knowledge and answers provided by different disciplines. We have to recognize that policy making requires quick decisions under conditions of high uncertainty and with disparate advice from different sources. This may lead to non-optimal solutions. Processes that consider plural perspectives such as Concurrent Evidence can help in reaching better decisions.

    Header image by @darkroomsg
    Image in text by Antenna

    DOI: 10.59350/j5484-3zf84

    ]]>
    Tsuyoshi HondouIsmael Rafolshttps://orcid.org/0000-0002-6527-7778
    Citizen Science in the CWTS Knowledge Agendahttps://www.leidenmadtrics.nl/articles/citizen-science-in-the-cwts-knowledge-agenda2024-03-05T10:00:00+01:002024-05-16T23:20:47+02:00Participatory practices such as Citizen Science are key to achieving the open engagement of societal actors in research, one of the core pillars of Open Science. In this blog post, the coordinator of the Citizen Science Lab introduces the vision for Citizen Science in the CWTS Knowledge Agenda.Throughout a recent series of blog posts, we have been introducing the CWTS knowledge agenda for 2023-2028, which is divided into three new focal areas to organise our activities on specific themes. Within each of these focal areas, we are investigating and challenging the way science is practised and governed, and how society is engaged and included in the science ecosystem, with the aim of actively contributing to a stronger and healthier research system. One of these is the Engagement and Inclusion Focal Area, which aims to contribute to a more collaborative, engaged, and inclusive research system.

    Open science 3
    UNESCO OS Recommendations.

    Opening the research and innovation system to the participation of societal actors is one of the central pillars of the UNESCO Recommendations on Open Science. This not only relates to the ethos that scientific knowledge is a common good that all people have the right to benefit from but also relates to the more urgent need to facilitate the participation of actors across society towards jointly tackling the challenges facing us as a society, from climate change to global health pandemics. These issues require the inclusion of diverse perspectives and insights, as well as co-ownership and action from all stakeholders. Citizen Science and other participatory practices make a meaningful contribution towards both these aims.

    Citizen Science in the Research Landscape

    The field of Citizen Science has been making great advances over the past decade, involving increasing numbers of citizens in monitoring, observing, and co-researching societal issues such as climate change impacts on the environment and public health, and human impacts on our living environment and nature. Such initiatives have been achieving important outcomes from fundamental scientific discoveries, to aggregated data that support evidence-informed policy. The longer-term impacts from participating in such collaborative research can include community co-ownership of urgent issues, increased science literacy and learning, and the empowerment of individual and collective action towards addressing these issues.

    A wide range of practices fall under the umbrella term ‘Citizen Science’, but the common factor is the genuine participation of members of society outside academia in any stage of the research processes towards producing new knowledge or other science outcomes - from citizens & community groups to civil society organisations & non-governmental organisations - across virtually all scientific disciplines.

    Heritage2
    Volunteers set to work for Heritage Quest.

    For example, in the category of ‘new discoveries’, the Leiden University-led Heritage Quest project engaged volunteers in archaeological research on their home computers by inviting them to identify and mark archaeological features such as burial mounds that would otherwise be hidden by vegetation, in high-resolution LiDAR images. Volunteers were then invited to join archaeologists in the field in the Veluwe and surrounding area to verify the findings, resulting in the discovery of 80 new burial mounds, 36 km2 of prehistoric fields, approximately 900 charcoal pits, and numerous examples of ancient cart tracks - leading to a new understanding of the settlement history of the region.

    Grachtwacht
    Volunteers joining the weekly Canal clean-ups.

    More locally in the category of ‘policy impact’, the Grachtwacht initiative led by PhD candidates Liselotte Rambonnet and Auke-Florian Heemstra has been cleaning the canals of Leiden with over 600 volunteers in canoes removing, sorting, and assessing macro litter in the urban waterways since 2018 - leading to deeper insights into the types and sources of urban litter, and policy actions for tackling these at the source based on data-driven policy recommendations and reports.

    At the European level, the European Commission (EC) views citizen engagement practices as essential to achieving the strategic aims of the European Green Deal. They are woven throughout the funding instruments of Horizon Europe, including the European clusters and Missions, and the New European Bauhaus. Citizen Science is also being embedded by the EU Member States in their national science policies to involve stakeholders across the quadruple helix in Research & Innovation (R&I) - as can be seen in the Dutch National Programme Open Science (NPOS) 2030 Ambition, and the NWO Open Science NL work programme for 2024-2025.

    The ‘Science of Citizen Science’

    The Citizen Science Lab at Leiden University is helping to mainstream participatory research practices in all domains by functioning as a knowledge hub for Citizen Science within the Open Science Programme, and as a project incubator partnering with researchers, policy-makers, and societal stakeholders to collaboratively address urgent and societally-relevant issues.

    Within CWTS, the Citizen Science Lab functions as a research centre for the 'Science of Citizen Science’, investigating for example the ‘added value’ of participatory research practices on the quality of research and its outcomes, and evaluating and monitoring the range of impacts and outcomes of participatory methods.

    Citizen Science in the CWTS Knowledge Agenda

    At the heart of the new CWTS Knowledge Agenda is the consideration of how research evaluation in its many forms impacts research agenda-setting, notions of quality, and daily practices of research and scholarly communication; how meaningful public engagement in research processes impact the value and relevance of academic research; how academia and academic career pathways can become more inclusive and diverse; and how structural inequities and lack of diversity and inclusion in global science can be addressed.

    The Citizen Science Lab will contribute to tackling these and other questions regarding the engagement of societal actors in knowledge production in the activities of the Engagement and Inclusion focal area and regarding the impact and evaluation of these practices in the activities of the Evaluation and Culture focal area.

    If you are interested in finding out more about Citizen Science and joining us on this journey, please contact Citizen Science Lab coordinator Margaret Gold.

    Citizen Science at Leiden University

    At Leiden University, we see Open Science as a crucial way to make a greater scientific and societal impact, and we actively seek new ways of recognising and rewarding our employees for putting open science, collaboration, well-being, and leadership at the heart of our work. The Academia in Motion (AiM) programme aims to make Leiden University a more open workplace that recognises and rewards all contributions, and an institution that creates and shares knowledge more freely with society.

    One focus of the Academia in Motion programme is the integration of Citizen Science and other societal engagement practices across all research and education at the university, embedded within the Open Science Programme. A core goal is to raise awareness about the value and impacts of various participatory practices, which is partly achieved via the ‘Citizen Science at Leiden University Teams community.

    Both the Open Science Community Leiden (OSCL) and the Citizen Science Lab offer opportunities to get started with Citizen Science and other participatory practices:

    OSCL hosts workshops, talks, and walk-in hours on many Open Science topics, including Citizen Science. Anyone is welcome to join the OSCL community. Information about upcoming events can be found on the OSCL Teams channel.

    The Citizen Science Lab can offer made-to-order workshops, training, and seminars on participatory research practices in any field of research or teaching, and can be turned to for support and advice on applying these practices in your own work. Get in touch with coordinator Margaret Gold, or join the Citizen Science at Leiden University Teams community, to find out more about upcoming events, ask questions, and share your own experiences with others. You can also access the growing repository of resources in the CS & UL Teams Wiki. Follow the Citizen Science lab on LinkedIn and Mastodon.


    Header image from Friso de Hartog
    UNESCO OS Recommendations. Source: UNESCO
    Volunteers set to work for Heritage Quest. Source: Universiteit Leiden
    Volunteers joining the weekly Canal clean-ups. Source: De Grachtwacht

    DOI: 10.59350/z2mgz-fq313

    ]]>
    Margaret Goldhttps://orcid.org/0000-0003-4853-2463
    The UNESCO Open Science Outlook: OS progresses, but unequallyhttps://www.leidenmadtrics.nl/articles/the-unesco-open-science-outlook-there-is-progress-in-os-but-it-is-unequal2024-02-01T10:55:00+01:002024-05-16T23:20:47+02:00Last December, UNESCO published the first global report on the trends of Open Science (OS). In this blog post, the main findings are highlighted: OS is increasing but does so unevenly and its monitoring is mainly focused on outputs, missing potential progress in participation and dialogue.A value-led perspective on Open Science

    In 2021, UNESCO approved its Recommendation on Open Science (OS). By signing this recommendation, 193 countries made a commitment to support the development of OS with a vision of science as a global public good

    According to this vision, science is only genuinely “open” when it embraces some core values and principles, as illustrated in Figure 1. These include transparency, reproducibility and integrity, as generally claimed in OS frameworks, but also equity, fairness, diversity and inclusiveness, and a commitment to contribute to collective benefits, which are less often invoked in OS policies.

    Figure 1. The values and principles of Open Science as defined by the UNESCO Recommendation on Open Science.

    Findings of the Outlook: more Open Science, but unevenly distributed

    Two years after the signature of the OS Recommendation, the UNESCO OS Outlook is the first (pilot) global monitoring exercise on the progress of OS according to this value-led perspective.

    (Note that the UNESCO OS Outlook will be introduced by Dr. Tiffany Straza in a CWTS webinar on 2nd February, 2024, 15:00-16.15 CET).

    The good news is that there is a strong trend towards“open” (i.e. accessible) scientific outputs: the share of Open Access (OA) publications is quickly increasing; the Outlook shows evidence of more sharing of datasets, software and educational resources; and an increase in participatory approaches to science.

    There are, however, two downsides to this growth. First, OS has progressed faster in rich countries and organisations. This is no surprise: the transition towards OS requires significant financial and human resources; therefore wealthy countries and organisations are in an advantageous position to adopt OS.

    However, this inequality also reflects choices made regarding the types of OS to develop. For example, as shown in Figure 2, OA has mainly grown via the adoption of gold and hybrid OA models (with substantial costs for organisations), although diamond and green OA provide more affordable and more equitable alternatives. Given differences in resources and distinct publishing traditions, OA in Western countries has advanced via gold and hybrid models, whereas regions such as Eastern Europe and Latin America have kept a substantial share of diamond OA (as shown in Figure 3). In short, the expansion of gold and hybrid models of OA has led to territorial inequality in the visibility and prestige of publications.

    Figure 2. Proportion of publications by Open Access (OA) category in the year of their publication. Source: UNESCO Open Science Outlook.


    Figure 3. Proportion of publications by Open Access (OA) category in different world regions for 2012 to 2021. The differences reflect publishing traditions and access to financial resources. Source: UNESCO Open Science Outlook.


    The second gap found by the UNESCO OS Outlook is that monitoring efforts have mainly focused on scientific outputs (primarily in scientific publications, and secondly on datasets, software and hardware), but much less on OS processes, outcomes or values. This means that there are too few monitoring efforts on axes of open science such as the use of collective infrastructures, participatory activities or dialogues with other knowledge systems; and little empirical evidence on the alignment of OS progress with values and principles.

    The dangers of this uneven monitoring (a focus on outputs but not on processes and values) is the so-called ‘streetlight effect’: that policy attention focuses on those activities that can be monitored, leaving behind the disciplines, practices, topics and territories which conduct open science in ways that are not visible to traditional scientific indicators. Such bias is particularly problematic because OS as dialogue and participation is key to help aligning research with societal problems and challenges.

    Opening up the monitoring of Open Science: more activities, more voices

    In summary, the UNESCO OS Outlook highlights that OS is making progress, but that this progress is uneven in two senses: it is concentrated in the rich organisations and countries, and it appears to be focused (according to current monitoring tools) more on the internal scientific outputs than on knowledge creation and exchange with societal stakeholders.

    These findings deserve some reflection in relation to current OS policies.

    In terms of monitoring, new frameworks are needed that are more comprehensive, more pluralistic and which include value considerations. In particular, we have proposed that approaches to assess OS should aim to address all aspects and values of OS: first, broadening out the battery of OS activities captured (from outputs/papers to processes/engagements); second, opening up the monitoring to consider the diversity of possible OS trajectories (which directions align with stated values? gold or green? FAIR or CARE datasets?); third contextualising the description of OS (e.g. high energy physics in Tokyo and applied agriculture in rural India require different types of OS).

    In terms of inequalities, an explicit monitoring on inclusiveness and collective benefits is crucial, because science has historically excluded some social groups (e.g. women and non-Westerners), as argued by scholars such as Sandra Harding. Also, current research systems tend to produce, in relative terms, more benefits for the richer countries (e.g. in the field of health research) and for the richest societal sectors (e.g. Big Tech).

    See this blog and this preprintfor a more extensive discussion on the challenges of monitoring OS.

    Header image: UNESCO
    DOI: 10.59350/91td8-0bv95

    ]]>
    Ismael Rafolshttps://orcid.org/0000-0002-6527-7778
    Introducing the Leiden Ranking Open Editionhttps://www.leidenmadtrics.nl/articles/introducing-the-leiden-ranking-open-edition2024-01-30T13:01:00+01:002024-05-16T23:20:47+02:00This post introduces the Open Edition of the CWTS Leiden Ranking, published today by CWTS in collaboration with the Curtin Open Knowledge Initiative, Sesame Open Science, and OurResearch. The Leiden Ranking Open Edition is the first fully transparent university ranking.When the Shanghai Ranking, also known as the Academic Ranking of World Universities (ARWU), was launched in 2003, Ton van Raan, director of CWTS at the time, sounded the alarm about the problematic way in which the ranking uses bibliometric data, for instance in attributing publications to universities. In response to the Shanghai Ranking, CWTS decided to launch the Leiden Ranking, aiming to demonstrate more appropriate ways to use bibliometric data for comparing universities. While the Leiden Ranking did not gain the same visibility as the Shanghai, THE, and QS rankings, it developed a strong reputation for offering a robust, high-quality approach for comparing universities in terms of bibliometric parameters.

    Today, after almost two decades, the Leiden Ranking is going to take an ambitious next step in improving bibliometric approaches for comparing universities. The Open Edition of the Leiden Ranking, launched today by CWTS, addresses one of the most challenging problems of bibliometric indicators: the lack of transparency of these indicators due to their dependence on proprietary data. Together with the Curtin Open Knowledge Initiative (COKI), Sesame Open Science, and OurResearch, CWTS has rebuilt the Leiden Ranking, making it fully transparent by working exclusively with open data and open source algorithms. Until now, the Leiden Ranking has always been based on data from Web of Science, a proprietary data source owned by Clarivate. The Leiden Ranking Open Edition uses data from OpenAlex, a fully open data source created by OurResearch. To the best of our knowledge, the Leiden Ranking Open Edition is the first fully transparent university ranking.

    The importance of transparency of university rankings is widely recognized. CWTS emphasizes the need to be transparent in its ten rules for ranking universities. Transparency also features prominently in the criteria for fair and responsible university rankings developed by the International Network of Research Management Societies (INORMS). These criteria were used in the rethinking the rankings initiative. Likewise, transparency and openness are key elements in the strategy for culture change regarding university rankings that is currently being implemented in the Netherlands. More in general, the UNESCO Recommendation on Open Science highlights the need for “open bibliometrics and scientometrics systems”. In a similar vein, the Agreement on Reforming Research Assessment stresses the importance of “independence and transparency of the data, infrastructure and criteria necessary for research assessment”.

    How did we create the Leiden Ranking Open Edition?

    The Leiden Ranking Open Edition aims to reproduce the traditional Leiden Ranking as closely as possible, focusing on the Leiden Ranking 2023 that was published in June last year. The Open Edition includes the same 1411 universities that are also included in the Leiden Ranking 2023. Instead of proprietary data from Web of Science, the Open Edition uses open data from OpenAlex. This data is harvested by OpenAlex from a variety of sources, including Crossref, PubMed, and the websites of publishers. The Open Edition is based on the OpenAlex snapshot released on November 21, 2023.

    Figure 1 summarizes the process of creating the Leiden Ranking Open Edition. We now discuss the different steps in this process.

    Figure 1. Summary of the process of creating the Leiden Ranking Open Edition.


    Core publications

    Web of Science and OpenAlex differ in their coverage of the scientific literature. Most publications covered by Web of Science are also covered by OpenAlex, but OpenAlex covers many publications that Web of Science does not cover. The traditional Leiden Ranking focuses on so-called core publications, which are identified based on a number of criteria. The Open Edition also has a focus on core publications, identified based on similar criteria. However, because of coverage differences between Web of Science and OpenAlex, the set of core publications considered in the Open Edition differs from the set of core publications considered in the traditional Leiden Ranking. This is discussed in more detail in this blog post.

    Publication classification

    The Leiden Ranking relies on a detailed algorithmic classification of publications into research areas. This classification is used to assign publications to main fields and to calculate normalized citation impact indicators. For the Open Edition, CWTS created a new classification of publications based on OpenAlex data. This blog post provides more details.

    CWTS organization registry

    OpenAlex uses ROR (Research Organization Registry) identifiers for organizations, while the Leiden Ranking has traditionally used internal CWTS organization identifiers. For the Open Edition, CWTS created a new organization registry by matching CWTS organization identifiers to ROR identifiers. This was done for the 1411 universities included in the Open Edition and for the affiliated organizations linked to these universities. Additional links between universities and affiliated organizations were obtained from the ROR organization registry. Links between universities and their affiliated organizations are presented in a transparent way on the website of the Open Edition (see Figure 2).

    Figure 2. Screenshot of the website of the Leiden Ranking Open Edition showing the links between University of Amsterdam and its affiliated organisations.


    Publication-university links

    OpenAlex provides ROR identifiers for the affiliations of authors of publications. We linked publications to universities by connecting ROR identifiers obtained from OpenAlex to the ROR identifiers of universities and their affiliated organizations in the CWTS organization registry. In this blog post the CWTS team presents a comparison between the approach for linking publications to universities used in the traditional Leiden Ranking and the approach used in the Open Edition.

    Indicators

    The Open Edition includes the same bibliometric indicators as the traditional Leiden Ranking, except for indicators of gender diversity. These indicators are somewhat more challenging to produce using OpenAlex data because OpenAlex does not make a distinction between first and last names of authors. This distinction is important for algorithmic gender inference. At the moment gender diversity indicators are therefore not included in the Open Edition. We may add them in the future.

    How to access the data and software

    The data used to create the Leiden Ranking Open Edition is openly available in Zenodo under a CC0 public domain dedication. The data can also be accessed through Google BigQuery (to run queries you need to have a BigQuery account and your own project). Universities may for instance use the data to check whether publications have been correctly attributed to them. Performing such checks is not possible in the case of the traditional Leiden Ranking, since this ranking is based on proprietary data that cannot be shared openly.

    The source code of the software used to create the Leiden Ranking Open Edition is openly available in GitHub under an MIT license. A Microsoft SQL Server database system was used to perform the data processing and the calculations. The source code therefore consists mostly of SQL scripts.

    How to compare the Open Edition with the traditional Leiden Ranking

    To what extent does the Open Edition provide results that are similar to those provided by the traditional Leiden Ranking? To address this question, we have created an interactive dashboard in which the values of the indicators in the two editions of the Leiden Ranking can be easily compared.

    The interactive dashboard can for instance be used to explore the correlation between the number of publications of a university in the traditional Leiden Ranking and in the Open Edition (see Figure 3), or the correlation between a university’s proportion of highly cited publications in the two editions of the Leiden Ranking (see Figure 4).

    Figure 3. Correlation between the number of publications of a university in the traditional Leiden Ranking and in the Open Edition (fractional counting).


    Figure 4. Correlation between the proportion of highly cited (top 10%) publications of a university in the traditional Leiden Ranking and in the Open Edition (fractional counting).


    In general, we consider the correlations between indicator values in the two editions of the Leiden Ranking to be quite strong. However, for some universities there are large differences between the two editions of the Leiden Ranking. In many cases this is probably due to differences in the publications attributed to a university. This issue is analyzed in more detail in this blog post.

    What is next?

    At the moment the Leiden Ranking Open Edition is still of an experimental nature. Building the ranking was an incredibly useful exercise for our organizations (CWTS, COKI, Sesame Open Science, and OurResearch). We also expect to learn a lot from the feedback we hope to receive from users of the Open Edition. Based on the lessons learned, we will make further improvements to the Open Edition. Within one or two years, we expect the Open Edition to be fully mature and to offer a full replacement for the traditional Leiden Ranking.

    While our organisations are making further improvements to the Leiden Ranking Open Edition, CWTS will continue to release annual updates of the traditional Leiden Ranking based on Web of Science data. In the next one or two years, we expect the traditional Leiden Ranking and the Open Edition to co-exist. In the somewhat longer term, CWTS will make a full transition to open research information. Within the next few years, all bibliometric indicators produced by CWTS, including those in the Leiden Ranking, will be based on open data.

    The transition of the Leiden Ranking toward open data fits into broader discussions about openness of research information, responsible use of bibliometric indicators, and reform of research assessment. Critical reflection on the value of university rankings should be part of these important discussions.

    How to get in touch

    Would you like to know more about the Leiden Ranking Open Edition? CWTS is organizing two webinars about the Open Edition, providing an opportunity to discuss the ranking with members of the CWTS team. The first webinar takes place on February 6 at 10h CET, and the second webinar on February 9 at 15h CET. COKI, in collaboration with Future Campus, is offering a webinar with an Australian focus on January 31 at 11h AEDT. OpenAlex is organising a webinar about institutional profiles and affiliation curation on February 8 at 12h EST.

    We also invite you to reach out to us using the contact form on the website of the Leiden Ranking Open Edition. We appreciate your comments and feedback on the Open Edition.

    Do you want to start working yourself with open bibliometric data sources such as OpenAlex? You may then consider signing up for the course Scientometrics Using Open Data organised by CWTS, COKI, and Sesame Open Science. The next edition of this online course takes place from March 25 to March 28.

    Header image from https://www.leidenranking.com

    ]]>
    Ludo WaltmanNees Jan van Eckhttps://orcid.org/0000-0001-8448-4521Martijn VisserMark NeijsselLucy MontgomeryCameron NeylonBianca KramerKyle DemesJason Priem
    Opening up the CWTS Leiden Ranking: Toward a decentralized and open model for data curationhttps://www.leidenmadtrics.nl/articles/opening-up-the-cwts-leiden-ranking-toward-a-decentralized-and-open-model-for-data-curation2024-01-30T13:00:00+01:002024-05-16T23:20:47+02:00Today, CWTS released the Open Edition of the Leiden Ranking. This blog post discusses the data curation approach taken in this fully transparent edition of the Leiden Ranking.The need to increase the transparency of university rankings is widely recognized, for instance in the ten rules for ranking universities that we published in 2017, in the work done by the INORMS Research Evaluation Working Group, and also in a recent report by a Dutch expert group on university rankings (co-authored by one of us). It is therefore not surprising that the announcement of the Open Edition of the CWTS Leiden Ranking in 2023 got considerable attention and triggered lots of highly supportive responses.

    The announcement also led to questions about the quality of the data used in the Leiden Ranking Open Edition, in particular the affiliation data for linking publications to universities. In this post, we address these questions by distinguishing between two models for curating affiliation data: the centralized and closed model and the decentralized and open model. While the traditional Leiden Ranking relies primarily on the centralized and closed model, the Open Edition released today represents a movement toward the decentralized and open model.

    The centralized and closed model for data curation

    In the centralized and closed model, a central actor in the system takes responsibility for data curation. The data is closed. It can be accessed only by selected users, who typically need to pay to get access.

    The traditional Leiden Ranking, based on closed data from Web of Science, takes a mostly centralized approach to curating affiliation data. While some basic data curation (standardizing affiliation strings) is performed by Web of Science, the bulk of the work is done by CWTS (determining which standardized affiliation strings refer to the same ‘unified organizations’). Because Web of Science data is closed, CWTS is unable to share the curated data. This means there is no easy way for universities to check the quality of the data.

    The decentralized and open model for data curation

    In the decentralized and open model, data curation takes place in a decentralized way. Different actors in the system take responsibility for different parts of the data curation process. All data is fully open, which facilitates collaboration between the different actors.

    The Leiden Ranking Open Edition, based on open data from OpenAlex, takes a mostly decentralized approach to curating affiliation data. Contributions to the data curation process are made by a number of different actors:

    • The Research Organization Registry (ROR) provides ROR IDs for research organizations.
    • Publishers deposit publication metadata, including author affiliations, to Crossref and PubMed.
    • Crossref and PubMed make publication metadata, including author affiliations, openly available.
    • OpenAlex ingests author affiliations from Crossref and PubMed. It performs web scraping to obtain missing author affiliations. It then uses a machine learning algorithm to map affiliation strings to ROR IDs.
    • CWTS maps ROR IDs to ‘unified organizations’. For instance, the ROR IDs of Leiden University (https://ror.org/027bh9e22) and Leiden University Medical Center (https://ror.org/05xvt9f17) are both mapped to Leiden University, since the Leiden Ranking considers Leiden University Medical Center to be part of Leiden University.

    The above actors all share data openly. This enables research organizations to check the quality of the data and to contribute to the data curation process by reporting data quality problems to the relevant actors (e.g., ROR, OpenAlex, or CWTS).

    How much difference does it make?

    Over the past months, many people have asked us to what extent results obtained from the data curation approach taken in the Leiden Ranking Open Edition are different from results obtained from the data curation approach of the traditional Leiden Ranking. To answer this question, we match publications in OpenAlex and Web of Science based on DOIs and we then use this matching to compare the results obtained using the two data curation approaches. Our focus is on publications from the period 2018-2021.

    We first compare the overall set of publications included in the traditional Leiden Ranking to the overall set of publications included in the Open Edition. The traditional Leiden Ranking includes all publications in Web of Science that are indexed in the Science Citation Index, the Social Sciences Citation Index, or the Arts & Humanities Citation Index, that are classified as research article or review article, and that meet a number of additional criteria. Likewise, the OpenEdition includes all publications in OpenAlex that are classified as article or book chapter, that have affiliation and reference metadata (for some publications this metadata is missing in OpenAlex), and that meet additional criteria similar to those used in the traditional Leiden Ranking. Figure 1 shows the overlap of the two sets of publications.

    Figure 1. Overlap of publications in the traditional Leiden Ranking and the Open Edition.


    Of the 9.3 million publications included in the Open Edition, 2.5 million (27%) are not included in the traditional Leiden Ranking. The most important reason is that publications are not covered by the Web of Science citation indexes on which the traditional Leiden Ranking is based (i.e., Science Citation Index, Social Sciences Citation Index, and Arts & Humanities Citation Index). This explains why 1.7 million publications (19%) included in the Open Edition are not included in the traditional Leiden Ranking.

    Conversely, of the 7.4 million publications included in the traditional Leiden Ranking, 0.7 million (9%) are not included in the Open Edition. There are several reasons for this. Inconsistencies in publication years (e.g., a publication was published in 2017 according to OpenAlex, while it was published in 2018 according to Web of Science) are an important reason, explaining why 0.2 million publications (3%) are not included in the Open Edition while they are included in the traditional Leiden Ranking. However, the most important reason is missing affiliation data in OpenAlex. 0.3 million publications (4%) are not included in the Open Edition because of missing author affiliations in OpenAlex, showing that missing affiliation data is a weakness of OpenAlex.

    We now provide a more detailed analysis for the 6.8 million publications that are included in both the traditional Leiden Ranking and the Open Edition. For each of the 1411 universities in the Leiden Ranking 2023, we calculated the percentage of the publications of the university in the traditional Leiden Ranking that are not assigned to the university in the Open Edition. Figure 2 shows this percentage for each university, sorted from the highest to the lowest percentage.

    Figure 2. Percentage of publications of a university in the traditional Leiden Ranking that are not assigned to the university in the Open Edition. Each dot represents one university.


    Figure 2 shows there are three universities for which more than 30% of the publications in the traditional Leiden Ranking are not assigned to the university in the Open Edition. In two cases this appears to be due to errors in the traditional Leiden Ranking, while in one case this seems to be due to errors in the Open Edition. There are 88 universities for which between 10% and 30% of the publications in the traditional Leiden Ranking are not assigned to the university in the Open Edition. For the other 1320 universities this is the case for less than 10% of the publications in the traditional Leiden Ranking.

    We manually examined a random sample of 25 publications assigned to a university in the traditional Leiden Ranking but not in the Open Edition. For this small sample, we found that in 6 cases (24%) the assignment in the traditional Leiden Ranking was incorrect (because of an error made by either Web of Science or CWTS). In the other 19 cases (76%), an assignment incorrectly had not been made in the Open Edition (in most cases because of either a missing author affiliation in OpenAlex or an error in the mapping performed by OpenAlex from an affiliation string to a ROR ID).

    Figure 3 offers the opposite perspective of Figure 2. For each of the 1411 universities, we calculated the percentage of the publications of the university in the Leiden Ranking Open Edition that are not assigned to the university in the traditional Leiden Ranking. These percentages are shown in Figure 3, again sorted from highest to lowest.

    Figure 3. Percentage of publications of a university in the Open Edition that are not assigned to the university in the traditional Leiden Ranking.


    As Figure 3 shows, there are 14 universities for which more than 30% of the publications in the Open Edition are not assigned to the university in the traditional Leiden Ranking. In about two-thirds of the cases this appears to be due to errors in the Open Edition, while in the other cases this seems to be due to errors in the traditional Leiden Ranking. There are 91 universities for which between 10% and 30% of the publications in the Open Edition are not assigned to the university in the traditional Leiden Ranking. For the other 1306 universities this is the case for less than 10% of the publications in the Open Edition.

    In a manual analysis of a random sample of 25 publications assigned to a university in the Open Edition but not in the traditional Leiden Ranking, we found that in 19 cases (76%) the assignment in the Open Edition was incorrect (in most cases because of an error in the mapping performed by OpenAlex from an affiliation string to a ROR ID). In the other 6 cases (24%), an assignment incorrectly had not been made in the traditional Leiden Ranking (for a variety of reasons).

    In summary, for publications included in both the traditional Leiden Ranking and the Open Edition, our findings show that for most universities the data curation yields similar results in the two editions of the ranking. When there are differences, errors are about three times more likely in the Open Edition than in the traditional Leiden Ranking.

    Room for improvement

    The bibliometric community has extensive experience with the centralized and closed model for data curation. Over the years, databases such as Web of Science, Scopus, and Dimensions have made considerable investments in this model. Research organizations have also made large investments in it, both by paying to get access to the above-mentioned databases and by helping these databases improve their data (e.g., by reporting data quality problems, such as publications that are assigned to an incorrect organization). Likewise, by performing extensive curation of affiliation data for the traditional Leiden Ranking based on Web of Science data, CWTS has also invested substantially in a mostly centralized approach to data curation.

    The bibliometric community has less experience with the decentralized and open model for data curation. Nevertheless, the results presented above show that the quality of affiliation data obtained through a more decentralized approach is already quite good. Moreover, there are lots of opportunities to further improve the data quality. Different actors can contribute to this in different ways:

    • OpenAlex can contribute by making further improvements to the completeness of its affiliation data and to the machine learning algorithm it uses to map affiliation strings to ROR IDs.
    • Research organizations can contribute by reporting data quality problems to OpenAlex. This will help OpenAlex to improve the quality of its data. Because OpenAlex data is open, anyone can identify problems in the data. This is different for closed databases, where only those who pay to get access to a database can identify problems.
    • Publishers can contribute by attaching ROR IDs to author affiliations in publications and by depositing not only affiliation strings but also ROR IDs to Crossref. Several publishers, for instance Optica Publishing Group and eLife, have already started to do this. This enables OpenAlex to ingest ROR IDs from Crossref instead of inferring these IDs algorithmically.
    • CWTS and other providers of bibliometric analytics can contribute by monitoring the quality of the affiliation data obtained from OpenAlex and by providing feedback to OpenAlex. If necessary, providers of bibliometric analytics can perform their own curation of affiliation data as a complement or substitute to the data curation performed by OpenAlex.
    • All actors in the system can contribute by working together with ROR to make improvements to the registry. In particular, research organizations can make an essential contribution by providing authoritative curations on the relationships between institutions and their constituent parts.

    The power of the decentralized and open model

    We seem to have reached the limits of what can be achieved using the centralized and closed model for curating affiliation data. While for certain use cases the model may yield an acceptable data quality, the model is also highly resource-demanding, non-transparent, and inflexible.

    Although the decentralized and open model is still in an early stage of development, it already yields a surprisingly good data quality. Moreover, by distributing the responsibility for different parts of the data curation process to different actors in the system, the model is more efficient and scalable than the centralized and closed model. On top of this, the decentralized and open model facilitates transparency and accountability, and offers the flexibility needed to address different use cases that require different choices to be made in the data curation process. Finally, the decentralized and open model ensures that investments in data curation benefit the global academic community instead of increasing the value of proprietary data sources.

    By opening up the Leiden Ranking, we are moving toward a powerful new model for curating affiliation data. We invite universities to critically examine the affiliation data used in the Leiden Ranking Open Edition. Feedback from universities will help to further develop the decentralized and open model for data curation and to realize the highest possible data quality.

    We thank colleagues at the Curtin Open Knowledge Initiative (COKI), Sesame Open Science, OurResearch, SIRIS Academic, and Sorbonne University for valuable feedback on a draft version of this blog post.


    Header image: Henry Dixon on Unsplash

    ]]>
    Nees Jan van Eckhttps://orcid.org/0000-0001-8448-4521Martijn VisserLudo Waltman
    An open approach for classifying research publicationshttps://www.leidenmadtrics.nl/articles/an-open-approach-for-classifying-research-publications2024-01-24T16:00:00+01:002024-05-16T23:20:47+02:00In this post Nees Jan van Eck and Ludo Waltman introduce an open approach for classifying research publications, contributing to a broader development toward open approaches to bibliometrics.Classifying research publications into research topics or research areas is crucial for many bibliometric analyses. While there are lots of approaches for classifying publications, most of these approaches lack transparency. Although there are exceptions (see here and here), these approaches are typically based on data from proprietary sources or they rely on non-transparent algorithms.

    We introduce an open approach to the algorithmic classification of research publications. This approach builds on a methodology we developed more than a decade ago. While this methodology was originally applied to closed data from proprietary sources, we now apply it to open data from OpenAlex. We make available a fully open classification of publications. The research areas in this classification are labeled using a new labeling approach, and the classification is presented visually using the VOSviewer Online software. We also release open source software that enables anyone to reproduce and extend our work.

    Building the classification

    We built our classification based on OpenAlex data, using the snapshot released on November 21, 2023. Over the past years, our methodology has been used to create classifications based on Web of Science and Scopus data. These classifications are available in InCites and SciVal, respectively. Compared to Web of Science and Scopus, OpenAlex has the benefit that its data is fully open and that it offers a broader coverage of the scholarly literature.

    To build our classification, we used the so-called extended direct citation approach in combination with the Leiden algorithm. The source code of the software we used is available here. Our classification covers the 71 million journal articles, proceedings papers, preprints, and book chapters in OpenAlex that were published between 2000 and 2023 and that are connected to each other by citation links. Based on 1715 million citation links, we built a three-level hierarchical classification. Each publication was assigned to a research area at each of the three levels of the classification. Research areas consist of publications that are relatively strongly connected by citation links and that can therefore be expected to be topically related. At each level of the classification, a publication was assigned to only one research area, which means research areas do not overlap.

    Using the parameter values reported in Table 1, we obtained a classification that consists of 4521 research areas at the lowest (most granular) level, 917 research areas at the middle level, and 20 research areas at the highest (least granular) level. We also algorithmically linked each research area in our classification to one or more of the following five broad main fields: biomedical and health sciences, life and earth sciences, mathematics and computer science, physical sciences and engineering, and social sciences and humanities.

    ParameterValue
    resolution_micro_level2.2e-6
    resolution_meso_level4.9e-7
    resolution_macro_level2.2e-8
    threshold_micro_level1,000
    threshold_meso_level10,000
    threshold_macro_level500,000
    n_iterations100

    Table 1. Parameter values used to build the classification.

    Given the huge size of the citation network based on which we built the classification, the process of building the classification was computationally demanding. We used a computer with 200 GB internal memory. The process took about 70 hours on this computer.

    Labeling the research areas in an algorithmically built publication classification is a challenging problem. The labeling approach introduced in our original methodology yields a list of five characteristic terms for each research area. While these terms usually give a reasonably good impression of the topics covered by a research area, our experience is that users often want to have a single term that summarizes what a research area is about.

    Large language models (LLMs) offer important new opportunities to label research areas. We therefore used the Updated GPT 3.5 Turbo LLM, developed by OpenAI, to label the 4521 research areas at the lowest level in our classification. The source code of our software can be found here.

    For each research area, we provided the LLM with the titles of the 250 most cited publications in the area, along with the prompt shown in Box 1. Using this prompt, we asked the LLM to return a label for each research area, both a short one (max. three words) and a longer one (max. eight words). We also requested the LLM to provide a few sentences that summarize what the research area is about.

    You will be provided with the titles of a representative sample of papers from a larger cluster of related scientific papers.

    Your task is to identify the topic of the entire cluster based on the titles of the representative papers.

    Output the following items (in English) that describe the topic of the cluster: 'short label' (at most 3 words and format in Title Case), 'long label' (at most 8 words and format in Title Case), list of 10 'keywords' (ordered by relevance and format in Title Case), 'summary' (few sentences), and 'wikipedia page' (URL).
    Do not start short and long labels with the word "The".
    Start each summary with "This cluster of papers".
    Format the output in JSON.

    Box 1. Prompt provided to the LLM.

    Table 2 presents the results provided by the LLM for one of the 4521 research areas. The results show that this research area is about bibliometrics. Although we did not perform a systematic evaluation of the quality of the LLM results, our impression is that the results are a substantial improvement over the results obtained using our original methodology, or variants of that methodology. We also tried to use the LLM to label the research areas at the middle level and the highest level in our classification, but this did not yield satisfactory results.

    Short labelBibliometric Analysis
    Long labelBibliometric Analysis and Research Evaluation
    KeywordsBibliometric Analysis; Research Evaluation; Scientific Impact; Citation Networks; Collaboration Patterns; Open Access Publishing; Social Impact Assessment; Altmetrics; Co-authorship Networks; Interdisciplinary Research
    SummaryThis cluster of papers focuses on bibliometric analysis, research evaluation, and the assessment of scientific impact. It covers topics such as citation networks, collaboration patterns, open access publishing, social impact assessment, altmetrics, co-authorship networks, and interdisciplinary research
    Wikipediahttps://en.wikipedia.org/wiki/Bibliometrics

    Table 2. Output provided by the LLM for a selected research area.

    While the LLM results are promising, we stress that the use of LLMs such as GPT 3.5 raises complex legal and ethical questions that require further consideration. Also, the use of GPT 3.5 requires a payment. We paid slightly less than USD 50 to label 4521 research areas. We also considered the use of GPT 4, but this LLM is more expensive and did not seem to yield better results.

    Visualizing the classification

    A powerful way to use our publication classification is to create interactive landscapes of science. Figure 1 presents an example of such a landscape. It was created using the VOSviewer Online software. We used the software to visualize the 4521 research areas at the lowest level in our classification. Each bubble represents a research area. The larger the bubble, the larger the number of publications in the research area. The distance between bubbles approximately indicates the relatedness of research areas in terms of citation links. In general, the smaller the distance between two bubbles, the stronger the citation links between the two research areas. The color of a bubble shows the primary main field to which a research area belongs. For instance, research areas in the physical sciences and engineering (blue) are located on the left side of the landscape, while research areas in the social sciences and humanities (red) are located on the right side. Finally, for some bubbles, the landscape also shows the label obtained using our LLM-based labeling approach.

    Figure 1. Landscape of science showing the 4521 research areas at the lowest level in the classification. Colors show the primary main field to which a research area belongs. (interactive version)

    The landscape of science presented in Figure 1 can be explored in more detail in this interactive webtool. The webtool enables zooming in on specific parts of the landscape. It is also possible to see the list of publications included in each research area.

    To illustrate the power of landscapes of science, we use our landscape to show the publication activity of our own institution, Leiden University. The landscape presented in Figure 2 is identical to the one in Figure 1, except that the color of a bubble now indicates the proportion of publications in a research area with authors affiliated with Leiden University. Purple bubbles represent research areas in which Leiden University has a strong publication activity. For each research area, the list of publications authored by Leiden University can be explored in our interactive webtool. The webtool for instance reveals that Leiden University has 570 publications in the period 2000-2023 in the research area labeled ‘Bibliometric Analysis’. This is one of the research areas in the social sciences and humanities in which Leiden University has its strongest publication activity.

    Figure 2. Landscape of science showing the 4521 research areas at the lowest level in the classification. Colors show the proportion of publications in a research area with authors from Leiden University. (interactive version)

    Opening up bibliometrics

    We have introduced an open approach for classifying research publications into research areas: Our approach relies on open data from OpenAlex, our software is open source, and our publication classification is openly available. The work presented in this blog post is part of an ambitious agenda we have at CWTS to move to fully open approaches to bibliometrics, and to openness of research information and research analytics more generally.

    The publication classification discussed in this blog post is a crucial building block for the Open Edition of the Leiden Ranking that CWTS is going to release on January 30. The classification is also used by the OpenAlex team as a foundation for a new topic classification for OpenAlex. We hope our work will help to advance the transition to open approaches to bibliometrics!

    ]]>
    Nees Jan van Eckhttps://orcid.org/0000-0001-8448-4521Ludo Waltman
    Toward open research information - Introducing the Information & Openness focal area at CWTShttps://www.leidenmadtrics.nl/articles/toward-open-research-information-introducing-the-information-openness-focal-area-at-cwts2024-01-18T10:30:00+01:002024-05-16T23:20:47+02:00The Information & Openness focal area at CWTS studies and promotes openness of research information. In this blog post, we present our agenda for the coming five years.How to find the most relevant scientific literature on topic X? How to evaluate the research carried out by department Y? And how to establish new strategic priorities for university Z? These are just a few examples of the many important decisions that researchers, research evaluators, and science policy makers need to make on a daily basis. Decisions like these are increasingly made in data-driven ways, guided by research analytics ranging from simple scientometric indicators and university rankings to complex dashboards that bring together data from a variety of sources.

    The Information & Openness focal area

    Last year the Information & Openness focal area was established at CWTS. In this focal area we are concerned with the complex interplay between decision making processes in science, the information used in these processes, and the nature of this information in terms of properties such as openness, transparency, inclusiveness, and ownership. This complex interplay is subject to ongoing disruption from two movements with global aspirations: open science and responsible research assessment. Our work in the focal area builds on decades of experience we have at CWTS in using scientometric data to support research assessment and strategic decision making in science. Having been at the forefront of developments in scientometrics, we not only have a lot of knowledge about scientometric data sources, indicators, and algorithms, but we also have a deep understanding of the role scientometrics plays in all kinds of decision-making processes.

    Building on our experience and recognizing that decisions in science are increasingly being made in data-driven ways, the Information & Openness focal area aims to study and promote responsible approaches to the use of data in decision making processes in science. We are interested in the properties of the data sources that are being used and how these properties contribute to, or impede, responsible ways of decision making. The field of scientometrics has a long tradition of working with proprietary data sources, especially Web of Science and Scopus. However, the closed nature of these data sources is increasingly seen as an obstacle to transparent and responsible decision making, for instance in the context of research assessment. In the Information & Openness focal area we are therefore particularly interested in studying and promoting openness of scientometric data, and of research information more generally.

    Three pillars

    In line with the organization of the broader knowledge agenda of CWTS, our work in the Information & Openness focal area is organized in three pillars: understanding, intervening, and practicing. In the box below we outline our plans for each of these pillars.

    Understanding

    In the understanding pillar we perform research projects with the broad goal of developing a comprehensive and critical understanding of the open research information landscape. Based on our scientometric expertise, some projects in this pillar may focus on systematically monitoring and tracking the availability of open research information. Drawing on our expertise in sociology, anthropology, and science and technology studies, other projects may be aimed at describing and explaining what shapes, enables, and constrains the spread, or non-spread, of open information practices.

    Intervening

    In the intervening pillar we take concrete actions to advance openness of research information, aiming to make openness of research information the norm and to enable more transparent and responsible approaches to decision making in science. An example is the transformation of the CWTS Leiden Ranking to a tool that is entirely based on open data, resulting in a fully transparent and reproducible ranking. The first release of the Open Edition of the Leiden Ranking will take place later this month, on January 30. Another example is the launch of the courseScientometrics Using Open Data, in close collaboration with colleagues at the Curtin Open Knowledge Initiative (COKI). The first edition of this course took place in November last year, and a next edition will be organized in March this year. Other actions to advance openness of research information are currently in preparation. We expect to share some announcements in the coming months.

    Practicing

    Following the idea of ‘practice what we preach’, the practicing pillar focuses on implementing openness of research information in our own way of working at CWTS. Within the next few years, we want our work at CWTS (including CWTS BV) to be fully based on open research information. In particular, our aim is that future scientometric analyses performed by our center will use only data from open sources, such as Crossref, DataCite, ORCID, OpenAlex, OpenCitations, OpenAIRE, and others. This is part of a broader ambition to open up the work we do at CWTS, for instance in the way we communicate about our research and about other activities of our center. This will also include a revision and expansion of our policies for open science and research data management.

    Our way of working

    The team of the Information & Openness focal area consists of more than 20 CWTS colleagues. Some of us are focused primarily on activities in the understanding pillar. Others are more focused on the intervening or practicing pillars. We meet once every two weeks to discuss the latest developments around open research information, to share updates on ongoing projects and other activities, and to make plans for new initiatives.

    Our work also aims to contribute to strengthening the other two focal areas of CWTS: Engagement & Inclusion and Evaluation & Culture. Through the UNESCO Lab on Diversity and Inclusion in Global Science we for instance connect some of the work we do in the Information & Openness and Engagement & Inclusion focal areas. Likewise, our work in the GraspOS project and the CoARA working group on Open Infrastructures for Responsible Research Assessment (OI4RRA) demonstrates the value of cross fertilization between the Information & Openness and Evaluation & Culture focal areas.

    We are also setting up collaborations with external partners working on open research information. Many organizations are doing crucial work in this area. This ranges from research groups that study openness of research information to organizations that provide infrastructures for open research information and organizations that put the use of open research information into practice (e.g., CNRS, COKI, the French Ministry of Higher Education and Research, the Dutch Research Council (NWO), SURF, and Sorbonne University).

    Are you interested in exploring opportunities for working together? Don’t hesitate to reach out to one of the coordinators of our Information & Openness focal area: Zeynep AnliClara Calero-MedinaNees Jan van Eck, and Ludo Waltman.

    Current members of the focal area: Zeynep Anli, Juan Bascur Cifuentes, Clara Calero-Medina, Carey Chen, Rodrigo Costas Comesana, Dan Gibson, Margaret Gold, Kathleen Gregory, Myroslava Hladchenko, Andrew Hoffman, Kwun Hang Lai, Marc Luwel, Mark Neijssel, Ana Parrón Cabañero, Alex Rushforth, Clifford Tatum, Bram van den Boomen, Nees Jan van Eck, Jeroen van Honk, Thed van Leeuwen, Martijn Visser, Ludo Waltman, Alfredo Yegros, Qianqian Xie ]]>
    Understanding Misinformation and Science in Societal Debateshttps://www.leidenmadtrics.nl/articles/understanding-misinformation-and-science-in-societal-debates2024-01-16T15:00:00+01:002024-05-16T23:20:47+02:00In a new research project, we explore the interaction between misinformation and science on social media during COVID-19. This is part of the new research line on the role of science in societal debates of our Focal Area Engagement & Inclusion.The past years have shown that science can play an important role in societal debates. Science was clearly pivotal in the development of COVID-19 vaccines. In addition, many of the interventions and policies, such as masking, school closures or even curfews, were presented as evidence-based solutions, motivated by scientific advances in our understanding of the virus. In return, these policies and scientific findings were part of broader societal debates, with sometimes vocal proponents and opponents in contentious and sometimes polarised settings. Although very visible during the COVID-19 pandemic, science also plays a large role in other societal debates, such as the nitrogen debate in the Netherlands, or climate change.

    As a part of our Focal Area of Engagement & Inclusion at CWTS, we explore the role of science in societal debates. We know that science does not offer unequivocal facts for societal debates or clear course of action for policy. Some of the questions that guide our research line include: in societal debates, are different “sides” informed by different literatures, perhaps reinforcing their own convictions? Or do different sides share a common evidence base from science? Does new scientific information lead to a convergence or to a divergence of opinions? Does the open availability of scientific literature shape the role of science in societal debates? Do scientists and societal actors interpret scientific results differently? How are these interpretations used in arguments? How do scientists themselves engage in such societal debates?

    In addition to science, misinformation also plays a large role in societal debates. During COVID-19, this prompted the World Health Organisation (WHO) to speak of an infodemic. Some of the misinformation might be countered, for example, by fact-checkers, such as maldita.es in Spain, or the local “Nieuwscheckers” here at Leiden University. There are also campaigns to raise awareness by the public, such as “Ask for Evidence” or “Stop, Think, Check”, to help prevent the spread of misinformation. But how does science interact with misinformation?

    Science and misinformation

    We are excited to start a new project on Understanding Misinformation and Science in Societal Debates (UnMiSSeD). In this project, we will study the interaction between misinformation and science during the COVID-19 pandemic using both quantitative and qualitative approaches. Our quantitative analyses will be limited to Twitter (now X), based on more than a billion tweets posted during the COVID-19 pandemic, combined with information on millions of publications and tweets about them. We will go beyond Twitter in our qualitative analyses to explore how discussions permeate the porous boundaries of social media. We will collaborate with Fondazione Bruno Kessler (FBK), lead by Riccardo Gallotti and University of Geneva, lead by Tommaso Venturini. We are happy that this project is supported by the European Media and Information Fund.

    New perspective

    At CWTS, we already have previous experience with studying connections between science and society, also in the context of COVID-19. We also studied how COVID-19 appeared in a media outlet. Much of our knowledge on science in social media is based on data from Altmetric and provides a good lens on which aspects of academic publications relate to being mentioned on (social) media. Previous projects at CWTS departed from science and explored where science was mentioned, referenced and taken up. However, this approach misses the broader contexts in which science is mentioned. Societal debates are multifaceted processes where scientific mentions are couched in and interact with other ways of knowing the world. In the UnMiSSeD project, our starting point are societal debates themselves. We explore when and how science becomes part of such debates, also in relation to misinformation and claims unrelated to science. In this way, we hope to better understand the role of science and misinformation in societal debates.

    This project brings together a novel combination of scientific fields at CWTS. Traditionally, our centre is more focused on science (and technology) studies. The UnMiSSeD project brings in not only computational social sciences but also media and communication studies and has clear connections to science communication. We hope to build out these connections in the near future. Watch this blog for future updates on our project. We are open to explore new opportunities, and if you want to connect to us on this topic, please do reach out!

    The sole responsibility for any content supported by the European Media and Information Fund lies with the author(s) and it may not necessarily reflect the positions of the EMIF and the Fund Partners, the Calouste Gulbenkian Foundation and the European University Institute.

    ]]>
    Vincent TraagJudit VargaRodrigo Costashttps://orcid.org/0000-0002-7465-6462Carole de BordesTim Willemse
    New Horizons: A reflection on the Scientometrics Summer School and the STI 2023 Conferencehttps://www.leidenmadtrics.nl/articles/exploring-new-horizons-in-scientometrics-a-reflection-on-the-scientometrics-summer-school-and-sti-2023-conference2023-12-21T15:30:00+01:002024-05-16T23:20:47+02:00In September 2023, the city of Leiden in the Netherlands was the venue for not just one, but two scientometrics-related events: the CWTS Scientometrics Summer School and the STI 2023 conference. Our author attended both and reflects on his experience.Greetings from Peru, nestled in the heart of the Andes, where I find myself reflecting on two transformative events in my scientific journey: the CWTS Scientometrics Summer School (CS3) and the 27th International Conference on Science, Technology, and Innovation Indicators (STI 2023). As a bibliometrics enthusiast for the past two decades, this experience has been nothing short of a revelation—a journey that prompted me to question the very fabric of scientific evaluation and metrics.

    Two decades ago, my foray into bibliometrics was marked by conventional survey field research. Fast forward ten years, and I realized the untapped potential of bibliometrics in advancing Library and Information Science (LIS). My maiden bibliometric study delved into the controversial realm of the h-index, assessing its utility in gauging the scientific output of Peruvian researchers. The journey took a pivotal turn in 2015 when I attended the “Measuring Science and Research Performance” course at CWTS in Leiden, a week that unraveled the limitations and detrimental consequences associated with relying on the h-index for critical decisions like research grants or promotions.

    Why the focus on the h-index? Because, like the widely contested journal impact factor, it stands as one of the most popular yet frequently misused bibliometric indicators. Over almost a decade of dedicated bibliometric studies, I couldn't ignore the grim reality in many South American countries—bibliometric reports often perpetuate the status quo, hindering scientific progress. Indicators, meant to guide and inform, had become perverse incentives. Researchers, chasing elusive citations, prioritized studies that fit into pre-existing frameworks rather than addressing pressing regional and local needs.

    Even workshops advocating for open science, while championing transparency and accessibility, often fell short. Discussions on alternative indicators typically revolve around metrics tied to downloads or citations from open information sources. While open-access publishing dominates the discourse on open science practices, few consider the potential of data sharing and code transparency: for example, sharing bibliographic datasets or the R/Stata codes essential for transparent data analysis.

    Day 2 vevrvolg 11
    The author presenting at the STI 2023 conference.

    Eight years after my inaugural visit to Leiden, I had the privilege of returning to participate in the CS3 and the STI 2023. These events were crucibles of intellectual exchange, where I encountered a wealth of perspectives that ignited new possibilities for my own research journey. The incorporation of insights from the sociology of science and science and technology studies (STS) offered a refreshing lens, challenging us to move beyond mere numbers and delve into the social and cultural contexts that shape scientific knowledge production. Exploring diverse information sources, beyond the confines of established databases, promised a more nuanced understanding of scientific impact, particularly in regions often marginalized by traditional bibliometric approaches.

    But most importantly, the shared experiences and diverse perspectives of colleagues from across the globe truly resonated. The STI 2023 conference brought together Global North and South voices, bridging the gap between established research powerhouses and emerging scientific ecosystems. Through open dialogue and critical reflection, we began to dismantle the monolithic assumptions that often underpin bibliometric analysis. We acknowledged the distinct dynamics of scientific production in different regions and the varying priorities and challenges faced by researchers in high-income and low-middle-income countries.

    This newfound awareness, I believe, is the key to unlocking the true potential of bibliometrics. By embracing diversity, incorporating critical perspectives, and forging connections across borders, we can transform this field from a passive observer into an active agent for positive change. We can use bibliometrics not to reinforce existing inequalities but to guide us toward a more inclusive and equitable scientific landscape, one where research serves the needs of all, regardless of their geographic location or economic standing.

    In bidding farewell to the Scientometrics Summer School and the STI 2023 Conference, I can't help but see it as not just an end but a promising new beginning. Armed with enriched perspectives, I embark on the next chapter of my bibliometric journey, eager to implement the lessons learned in contributing to a more equitable and impactful scientific landscape.


    Header and in-text image: Henri de Winter/CWTS

    ]]>
    Carlos Manuel Vilchez Román
    Preprinting and open peer review at the STI 2023 conference: Evaluation of an open science experimenthttps://www.leidenmadtrics.nl/articles/preprinting-and-open-peer-review-at-the-sti-2023-conference-evaluation-of-an-open-science-experiment2023-12-18T10:30:00+01:002024-05-16T23:20:47+02:00At the STI 2023 conference, an experiment was performed with a more open approach to publication and peer review of conference submissions. In this post, the conference organisers present an evaluation of this experiment.Open science was one of the key topics at the Science, Technology and Innovation Indicators (STI) conference that CWTS organised in September 2023 in Leiden, the Netherlands. Open science was not only discussed at the conference but was also put into practice in the publication and peer review process of the conference. By way of experiment, all papers submitted to the conference were published as a preprint before they were peer reviewed. Moreover, the peer review process was open: Review reports were published alongside the preprinted papers, and some reviewers also chose to sign their reports.

    What did we learn from this experiment? To evaluate the experiment, we invited all 186 authors of conference submissions to complete a brief anonymous survey (survey form; survey responses). Survey invitations were sent after the conference. We received 93 responses, corresponding to a response rate of 50%. Below we discuss the outcomes of the survey.

    Preprinting

    We first asked survey respondents to share their opinion about preprinting of conference submissions. Preprinting of conference submissions is strongly supported. 51% of the respondents selected the highest score (5), indicating they "like it a lot", and an additional 37% of the respondents selected the second-highest score (4). Only a small minority of 6% of the respondents do not support preprinting and selected the lowest (1; "I don't like it at all") or second-lowest (2) score.


    When asked what they see as advantages and disadvantages of preprinting of conference submissions, respondents indicated they appreciate the early access and visibility of research through preprinting. The ability to receive feedback and engage with peers is also seen as an advantage. In addition, preprinting enables researchers to establish priority on emerging topics. However, concerns revolve around the quality assurance of preprints, with worries that some submissions represent ongoing work that still needs further development, in which case preprinting may undermine the credibility of the research. There is also a risk that early-career researchers may feel pressured by the open nature of preprints.

    Open peer review

    Support for open peer review is almost as strong as support for preprinting. 73% of the survey respondents expressed support for open peer review (score of 4 or 5). Only 14% of the respondents were opposed to open peer review (score of 1 or 2).


    Respondents recognized several advantages of open peer review, including enhanced transparency, constructive feedback, and accountability of reviewers. However, respondents expressed concerns about variations in review quality and about the potential impact of negative reviews, especially on early-career researchers. Some respondents indicated a preference for fully anonymous peer review, to make sure author identities do not influence reviewers.

    Future editions of the STI conference

    Survey respondents are very positive about the idea of adopting preprinting and open peer review at future editions of the STI conference. 76% of the respondents are in favor of this idea (score of 4 or 5), while only 7% oppose the idea (score of 1 or 2).


    Respondents also offered suggestions for improvement. They would value more thorough reviews, increased transparency in the decision-making process, and well-defined evaluation criteria. Some respondents recommended improving the selection and assignment of reviewers. Several respondents felt there is a need to have a more user-friendly platform for publishing and reviewing conference submissions.

    Strengths and weaknesses of the Orvium platform

    The opinions of survey respondents about the Orvium platform, which was used to publish and review conference submissions, are a bit more mixed. When asked about their satisfaction with the platform, 66% of the respondents gave a positive response (score 4 or 5). Only 8% gave a negative response (score 1 or 2), but there is also a significant share of the respondents (25%) that gave a neutral response (score of 3).


    Respondents mentioned several strengths of the Orvium platform, including the platform's ability to issue DOIs, support for having multiple versions of a paper, and the generation of ‘previews’ of papers for convenient reading in a web browser. However, a number of weaknesses were also mentioned. While some respondents considered the platform easy to use, others found that navigation was challenging and the interface confusing. Respondents also reported problems with the platform's search function.

    Impact of the STI 2023 conference on open science perspectives

    We also asked survey respondents whether the STI 2023 conference changed their ideas about open science. Most respondents reported that their views on open science remained largely unchanged, as they were already supportive of open science. However, a significant share of the respondents found that the conference reinforced their positive views of open science. These respondents for instance mentioned that they appreciate the practical implementation of open science at the conference. At the same time, some respondents reported that the conference made them more aware of potential drawbacks of open science, such as information overload and problems in quality assurance processes.

    Conclusion

    Based on the outcomes of the survey, we consider the experiment with preprinting and open peer review at the STI 2023 conference to be successful. While some survey respondents are critical, a large majority of the respondents are positive about the experiment. Moreover, over three-quarters of the respondents recommend that future editions of the STI conference adopt preprinting and open peer review. The feedback provided by respondents offers excellent guidance for making further improvements to publication and peer review processes at the STI conference, hopefully enabling the full potential of open science to be realized.

    We dedicate this blog post to Leo Waaijers. Leo was a passionate open science activist and a driving force behind the experiment discussed in this post. He passed away in August 2023, while the preparations for the STI 2023 conference were ongoing.

    ]]>
    Ludo WaltmanBiegzat MulatiRong NiJian WangKwun Hang (Adrian) LaiMarc LuwelEd NoyonsThed van LeeuwenVerena Weimer
    CWTS at EASST-4S in Amsterdamhttps://www.leidenmadtrics.nl/articles/cwts-at-easst-4s-in-amsterdamamsterdam2023-12-14T15:37:00+01:002024-05-16T23:20:47+02:00The next EASST-4S conference will take place in Amsterdam in July 2024. CWTS colleagues are involved in 9 open panels, showing the diversity of topics studied at CWTS. In this blogpost, they give an overview of the different panels and the topics that will be addressed.Every four years the European Association for the Study of Science and Technology (EASST) and the Society for Social Studies of Science (4S) join forces to organize the largest conference in the field of Science and Technology Studies (STS) in the world. From 16 to 19 July, 2024 the conference is hosted by the Athena Institute in Amsterdam. The call for abstracts was recently launched with an impressive list of 397 open panels proposed by STS scholars from across the globe. There is an enormous diversity of topics that are being addressed in the open panels and it promises to be an exciting conference!

    CWTS is among the larger centres in the field of STS in the Netherlands and we are proud to have CWTS colleagues involved in 9 panels. These panels show not only the diversity of topics in STS but also the diversity of approaches and topics studied at CWTS. Below we present the different panels we are involved in. We hope to receive your abstract submissions and/or see you in the audience in July!

    Panel number 009, called Marine Transformations: Exploring the technoscience behind our changing relationship with the seas is organized by Jackie Ashkin in collaboration with Sebastian Ureta (Universidad Católica de Chile), Elis Jones (University of Exeter), and Jose A. Cañada (University of Helsinki). This panel begins from the observation that the world’s oceans are in peril. Human actions both threaten and promise to save the ocean, but how do technoscientific enterprises contribute to transforming human-ocean relations? We invite contributions which explore the more-than-human, technoscientific and ethicopolitical dimensions of knowing and relating to the ocean.

    Panel number 071, simply entitled Seabirds is organized by Mayline Strouk (STIS, University of Edinburgh and CWTS) with Bronte Evans Rayward (SPRI, University of Cambridge) and Oscar Hartman Davies (University of Oxford). The Open Panel aims to gather case studies and discussions on seabirds to engage with contemporary urgent matters such as environmental change and the Anthropocene. We seek to engage with STS topics such as technological developments, multispecies and more-than-human studies, and space and its materialities. We welcome contributions focused on seabirds or where seabirds play an intriguing role in addressing socio-technical matters. What can seabirds teach us?

    Panel number 074 explores The limits of Open Research: critical views and new perspectives and is organized by Ismael Rafols and Louise Bezuidenhout. This open panel critically examines the Open Science (OS) movement and the enactment of its core values of equity, fairness, and inclusiveness. As the OS infrastructural landscape evolves, there is an underlying assumption that these values will support the evolution of an equitable digital commons and, in consequence, equitable science. Nonetheless, simply assuming that these values are embedded in infrastructural design can be viewed as problematic. These open panels will critically engage with the dissonance between OS expectations and current enactment, raising questions relating to limits of openness, meaningful connectivity and digital democratisation.

    Panel number 145, Scientific cultures in conflict and transition: Studying reform in action, addresses the recent proliferation of science reform movements, including open science, meta-science, responsible research and innovation, responsible metrics, and research ssessment reform. These ‘upstream’ reform movements seek to address what campaigners consider declining standards of quality or propriety around academic knowledge production, communication and evaluation within their own professional world. This open panel is co-convened by our CWTS colleague Alex Rushforth, together with Bart Penders (Maastricht University/Aachen University), and Nicole Nelson (University of Wisconsin Madison). They invite case study contributions on one or more scientific reform movement(s) which advocate a specific view on the right way to conduct scientific practice(s).

    Panel number 154, entitled Making and Doing Oceanic Futures: Mobilising the ocean and its materialities between hope and loss is organized by Francesco Colona, Sarah Rose Bieszczad and Judit Varga. The Panel explores the ocean as an object of study and concern in various knowledge and artistic practices. It queries how oceanic futures are entangled with hope and loss and how these futures intersect with socio-political, scientific, economic, industrial, and ecological processes. This panel welcomes traditional presentations and artistic contributions (e.g. performances, films, or spoken words), and invites interventions about the ocean as an object of study and an object of concern.

    Panel number 299 aims to bring together studies of new notions of research quality. Various reform movements and science policy interventions have been adding new elements to conceptions of quality in research-performing organisations. Co-convened by Marta Sienkiewicz, Tjitske Holtrop and Thed van Leeuwen from CWTS, the panel invites contributions bringing an STS lens to the study of new quality notions, the reform movements that support them and the evaluative situations where they count. We seek to generate reflections of theoretical and practical significance for (e)valuation, standardisation and justification of quality in research assessments. The panel will combine academic presentations with an interactive workshop.

    Panel number 328, entitled Excavating fossilized data: Problematizing ties between academic research and polluting industries is organized by Jorrit Smit and Sarah de Rijcke (CWTS) in collaboration with former colleague Guus Dix (UTwente), as well as Shivant Jhagroe and Dominika Czerniawska from other faculties of Leiden University. In this panel, we want to explore experimental ways for STS to engage with the “cut the ties” debate around campuses worldwide. We aim to host a methodologically diverse gathering in which we can collectively ‘excavate’ data and address pivotal political-epistemic effects of ties between extractivist polluting industries and academic research in times of climate crisis.

    Panel 340 develops the notion of More-than human research and Innovation. It is organized by Thomas Franssen (CWTS), Rob Smith (University of Edinburgh) and Michael Bernstein (Austrian Institute of Technology). The panel seeks to bring multispecies studies into onversation with STS focusing especially on the productive unruliness of mutlispecies collaboration. We seek to think about in/exclusion of other-than human stakeholders and the conceptualization and realization of agency in ecological restoration, sustainable agriculture, and other future ecologies, as well as environmental science and governance, for example the instantiation of the “do no significant harm” principle in European research and innovation.

    Panel 397 deals with Responsible innovation in chemistry. It is organized by Laurens Hessels (Rathenau Instituut and CWTS), Lotte Asveld and Britte Bouchaut (TU Delft), and Esther Versluis (Maastricht University). Chemical pollution is a main driver for global biodiversity loss and the emissions of chemical industry contribute substantially to climate change. Regulation often falls short of adequately addressing all negative impacts of novel chemicals. This session calls for papers addressing the opportunities for and barriers to responsible innovation in academic and industrial chemistry. How is knowledge produced and what standards determine the validity of knowledge? How do institutional frameworks impact safety and responsibility allocation in the chemical sector? What is the responsibility of academic researchers collaborating with industry?

    The call for abstract is now open and will close on 12 February 2024. In case you are interested in submitting an abstract but are unsure whether your paper fits the panel, do reach out to the panel organisers. All our panel organisers would be happy to discuss possible contributions.

    This blog was written with contributions from Jackie Ashkin, Louise Bezuidenhout, Sarah Rose Bieszczad, Francesco Colona, Thomas Franssen, Laurens Hessels, Tjitske Holtrop, Thed van Leeuwen, Marta Sienkiewicz, Jorrit Smit, Mayline Strouk, Ismael Rafols, Sarah de Rijcke, Alex Rushforth, and Judit Varga.

    Header image courtesy of https://www.easst4s2024.net.

    ]]>
    Introducing the CWTS Focal Area Engagement and Inclusion: A vision and roadmaphttps://www.leidenmadtrics.nl/articles/introducing-the-cwts-focal-area-engagement-and-inclusion-a-vision-and-roadmap2023-11-23T10:30:00+01:002024-05-16T23:20:47+02:00The new Focal Area Engagement & Inclusion at CWTS aims to create a more diverse, inclusive and engaging science ecosystem. This blogpost introduces our main vision and roadmap for the future. We welcome any person or organisation interested in these topics to reach out to us!To develop our CWTS knowledge agenda we formed three focal areas at the start of this year to organise our activities. Here, we introduce the vision and roadmap of the Focal Area Engagement & Inclusion.

    Our vision

    In today's rapidly changing world, fostering a collaborative, diverse and inclusive science ecosystem that engages with society is of paramount importance. As we navigate complex global challenges such as climate change, pandemics, and artificial intelligence, it becomes evident that diverse perspectives, inclusive participation and public engagement in scientific knowledge creation and communication are key to unlocking science-based solutions for societal challenges. The Focal Area Engagement & Inclusion envisions studying and promoting diversity and inclusivity in the science ecosystem and the engagement and communication between science and society.

    In line with the three pillars of the CWTS knowledge agenda – understanding, intervening and practising – we developed an ambitious agenda for the study and promotion of diversity, inclusion, engagement, communication and science-society interactions. Our work will not only contribute to research and teaching around these questions, but will also support policy developments and interventions, and generate insights into how we can implement our findings at our own centre.

    Representation & Inclusiveness

    We believe diversity and inclusivity in the global science ecosystem is important. By breaking down barriers to participation in science for individuals from a variety of backgrounds, cultures, and experiences, we enrich the pool of knowledge, ideas, and approaches in research, which, in turn, helps to address scientific and societal challenges more effectively. Who gets to participate in science is not always self-evident and requires more fundamental understanding and well-considered interventions to improve the inclusion and representation of all social groups in science, and the science system as a whole.

    Epistemic Diversity

    Epistemic diversity in the science system is of major importance. We need to recognise how different topics, research questions, knowledge systems, and actors, including other-than-human ones, help to produce a fairer and more nuanced understanding of complex global issues. By monitoring and promoting epistemic diversity, we expect to foster a more inclusive and innovative environment where different ways of knowing are valued and incorporated.

    For instance, we want to study and address the lack of coverage in mainstream scientometric databases; a problem that stands in the way of making important societal topics visible in science policy. Consequently, we expect to develop multiversatories, policies, and recommendations to support funders and science policy with reinforcing epistemic diversity.

    Engagement & Communication

    A research system that is disconnected from society is essentially ineffective. Science communication, public engagement with science, and participatory approaches for collaborative knowledge production are integral building blocks for a stronger and more relevant research and innovation ecosystem. Effective science communication and public engagement help to bridge the gap between academia and society; help to make scientific approaches and knowledge more accessible to the wider public and societal stakeholders (e.g. policy makers, industry, etc.); limit the impact of misinformation and the misuse of scientific information; and may help to increase public trust in science. We will study how society engages with science, in order to improve science communication and strengthen the role science can play in society.

    Citizen science and other participatory approaches can create a stronger sense of societal ownership and accountability, turning scientific research into a collective societal endeavour. Societal actors outside academia contribute to the scientific ecosystem in various ways, for instance with local and traditional knowledge or insights from lived experience, or by contributing to evidence-informed policy-making. The engagement of societal actors can also direct the attention of research to issues of societal importance, increasing both their societal relevance and their practical impacts. Engaging other actors, such as industry, policy-makers or non-governmental organisations, can help with more informed policy, decision-making and innovation. We want to study citizen-science practices and how they are changing scientific outcomes, with the aim of helping to shape citizen-science further.

    Accomplishing our ambitions


    Coordination of dreams, people, and projects

    The real treasure trove of the Focal Area Engagement & Inclusion is all the individual members with their own areas of expertise, projects, dreams, and activities. We are a team of more than 30 colleagues from a variety of backgrounds and career stages.

    As a first step, we mapped our research projects, PhD projects, and personal dreams into three sub-areas (which we initially characterised as ambitions!), as well as into the existing contractual (i.e., BV) and institute projects, and the work of the Citizen Science Lab and the UNESCO lab (Figure 1). This mapping formed an excellent means for thinking about our future activities.

    Figure 1. Mapping of our current projects and activities to the three sub-areas (initially labelled as ambitions) - Miro board

    The roadmap

    We have created a working group for each of the three sub-areas to bundle expertise and resources. The working groups will bring together a diverse range of colleagues, from within and outside of CWTS, each contributing with their unique knowledge to tackle the complex challenges of the sub-areas.

    Projects play a pivotal role in our day-to-day work at CWTS. Our Focal Area will help coordinate existing projects, and monitor funding opportunities to set up new projects. Our focused strategy of aligning projects with the goals of the Focal Area will be crucial for achieving our vision and ambitions.

    In addition, engagement and communication activities will be of central importance for the Focal Area. We think of dedicated seminars, special sessions at conferences (e.g. a special session on “Researching (in-) equity, diversity and inclusion in science through bibliometric, mixed- and multi-method studies” organised at the STI 2023 conference), or co-creation workshops with citizens and societal stakeholders. In line with our ideal of practising what we preach, we ourselves will communicate our work and activities to broader audiences through blog posts and social media, and look forward to open and engaging conversations with others on these topics.

    If you are interested in partnering with us on this exciting journey, we invite you to get in touch with the E&I Focal Area coordinators: Carole de Bordes, Rodrigo Costas, Sarah de Rijcke, Tjitske Holtrop and Vincent Traag.


    Current members of the focal area: Adrian Arias Diaz-Faes, Adrian Lai, Alfredo Yegros, Andre Brasil, Andrew Hoffman, Anestis Amanatidis, Anna Parrón, Anouk Spelt, Biegzat Mulati, Carey Chen, Carole de Bordes, Clara Calero Medina, Ed Noijons, Erin Leahey, Gabriel Falcini dos Santos, Huilin Ge, Ingeborg Meijer, Ismael Rafols, Jingwen Zhang, Jonathan Dudek, Jorrit Smit, Juan-Pablo Bascur, Kathleen Gregory, Laurens Hessels, Leyan Wu, Ludo Waltman, Margaret Gold, Marin Visscher, Qianqian Xie, Renate Reitsma, Robert Tijssen, Rodrigo Costas, Sarah de Rijcke, Soohong Eum, Thomas Franssen, Tjitske Holtrop, Vincent Traag, Zohreh Zahedi

    ]]>
    Has Open Access become a 'band-aid' for an historical 'innovation-gone-wrong'?https://www.leidenmadtrics.nl/articles/has-open-access-become-a-band-aid-for-an-historical-innovation-gone-wrong2023-11-16T10:30:00+01:002024-05-16T23:20:47+02:00In this blog post, we examine key historical moments in research assessment, access to, and affordability of published research, to explain why Open Access and its economic models have become an incremental solution to a problem requiring a revolutionary change.Open access: a change in publishing with a limited reach

    Open Access is a movement and policy directive dedicated to reforming the closed or subscription-based gatekeeping of scientific research. In the subscription-based (when readers pay) model scientists communicate the results of their research, by submitting it to publishers, and in many cases to one of a small number of large commercial publishers, considered to be an oligopoly. Publishers 'process' this work, then provide academic institutions (i.e., libraries) with an 'opportunity' to buy back research via journal subscriptions. This is neither sound economically, nor is it conducive to the growth of scientific knowledge. Open Access has therefore become a critically assessed and well-researched subject, focused on alternative approaches to publishing - i.e., green, gold, and hybrid journal publishing, and Article Processing Fees (APCs) paid by institutions or scholars themselves (author pays model). As a global project there is ample evidence that Open Access has a limited reach.

    Journal citation indexing and ranking (Assessment)

    Dr. Eugene Garfield is a renowned figure in certain scientific communities for having founded the Institute for Scientific Information (ISI), and for his innovation in automated journal citation indexing - the first Science Citation Index. Dr. Garfield lived a long and successful life (until the age of 91!); long enough to see his Science Citation Index grow to be one of the most useful reference tools for scholars and scientometricians worldwide. Today, this index has been expanded commercially to include additional products, which are now part of Clarivate's trademarked Web of Science™.

    Dr. Garfield's vision was not only to trace the history of ideas, but develop a tool to assist university/college libraries with their journal selection needs: a one-time legitimate process that had already been on the minds of other scientists. Gross and Gross (1927) are credited by Garfield for being the first to ask: "What files of scientific periodicals are needed in a college library to prepare the student for advanced work... ?". The answer was to "compile a journal list” considered to be "indispensable", and to base this list on an "arbitrary standard of some kind by which to determine the desirability of purchasing a particular journal" (p. 1713). That arbitrary standard was to focus on their citedness. Years later, Brodman (1944) became a critic of Gross and Gross's (1922) quantitative method, then shortly after, Fussler (1949) took up the task again of listing leading journals. However, it was Dr. Garfield, along with his innovation in electronic indexing, who introduced the Journal Impact Factor (JIF).

    For a long time, the Science Citation Index had a positive impact. Although Garfield both witnessed and warned against the misuse of the JIF when evaluating individuals, he is ‘blissfully’ unaware of the scale of problems resulting from the use of the Journal Impact Factor. Now, we are looking down a long dark hallway leading to what some might call 'grimpact'. If we exit this dark hallway, we veer into a lit room called 'Open Access', but, how does this relate to research assessment, and when did we get here? To answer this, we can go further back in history, when science first handed itself over to the profitable business of scholarly publishing.

    The growth of commercial publishing and journals (Access)

    When scientific letters, reports, and later periodicals first appeared (i.e., the Philosophical Transactions of the Royal Society) there were good reasons to outsource publishing to fledgling businesses. Early editors, like Henry Oldenburg (i.e., founding editor of the Philosophical Transactions), were keen to generate income, but soon recognized how difficult it was to process, print, collect subscription fees and manage society publications without accruing financial losses. Commercial publishing grew at one time from a legitimate and realistic need. Editors required the support, and were for the most part, relieved to hand over the work. In the beginning scientific publishing was not profitable, but gradually it became more so. New businesses were founded, and for the past three and half centuries we have seen journals grow at an exponential rate, amounting to more than 30,000, though according to recent estimates, this number falls woefully short.

    Digital publishing and pay models (Affordability)

    We have now moved further and further away from this print-based history, having stepped firmly into the digital age. Digital publishing is less costly, and affords a significantly broader reach. However, the commercial subscription model paired with the ISI-Citation Index and elite selection of journals (based on the JIF) contributes not only to the evaluation problem, but the access problem as well.

    With the legacy of print maintained, Open Access is transitioning towards a ‘flipped’ publishing economy solution, with an increasing market concentration of academic publishers. This development is pushed by science policy and transformative agreements, but also by the acquisitions of Open Access publishers. Consumption-side business models are slowly being replaced by supply-side-business models, but we cannot assume that there will always be enough money in the academic system. Some scholars can benefit from Plan S, which allows them to rely on public research funding to make research results immediately accessible, but such affordability is not available to all. Research shows that when scholars intend to submit a new manuscript for publication, consideration is still given to the prestige attached to a highly-ranked journal. Empirical studies in the field of biomedicine have also shown how knowledge production is consolidated around the JIF. Many journals are simply privileged with a high rank, because of a strong age bias. And, in the age of AI, new empirical research has found that a journal’s impact factor is a bad predictor for ‘thoroughness’ and ‘helpfulness’ of reviews. 

    Thus, it seems more important than ever to ask ourselves how we can continue with Open Access, when the technology behind indexing, and the journal reputation economy has added to continued problems.

    Open Access Ideology

    Most academics are keen to support Open Access. Some are even Open Access ideologists. Certain ideologists may be refusing to publish content in any journal which is currently not freely available and fully accessible. Some might even refuse to carry out peer review for publishers that they do not respect (note: Why should I volunteer my time and efforts to support a greedy industry?)

    An approach like this, with all good intentions, has a downside. Though it is meant to put pressure on the commercial publishing industry, it is socially and scientifically unaffordable for many members of our broader scientific community, especially at a time when peer review is in crisis. Scholars are responsible for peer review, yet find it difficult amidst this tension between open access and paywalled content. The last thing that we need is fewer reviewers to call upon, or at least one less in situations where certain researchers have little choice but to publish in one of the commercially indexed, paywalled journals.

    Perhaps support for Open Access no longer demands that we focus solely on current ideologies attributed to this mandate. Is it not time to exit the well-lit OA-room and trip down that long dark hallway again, towards a radically new, and disruptive socio-technical innovation?

    Socio-Technical Innovation

    The creation of a systemic change, or shift in perceptions and behaviour patterns within our global scientific community implies that innovation starts with some sort of ‘symbolic strategy’. A strategy, which encourages scholars and institutions worldwide, to relinquish the symbolic nature of journal rank and prestige, especially in evaluation systems.

    Dr. Garfield was a socio-technical innovator for his time. He took us from the print age into the electronic age. We have also been introduced to the semantic Web, and now we are at the development stages of Web 5.0 - the open, linked, and intelligent Web. Let us not forget that Tim Berners-Lee’s idea behind the Web in the first place was to keep track of scientific information! In addition to a symbolic shift within the scientific/scholarly communication system we can move towards a material or tangible shift.

    Imagine, therefore; a reputation economy in science/scholarship, which is not attached to journal rank and title. What is a scientific journal, if not its editor-in-chief, editorial board, and thousands of volunteer academics worldwide who peer review submitted manuscripts? Many, if not most scholars believe in preserving the journal, and we will likely find it difficult to forget about them. Journals perform a constituent and organising role; a tangible outlet for scientific fields and disciplines. But, if we open ourselves up to more radical solutions, we might rather focus on preserving the registering, curating, evaluating, disseminating, and archiving function of journals, whilst keeping in mind thattheir real value lies in the communities that they create.

    Editors and editorial teams, for example, may choose to forgo journal titles altogether and exit a commercial publisher (Note: Exits do happen, as in the case of an editor and editorial board leaving a commercial publisher to form a new Open Access journal). In Shakespearian terms, what is in a name if ‘by any other name’ the rose would ‘smell as sweet!’ (i.e., journal name is different, but the editorial community is the same, and scholars continue to respect that editorial community)? In a similar vein, editorial boards might be encouraged to leave a commercial publisher, and move to an Open Access International Scholarship Space: A space focused on managing and maintaining digitally transformed scholarly records, which fulfils the traditional functions of a journal, ready to adapt to any future needs.

    Imagine a solution where an editor and editorial team are assigned to a topic management center of their own creation (i.e., a kind of digital library or scholarly digital infrastructure). At each online center, there could be a description of the topic area, including the specialty research areas of the editorial team. So, for example, if we renounce a commercially published journal called the “Journal of the Information Age” and renounce the titled journal called “Quantitative Studies of Quantitativeness”, our international community would then think about putting an article up for review at the “A Topic-Editorial Team” or the “B Topic-Editorial Team”.

    Whatever solution we choose, it starts with abandoning journal titles and rank then shifting to an innovative international socio-technological platform, based on key journal functions. The result would still be accessible research, still peer reviewed, and valued according to what should be valued: editorial teams and engaged peer review.

    This solution may be realised in many different shapes or forms, and may not necessarily solve all problems. We are not aiming to be strictly prescriptive here. However, it would put the scholarly record keeping firmly back into our own hands, and not in the hands of commercial ownership, though any kind of solution can include some commercial service providers (e.g., technical expertise, administrative support; style-setting/XML). It would also enable us to give more attention to other issues, like challenges associated with peer review. Taking such steps would be difficult, but we believe that the international science community is ready, and that there is more to gain through technological innovation.


    Header image created with GPT-4/Dall-E

    ]]>
    Alesia ZuccalaLars WenaasAlberto Martin Martin
    Introducing the CWTS ECR/PhD Councilhttps://www.leidenmadtrics.nl/articles/introducing-the-cwts-ecr-phd-council2023-11-08T10:30:00+01:002024-05-16T23:20:47+02:00In this blog post, we'll introduce you to the CWTS ECR/PhD Council, shedding light on its significance, objectives, and how it can serve as a crucial resource for early career researchers and PhDs at CWTS.CWTS is an interdisciplinary institute at Leiden University with a diverse multinational academic culture. PhD candidates, early career researchers, and visiting scholars from around the world gather at CWTS to pursue their research journeys. The journey can be an inspiring yet challenging experience. It might be filled with research, innovation, and personal growth, but it can also be a journey that feels isolating at times due to the solitary nature of research. Researchers need to spend extended periods working alone, which can lead to a sense of detachment from the broader social and academic community. Loneliness can be particularly challenging for our PhD candidates, early career researchers and visiting researchers who have transitioned to a new, unfamiliar environment. To counter this and to create a dynamic and supportive community, in September, we have started an Early Career Researcher (ECR) /PhD council with the two of us, Qianqian Xie as the Chair and Dmitry Kochetkov as a Council member, in the lead.

    What does it mean to be a PhD candidate or early career researcher?

    There is more to being a PhD candidate than just obtaining a degree. It assumes full involvement in the research process, from generating ideas to implementing them practically. The research process includes not only conducting research but also actively participating in academic events such as seminars, conferences, symposia, and round tables. Here, PhD candidates can exchange experiences with peers, discuss their ideas, and become familiar with new methods and approaches in their field of knowledge.

    Being a PhD candidate also entails constant self-development and self-education. It is necessary to continuously update one's knowledge, monitor new trends and discoveries in their field. Ultimately, all of this contributes to the development of the PhD candidates’ professional skills, their readiness for independent research activities, and successful careers.

    To some extent, the same holds true for early career researchers – not only the PhD candidates. Early career researchers are people taking their first steps in a academic career. They have a fresh and critical view of the world, full of energy and desire to contribute to the development of science. At CWTS, quite a few colleagues are doing research without following a PhD trajectory. We realized that we need to include them as well, since some of their struggles are the same.

    To provide support on the PhD and early career journey, we established the ECR/PhD Council.

    What is the ECR/PhD Council?

    The ECR/PhD Council is a small, dedicated body (currently consisting of two members) within CWTS that brings together PhDs and early career researchers. The Council is committed to the promotion of internal communication, coordination of supportive and networking activities, and social cohesion within the ECR/ PhD community. At the same time, the Council is the formal connection between the ECRs and PhDs and the CWTS PhD coordinator and the CWTS management board.

    What are we planning to do?

    • Building a Supportive Community: Pursuing an ECR/PhD can often feel like a solitary endeavor. The ECR/PhD Council offers a supportive community where individuals can connect, share experiences, and provide emotional support to one another. The Council members also take the lead in organizing non-academic related meetings and informal ECR/PhD moments, to provide support for the well-being and social needs of individuals beyond their academic pursuits. For instance, introducing properly new CWTS ECRs/PhD candidates and discussing challenges met during the PhD trajectory. Every two months we will have informal ECR/PhD moments (on-site), including drinks and pub-quizzes.
    • Academic Networking Opportunities: The Council provides a platform for networking with peers, mentors and potential collaborators, opening doors to new research opportunities. The Council holds monthly ECR/PhD internal seminars. These meetings will be held in hybrid format and in English to be as inclusive as possible. ECRs/PhD candidates may present and discuss academic work (proposals, results, papers, posters). We are also delighted to announce that the Council hosts farewell meetings for early career researchers, providing them with the opportunity to present the research they have conducted during their time at CWTS. Of course, this event is not mandatory but highly encouraged.
    • Buddy system: New CWTS PhD candidates are now offered the opportunity to be paired with a senior CWTS PhD candidate (a 2nd or 3rd year PhD candidate). External PhD candidates will also benefit from this system.
    • Providing insights to the CWTS Management Board.

      What has happened so far?

      Our experience of joining the ECR/PhD Council has been great so far! It’s not just about attending meetings and organizing events. It’s all about being part of a supportive and dynamic academic community. Here’s what the experience has been like:

      • Community Building: We’ve had the opportunity to connect with fellow PhD students and early career researcher from various fields, which has broadened our perspective.
      • Professional Development: Workshops, seminars and resources offered by the council are sharpening our professional skills and broaden our knowledge base.
      • Voice and Advocacy: The council gives us a platform to voice our needs and concerns as PhD candidates and early career researchers. It’s empowering to know that our interests are being represented.
      • Collaboration and Leadership: We’ve already been encouraged to take on leadership roles within the council, which we hope will allow us to develop leadership and teamwork skills.

      On October 13, 2023, ECR/PhD Council held its first welcoming meeting, at which the new PhD candidate and a new postdoc had a chance to introduce their research. The chairman of the Council also introduced all issues relevant to do a PhD at CWTS (i.e. facilities and services offered to PhDs, PhD trainings and courses, etc.). Even though the meeting took place on Friday, 13 nothing terrible happened. On the contrary, the meeting was held in a warm, friendly atmosphere.

      Welcoming event photo
      First welcoming event organised by the ECR/PhD Council.

      After the meeting, the council prepared food for all participants, and one of our colleagues even taught others how to roll spring rolls. It was not only a fascinating cultural experience but also an excellent way to strengthen relationships.

      If you would like to share your experience on how PhD activities are organized in your institution or if you have any questions, you can reach us via ecrphd@cwts.leidenuniv.nl!


      Header image: Hannah Busing

      ]]>
      Dmitry KochetkovQianqian Xie
      Does science need heroes?https://www.leidenmadtrics.nl/articles/does-science-need-heroes2023-10-11T13:33:00+02:002024-05-16T23:20:47+02:00Does science need heroes or does it need to reform? Idolizing heroes can worsen bias, inequality, and competition in science. Yet, it does require good leadership to ignite structural change. This commentary for a Rijksmuseum Boerhaave symposium on prize cultures aims to address this paradox.On the occasion of the 2023 Nobel Prize announcements, the Rijksmuseum Boerhaave symposium “Does science need heroes?” attempted to explore the evolution of prize cultures over time and examine the current and potential roles of prizes in contemporary scientific practices. I would like to thank Ad Maas, Curator of Modern Natural Sciences of Rijksmuseum Boerhaave and professor in Museological Aspects of the Natural Sciences at the Centre for the Arts in Society of Leiden University, for inviting me to give a comment on the second day of the symposium. This blog post is an adaptation of the talk I gave there.

      Does science need heroes? Spoken like a proper academic, my answer to this question would be: yes and no.

      Let me start with the latter.

      No, the last thing contemporary science needs are heroes. What it does need is structural reform. Science suffers from major flaws, including various forms of bias, structural inequality, lack of transparency and rigor, excessive competition, commercialization, and vanity publishing. It is unhealthy for researchers to want to be a hero in the current system.

      But also: yes! Science is in dire need of heroes! Because the science system needs to reform, we need different types of people who can lead the way and set an example with good leadership. This is what I want to address in this commentary.

      Rijksmuseum Boerhaave, Leiden. Source: Wikimedia Commons


      But first, and inspired by Museum Boerhaave's wonderful collection, I will go back to the 19th century, when the first university ranking was conceived. People often think the first ranking appeared around the 2000s, with the publication of the first commercial ranking. But that is not true. As is more often the case, problematic metrics for assessing excellence are in fact invented by scientists themselves!

      A few years ago, I examined the work of the American psychologist James McKeen Cattell with two of my colleagues. Cattell lived from 1860 to 1944, served as the long-time editor of the journal Science, and his primary academic interest was the study of 'eminence', a somewhat ambiguous concept that I translate here as excellence, eminence, or greatness. There is an interesting connection between Cattell's work on 'eminence' as the primary 'virtue' of individual researchers and the contemporary university rankings of the most prestigious, high-performing, Nobel Prize-winning universities with the most flourishing research and best teaching environments.

      Cattell studied in England and later held an office in Cambridge, where he eventually came into contact with proponents of eugenics. Cattell, and many other contemporaries interested in 'eminence' or greatness, observed a decrease in the number of 'great men' compared to earlier periods, which they found concerning. They feared the biological degeneration of the population, and this fear was exacerbated by a more general concern about the decline of the British Empire. This fear was further intensified by the rise of industrialization, democratization, and a growing working class. The preoccupation with 'great men' was also reflected in a growing interest in the role of the scientist in a time when scientific work increasingly became a 'profession' among other professions. The scientific method of eugenics gave Cattell the tools to classify 'eminence' in a new way. His idea was that professors could be placed on a single ranked list based on peer review. He asked a large number of scientists to create a list, ranking scientists from the most to the least prominent, based on a selection of names provided in advance. High "output" was insufficient as an indicator of 'eminence'; it was primarily about reputation among peers. What exactly this reputation was based on remained ambiguous. Cattell kept various background and biographical information about the men on the lists, including data on birthplace, residence, age, and especially the university where researchers had received their education. But his lists also quickly started to serve other purposes: he mapped how 'scientific eminence' was distributed across cities and universities. And I quote from a piece in 1903: "We can tell whether the average scientific standard in one part of the country or at a certain university is higher or lower than elsewhere; we can also quantitatively map the scientific strength of a university or department." So, initially, Cattell's lists were not compiled with the purpose of comparing institutions, but the information these instruments provided was indeed used for these comparisons.

      Table from Cattell, 1898: Doctorates in Philosophy from American universities in a single year


      Cattell's study of scientific men and his subsequent ranking of universities was deeply rooted in a larger debate about the role of the scientist. The ideal image of a researcher was evolving significantly at the end of the 19th and the beginning of the 20th century, as I think is happening again today. But back then, older ideas about the gentleman-scholar, driven by intrinsic motivation, were increasingly juxtaposed with ideals that were more in line with the concept of science as a paid profession. Just as the current preoccupation with excellence and ranking is related to a much broader discussion about what universities are exactly for today!

      Over the past 30+ years the Dutch and European governments have introduced several different policy instruments to foster excellent research. These policy instruments worked by stimulating competition in science, and what I find very interesting is how these research policy instruments have in the past decades started to shape our perception of excellent science through an interactive feedback loop between policy on the one hand and the practice of doing research on the other. An excellent researcher’s standing is now primarily determined by their research production. This is partly still science as a profession that Cattell and others instigated, but this profession is now saturated with key performance indicators (like a lot of other professions in neoliberal democratic societies). The primary tactical and strategic aims have become competing for (ever decreasing amounts of) research income, and publishing in prestigious journals, and aiming for a Nobel Prize. Put even stronger, prizes and awards have become important parts of academic CVs. And because of gender and other diversity gaps, this makes it harder for women and other minority groups to make a career in science. University rankings use prizes and awards as input, and this trickles down in university policies. Universities over the past decades have started to think in terms of globalised economic markets for excellent researchers.

      The motivation behind policies for excellence perhaps at one point made sense, and Dutch science is doing well by the numbers, but obviously, and this is not often acknowledged, there is a big structural issue with the way we measure excellence. If we are truly honest: current notions of excellence and metrics-driven assessment criteria are threatening to shape the content of the work and the diversity of the subject matter. We are observing that research is designed and adjusted in a way that ensures a good score. We see that people are choosing research questions not just based on interest or importance, but also to improve their chances of getting a job. This ‘thinking with indicators’ is obviously problematic for science when important research questions are not being addressed and even become ‘unthinkable’.

      This type of thinking also has consequences for the space in academia for what you could call ‘social’ elements. Think of decreasing collegiality, less commitment to the community, or bad leadership. And if we're mostly noticing and applauding the 'big names,' those veteran academics with a significant reputation, we are hurting the opportunities for talented newcomers and other team members who play crucial roles. What worries me is that the pressure in many places is so high that ambitious young researchers think they cannot go on holiday because otherwise their work will be ‘scooped’. Competitiveness can create feelings of constant failure among early career researchers, as they may never feel they meet the required standards. And even those who are at the top, and we have interviewed many, often feel they must continue to work ever harder to keep out-competing others. Group leaders and heads of department warn each other about the health risks that they run by chronically working very hard, year after year. This is an actual quote from an actual interview:

      The example these senior researchers are setting with that behaviour to their younger colleagues is that it is heroic to work eighty hours a week, and that if people can’t keep up, they are not fit for the Champions League. These senior researchers have really internalised that this is what it takes to play the game, and that if you can’t stand the heat, you should get out of the kitchen. But let’s face it, that kitchen is on fire.

      For one, we have globally had several severe integrity and reproducibility crises. We have seen the shadow side of competition, where researchers focus too much on finding new things and trying to do that quickly, even if that means that they might not be doing high-quality research. Of course, we all want to tell our students to dream big and ideally, we also provide them with the protected space to develop their own research and strive for the highest quality. However, if in the meantime we also encourage them to focus on chasing after groundbreaking results and judge success mainly by how many times our work gets cited by others, we create a culture where short-termism and risk aversion thrive. This culture is today also driven by a pressure to secure funding in competitive four-year cycles. This, in turn, makes it very hard for researchers to do long-term, risky projects, or work in fields that have a big impact on society but don't get cited as much, like applied sciences or social sciences. As a result, research agendas don't always focus on what society really needs. Also, all this competition can make scientists less likely to collaborate, which is crucial for solving complex problems.

      To make science better, we need to change our priorities, and support a wider range of research. We very urgently need more diverse perspectives and inclusive participation in science. We need to collaborate and open up, simply because what is expected of science today greatly exceeds the problem-solving capacity of science alone. And that is why we also really need to rethink the criteria for excellent research. These criteria need to be more inclusive, because research evaluation has the power to affect the culture of research; individual career trajectories and researchers’ well-being; the quality of evidence informing policy making; and importantly, the priorities in research and research funding.

      I would also like to address a misunderstanding about the Dutch ‘recognition and rewards’ program. I often hear a concern that the program wants to wishy-washily include everyone and forgets about upholding excellence. I do not think that this is a fair portrayal of the program. At its core, the program is about an honest look in the mirror, and about fixing what is broken. The program is part of a much larger set of national, regional, and global initiatives including the DORA Declaration and the Leiden Manifesto for research metrics, the Manifesto for Reproducible Science from 2017, FOLEC-CLASCO’s 2020 report on reforming research assessment in Latin America and the Caribbean, Europe’s CoARA, The Future of Research Evaluation synthesis paper by the International Science Council, The Inter Academy Partnership, and the Global Young Academy, and the global UNESCO Recommendation on Open Science.

      All these initiatives are part of a global effort to re-think evaluation. And we need other types of leaders and heroes in academia, who will work together to implement responsible forms of research assessment. We should stop sending each other the message that regardless of how hard we all work, there is always more we need to do to succeed. If we want our work to be meaningful, we need to invest more in building strong academic communities that value collaboration and share a commitment to advancing research and teaching, while making a positive impact on and with society.

      One of my heroes in life is Pippi Langström, or Pippie Langkous in Dutch. I used to watch her show when I was little. Pippi has this saying: “I have never tried this before, so I think I should definitely be able to do that.” I love it. And I believe that we need to reward this type of behaviour more than we currently do in academia, sadly. We should foster taking risks, trying something new, stepping out of our comfort zone, and being bold whilst not taking ourselves too seriously. But in fact, we see the opposite happen among early career researchers. Many of them suffer from anxiety and an unhealthy pressure to conform to a problematic norm. Helping to change that was one of my drivers to be part of this symposium, on a Saturday afternoon.


      Header photo: Adam Baker

      ]]>
      Sarah de Rijcke
      The Leiden Ranking goes beyond rankinghttps://www.leidenmadtrics.nl/articles/the-leiden-ranking-goes-beyond-ranking2023-09-27T06:30:00+02:002024-05-16T23:20:47+02:00Today the CWTS Leiden Ranking and the INORMS More Than Our Rank initiative announce a new partnership, aimed at highlighting the accomplishments of universities beyond what is captured in university rankings.The CWTS Leiden Ranking has always been a bit different from other university rankings. It has never sought to identify an overall ‘winner’ from amongst all the universities it features, preferring instead to offer a range of indicators and rank institutions on each one separately. It also looks beyond traditional citation measures and reputation surveys to assess concepts such as open access and gender balance. In addition, it presents its indicators in a number of different ways, not only in the traditional format of a ranked list of universities but also in two-dimensional charts and in a world map. The Leiden Ranking team has also consistently emphasised the importance of responsible use of university rankings.

      Today the Leiden Ranking takes a next step in promoting responsible ways of dealing with university rankings. By partnering with the INORMS More Than Our Rank initiative, the Leiden Ranking highlights that, notwithstanding any value that rankings may have, institutions are so much more than their rank.

      The More Than Our Rank initiative was launched in October 2022 to provide all universities, whether top ten or yet to place, with an opportunity to show how much more they have to offer the world than is captured in the global university rankings. Signatories simply add the More Than Our Rank logo to their website and provide a statement showcasing their activities, achievements and ambitions. A small, but growing, number of pioneering universities have become early signatories, supported by a wide range of international university associations, ranking providers and responsible research assessment groups, including the Leiden Ranking.

      As of today, the Leiden Ranking has taken its commitment to More Than Our Rank one step further: All More Than Our Rank signatories that appear in the Leiden Ranking are highlighted on the ranking website by presenting the More Than Our Rank logo next to their institution name (see the screenshots below). Visitors to the website will be able to click on the link on each institution’s profile to visit the More Than Our Rank website and view an institution’s More Than Our Rank statement.

      Participating in the More Than Our Rank initiative is a risk-free way for institutions to emphasise their strengths not captured by global rankings. By highlighting a university’s More Than Our Rank endorsement on the Leiden Ranking website, we aim to provide further encouragement for institutions to join More Than Our Rank.

      The CWTS Leiden Ranking and INORMS More Than Our Rank initiative are thrilled to be partnering in this way. We hope that many more institutions will be encouraged to participate in More Than Our Rank and to provide a more rounded view of university quality.

      The More Than Our Rank logo displayed next to the names of Keele University and Loughborough University highlights that these universities are More Than Our Rank signatories


      More Than Our Rank signatories are highlighted in orange.


      Loughborough University is a More Than Our Rank signatory. Its More Than Our Rank statement can be viewed by clicking the More Than Our Rank link.

      ]]>
      Elizabeth GaddLudo WaltmanNees Jan van Eckhttps://orcid.org/0000-0001-8448-4521
      Research(er) assessment that considers open sciencehttps://www.leidenmadtrics.nl/articles/researcher-assessment-that-considers-open-science2023-09-26T10:30:00+02:002024-05-16T23:20:47+02:00A key challenge in the reform of research assessment is to recognise and reward the adoption of open scientific practices. In this post, Anestis Amanatidis reflects on this challenge and invites you to join the conversation in bimonthly online meetings.Research assessment practices that largely rely on publication-driven assessments of research(ers) are slowly running out of steam. A remnant of a science system that is largely inward-focused and output-oriented, these assessments paint a rather monochrome picture of science that is not fit for today’s developments that reconfigure the relationship between science and society.

      One such reconfiguration that enjoys a lot of attention at the moment comes under the banner of open science. It has become a powerful device for reconfiguring scientific research and is currently the centre of immense policy attention on all levels:

      UNESCO describes it as a policy framework to address existing inequalities that are produced through science, technology and innovation vis-á-vis environmental, social and economic challenges in their Recommendation on Open Science. The text seems to be bearing considerable hope for fostering science practices that are open, transparent, collaborative and inclusive by valuing quality and integrity, collective benefits, equity and fairness, and diversity and inclusiveness as core values.

      Also, the European Commission embraced open science as a policy priority with considerable investment in the development of the ‘European Open Science Cloud’ as a central platform to publish, find and reuse research assets. Simultaneously, European funding prioritises open science practices in the form of sharing of publications and data ‘as open as possible and as closed as necessary’.

      Indeed it seems that these policy investments do carry fruits as can be seen in the formation of national bodies, like Open Science Netherlands, that were heralded as supporting the advancement of open science on country-level or the evident inclusion of open science in university strategies.

      Nonetheless, open science is also a terribly ambiguous ‘umbrella term’ that is enacted in multiple ways across different research communities. Conceptions range from purely output-oriented notions surrounding open access to process-oriented priorities, such as engaging non-academics in knowledge production. As my colleagues Ismael Rafols and Ingeborg Meijer summarise in their blogpost on monitoring open science:

      When relating this ambiguity to research(er) assessment, it becomes evident that the proliferation of open science practices challenges the monochromatic properties of publication-driven research(er) assessments. This urges research assessment to be reconsidered in the light of open science. Luckily, there has been much work in making research(er) assessment more polychromatic. This has been spearheaded by initiatives such as DORA, has stabilised with the formulation of the Hong Kong Principles and recently has institutionalised in the Coalition for Advancing Research Assessment (COARA); a massive undertaking that supports the adoption of responsible research assessment practices across knowledge producing organisations. Indeed, CoARA’s description on their webpage summarises briefly what responsible research assessment means for them:

      Similarly to open science, responsible research assessment describes a broad range of aspirations in research assessment that largely focus on the responsible use of research metrics in assessment contexts and the fostering of an inclusive and diverse research culture in science through assessment. These developments in research assessment recognise and promote practices that paint a more polychromatic picture of science, where research(ers) are recognised and rewarded for more than the outputs they produce.

      Both developments – open science and responsible research assessment – have a unique opportunity to strengthen and reinforce one another. Research assessment reform can provide the institutional incentives to the adoption of open scientific practices in research, and the diversity of practices promoted under open science can serve the reform of research(er) assessment. However, despite this promising interrelation, both movements risk developing in parallel to one another as long as questions about the aspirations of open science are not discussed with the affordances of responsible research assessment in mind.

      Indeed, there is ongoing work to illuminate these complexities in the form of various European Commission-funded projects. How research(er) assessment that considers opens science can play out in practice is being researched by GraspOS, a project which is concerned with how infrastructures afford the uptake of research assessment that values open science. The project OPUS focuses on indicators for the assessment of researchers in the context of open science. PathOS tries to better understand the impacts of open science. Similarly, the SUPER MoRRI project developed an evaluation and monitoring framework for responsible research and innovation in Europe that, in many ways, relates to reconfigurations in knowledge production as posited under the banner of open science as well.

      Early reflections from these projects and related communities can be brought forward with Sabina Leonelli’s recent book (2023). She describes open science as backed by a rationale that relies on a strong orientation towards the sharing of objects of science. These objects do not necessarily describe how research is done, but are themselves (by)products of research, including data, publications, models, codes et cetera. In this notion of science, access to existing scholarship and related objects becomes conditional for successful open science.

      Indeed, this notion of open science is widely shared and is often reinforced in research(er) assessments that consider open science through the enrolment of object-oriented knowledge that comes in the form of indicators describing e.g., open access outputs. However, these research assessments only make visible a very narrow interpretation of openness in science and obscure descriptions of how research is done – which is a key consideration for recognising and rewarding researchers on responsible conduct of research, transdisciplinary work and other ‘broader’ interpretations that can be found in the UNESCO conceptualisation of openness; and often remain invisible.

      This gives rise to interesting questions about capturing immaterial properties of research, in particular when it comes to shared knowledge production processes and how they reconfigure values and relations or bring up matters of collective concern. These dimensions of research are still widely underrepresented and unaddressed in research(er) assessments in the context of (open) science.

      Conclusively, research(er) assessment that considers open science is still in a nascent stage. It is therefore critical to collate and exchange experiences of practical attempts to conduct research assessment that considers open science. At GraspOS, we will ask these questions in bimonthly online meetings starting 18 October 2023 and present ongoing stories from universities, national funders, thematic research clusters to discuss the multiple ways in which (responsible) research assessment considers open science.

      We hope to hear stories about issues, frustrations and successes of research assessment in relation to open science. Finally, the goal of this community is to create a bouquet of stories from which we can learn and draw inspiration for our own research assessments. If this is something of interest to you, please feel free to register here and share this post.

      ]]>
      Anestis Amanatidis
      The Role of University Rankings in Research Evaluation Revisitedhttps://www.leidenmadtrics.nl/articles/the-role-of-university-rankings-in-research-evaluation-revisited2023-08-22T10:30:00+02:002024-05-16T23:20:47+02:00How are rankings used in research evaluation and excellence initiatives? The author presents a literature review using English and Russian sources, as well as gray literature. The Russian case is highlighted, where rankings have had an essential role in research evaluation and policy until recently.Since their inception in 2003, global university rankings have gained increasing prominence within the higher education landscape. Originally designed as marketing and benchmarking tools, the rankings have transformed into influential instruments for research evaluation and policymaking. Acknowledging the vast impact they have had on the field, my recent study aims to provide an extensive overview of the literature pertaining to the use of university rankings in research evaluation and excellence initiatives.

      The paper presents a systematic review of existing literature on rankings in the context of research evaluation and excellence initiatives. English-language sources primarily constitute the basis of this review, although additional coverage is given to literature from Russia, where the significance of rankings in the national policy was emphasized in the title and objective of the policy project 5top100 (the review covers only a relatively small part of Russian-language literature on rankings; an extended study of the Russian academic literature is available here). Furthermore, gray literature has also been included for a comprehensive understanding of the topic.

      The attitudes towards university rankings and their use in research evaluation in academic and gray literature

      The literature analysis reveals a prevailing academic consensus that rankings should not be employed as a sole measure of research assessment and indicators of the national policies. Rankings can be used for marketing and benchmarking functions, but in a responsible way by recognizing their limitations. Various authors have highlighted technical and methodological flaws, biases of different nature (including biased evaluation of both universities and individual researchers), conflicts of interest, and risks to national identity. Criticism is mainly focused on rankings that use a composite indicator as a single overall measure of university performance (QS, THE, and ARWU). Rather few studies demonstrate a positive or neutral attitude towards global university rankings. The key findings from the literature are summarized in the diagram below.

      Figure 1: Map of views on global university rankings and their use in research evaluation


      It is noteworthy to observe that the perception of global university rankings in gray publications has undergone a substantial evolution. During the 2000s and early 2010s, there existed a favorable outlook on university rankings, with policymakers and certain academics endorsing their use to gauge the excellence of higher education institutions on a global scale, to some extent. In recent years, there has been a discernible shift in the perspective in the gray literature towards university rankings, becoming more inclined towards a critical view.

      Rankings and research evaluation in the Russian science system

      Rankings played an incredibly significant role in Russian national policy. In 2013-2020, the Russian government implemented the 5top100 project aimed at getting five Russian universities into the top 100 of global university rankings. The goal of the project was not achieved, but some experts noted positive changes, primarily an increase in the number of publications by Russian universities. The 5top100 project was continued within the framework of the Priority-2030 program. This ongoing policy initiative is also aimed at promoting the development and advancement of national universities. One distinct aspect of this program is its rejection of global university rankings as the sole basis of evaluation. By moving away from a narrow reliance on global rankings, the program aims to foster a more holistic and context-specific approach to assessing the performance and progress of Russian universities. However, a considerable proportion of evaluation in Priority-2030 still depends on quantitative indicators also used in the methodologies of global university rankings, in particular the scoring of publications based on the indexing of journals in Scopus or Web of Science.

      Despite the rosy reports of Russian universities moving up in the rankings and increasing their publications, it suddenly turned out that the country did not have enough technological competencies to produce car paint or starter cultures for dairy products. The situation appears to be even more concerning when examining the analysis of ranking positions for 28 Russian universities that sought consulting services from Quacquarelli Symonds (QS) between 2016 and 2021 (see the analysis by Igor Chirikov). The findings revealed an unusual increase in ranking positions that could not be justified by any observable changes in the universities' characteristics, as indicated by national statistics. This phenomenon, termed "self-bias" by the author, raises questions about the validity of these rankings. It is worth noting that in the latest edition of the QS ranking, all Russian universities experienced a significant decline in their positions. This begs the question: were Russian universities performing well previously, and has there been a noticeable deterioration in their activities lately? Overall, it is my belief that relying solely on university rankings cannot provide a reliable answer to these inquiries.

      Back to the literature review, I must admit that the scope of topics covered in Russian-language literature regarding rankings is remarkably limited, with the dominant theme revolving around competitiveness. Furthermore, there is a striking lack of overlap between academic and gray literature in Russian compared to English-language sources. In fact, the only point of intersection is the neo-colonial discourse, which considers rankings as a tool for promoting the Western model of higher education. Some authors also point out the difference between the Western and Russian model of higher education, for instance, Lazar (2019). In Western countries, science and higher education have traditionally coexisted within universities, with applied research being actively developed through the participation of businesses. In contrast, in Russia, since the times of the USSR, there has been a "research triad" consisting of the Academy of Sciences, industry design bureaus, and research institutes, while universities and industry institutes have primarily focused on personnel training with government funding. As a result, both fundamental and applied research has historically been largely conducted outside of universities in Russia.

      The topic of responsible research evaluation is poorly developed in Russia. Regrettably, this indicates the isolated nature of Russian science and educational policy debates, which obviously hampers the prospects for development.

      What to do in this situation?

      I believe the problem described above concerns not only Russia. Although the degree of influence is different, the rankings continue to shape national and institutional strategies in higher education practically all over the world.

      I have emphasized the inherent complexity of dismissing rankings outright since they continue to serve as effective marketing tools. Having said that, I must also acknowledge the complexity of cultural change. Even now some people believe that university rankings measure the international prestige of the country “based on the objective assessment by experts from different countries of the significant achievements of universities.”

      A recent report by the Universities of the Netherlands proposed a strategy deal with university rankings in more responsible ways. This entails the implementation of initiatives at three levels. In the short term, universities should embark on individual initiatives. In the medium term, coordinated initiatives should be undertaken at the national level, such as collaborative efforts by all universities in the Netherlands. In the longer term, coordinated initiatives are to be set up at the international level.

      At present, I would suggest focusing on several specific stops:

      • Stop evaluating academics based on university ranking indicators. Start rewarding the contributions of faculty and researchers in all areas of university activities.
      • Stop constructing university strategies based on university rankings. Do not use ranking tiers in analytical reports for management decision making; instead, focus on the actual contributions made by a university (scientific, educational, and societal).
      • Stop evaluating universities based on ranking indicators. Every university has a unique mission, and only fulfillment of this mission really matters.
      • Stop using ranking information in national strategies and other kinds of ambitions. Only universities’ contributions to national and global goals should be considered.
      • Stop paying money for consulting services to ranking compliers. This is a pure conflict of interests.

      However, the change starts with each of us. Every time that we say or post in social media something like “My university has advanced N positions in ranking X”, this adds to the validity of rankings in the eyes of potential customers. By refraining from making such statements, every member of academic community can contribute to reducing the harmful impact of rankings.


      Competing interests
      The author is affiliated with the Centre for Science and Technology Studies (CWTS) at Leiden University, which is the producer of the CWTS Leiden Ranking and is engaged in U-Multirank. The author is also a former employee of the Ministry of Science and Higher Education of the Russian Federation that implemented the Project 5top100 excellence initiative. No confidential information received by the author during the period of public service in the Ministry was used in this paper.

      Header image
      Nick Youngson 

      ]]>
      Dmitry Kochetkov
      Why coverage matters: Invisibility of agricultural research from the Global South may be an obstacle to developmenthttps://www.leidenmadtrics.nl/articles/why-coverage-matters-invisibility-of-agricultural-research-from-the-global-south-may-be-an-obstacle-to-development2023-07-21T10:30:00+02:002024-05-16T23:20:47+02:00To support development and sustainability in the Global South, contextual and locally appropriate knowledge on agriculture needs to be visible and accessible. Improving coverage in global open scholarly infrastructures can play a crucial role in increasing visibility.How agriculture benefits from research through extension and engagement

      Different sectors benefit from science in different ways. In the case of agriculture, innovations based on science often originate from providers of farmers, for example in the form of seeds or machinery. However, the diffusion or uptake of innovations is difficult, in particular for small farmers. For this reason, the dissemination of agricultural research through initiatives like ‘extension’ programs has long been recognized as essential for development.

      These extension activities to reach out to small farmers are particularly important in relation to improving livelihoods. In 2020, 720-811 million were suffering from hunger worldwide, of which 50% were estimated to be small farmers. This means that improving food security requires forms of research transfer and local and indigenous knowledge integration that reach out to small farmers, who constitute a particularly vulnerable group.

      Public organisations working on agriculture have long been aware of the centrality of ‘extension’ for improving rural livelihoods. The reason is that agriculture depends heavily on contexts, and agricultural contexts may change dramatically across short geographical distances due to variations in climate and soils. The notion of ‘extension’ research gradually shifted from top-down, unidirectional teaching from researchers to farmers, toward more mutual learning and co-operation between researchers and farmers, so that science can respond to these local needs and contexts. Through participatory and learning approaches can technical and local knowledge be combined in order to achieve appropriate technologies.

      The lower visibility of engaged scholarship in agriculture may lead to use of inappropriate technology

      However, research that is more engaged with users and more orientated towards application tends to be associated with lower academic visibility, because its publications are often not included in the mainstream bibliographic databases.

      Various studies have shown that coverage of journals of agricultural sciences in mainstream databases is lower than in the natural sciences, but well above the social sciences and the humanities. Yet the situation is much worse in terms of the coverage of the Global South in the mainstream databases. For example, studies by Subbiah Arunachalam in 2001 showed that of the 10,000 publications by Indian researchers in agricultural research, 78% were in Indian journals and 77% were not indexed by Web of Science. Other studies have highlighted that crops relevant in the Global South also have a much lower coverage in Web of Science (WoS), for example the crop pearl millet.

      A study on rice research found that coverage of publications in mainstream databases was 2 to 3-fold higher for the Global North. Similarly, the coverage of topics relevant to the Global North in WoS and Scopus was 2-3-fold higher than the topics more relevant in the Global South – as illustrated in Figure 1 for the case of rice research.

      Given that the mission of agricultural research institutes and councils is to increase food security, reduce poverty and improve natural ecosystems, knowledge communicated through a plurality of channels should be valued beyond mainstream international journals. This would include, for example, publication formats such as those collected by FAO in its AGRIS database (based on national collection and analysis centres), which include coverage of more diverse document types (reports, policy briefs, etc.) in comparison to citation index databases such as WoS or to abstracting and indexing databases such as CAB Abstracts.

      This lack of visibility has at least two downsides. First, universities or research institutes conducting extension programmes or engaged agricultural research have often come to be perceived as not doing prestigious science – as excellence has increasingly been defined according to publications in prestigious journals. As a result, researchers may feel motivated to study topics valued by ‘top’ journals, which are mostly focused on topics in the Global North.

      Figure 1. Coverage of publications on rice research across two mainstream databases, Scopus and Web of Science (WoS), and a database with a larger coverage of the Global South, CAB Abstracts (2003-12). Topics which are more relevant for the Global North (such as molecular biology) have a much higher coverage than topics relevant to small farmers in the Global South (such as plant characteristics or protection). Source: Rafols, Ciarli and Chavarro (2015).

      Second, without being indexed in databases and without good Academic Search Engine Optimization for Open Access content, valuable contextual knowledge is harder to discover, making it challenging to retrieve or access it. In consequence, technical experts in agriculture in the Global South are more likely to apply technologies which are inappropriate in their countries. For instance, the crop varieties that are available in WoS may not correspond to relevant varieties for a tropical context, and information about the crops may be appropriate for Europe but inappropriate in Brazil or India. Including more local agricultural journals in bibliographic databases could help promote local agricultural solutions, as researchers and practitioners would have access to a wider range of information and perspectives.

      A recent study shows that countries in Africa and Asia suffer a much higher loss of productivity in agriculture than countries in Europe and the Americas as a consequence of the use of inappropriate technologies, where the degree of inappropriateness is estimated as the mismatch in the presence of crop-specific pests and pathogens (see Figure 2). This inappropriate use of agricultural technologies is partly due to the lower amount of research in topics and areas of interest of the Global South, but also partly due to the challenges in locating and accessing contextualised knowledge which already exists but is published in local venues (journals, reports, policy documents, etc.).

      Figure 2. Causal effects of inappropriateness of agricultural technologies by country. Left: Histogram across countries of losses in productivity due to inappropriate use of technology. Right: Scatterplot of productivity against productivity losses by country. Colours indicate continents. Source: Moscona and Sastry (2022).

      Towards broader coverage of agriculture in bibliographic databases

      A new publication by the Public Knowledge Project interestingly challenges the perception, created by the conventional use of mainstream databases, that research is extremely concentrated in journals and publications of the Global North. Analysing 25,671 journals with 5.8 million documents of the platform Open Journal System (OJS), they found that 80% of the publications originated in the Global South, that 85% are in diamond Open Access (no fee for authors nor readers) and almost half of them have more than one language.

      The success of the OJS infrastructure in making possible access and visibility of knowledge from the Global South suggests that it is high time for the development of more comprehensive databases. This has been a concern in medical research and social science and humanities (SSH), leading to the development of regional specialised databases such as Scielo (more on health) and Redalyc (more on SSH). In recent years we have also witnessed the development of more comprehensive databases like Open Alex, Dimensions or Lens.

      We have conducted a small study using the MIAR portal of the ‘Information Matrix for the Analysis of Journals’ of the University of Barcelona in order to make a rough estimate of the journal coverage of various databases (see detailed methodology and journal data). As shown in Figure 3, from a sample of 1662 journals from any country with ISSN related to agriculture, we found that CAB Abstracts had the highest coverage with 805 (48%) journals, 562 (34%) of Scopus, 435 (26%) of WoS and 550 (33%) of Veterinary Sciences. In terms of regional coverage, CAB Abstracts and Veterinary Sciences have a better and broader coverage in the Global South in relative terms.

      Figure 3. Coverage of the analysed sample of 1662 agricultural journals by the largest database specialised in agriculture, CAB Abstracts, in comparison to WoS and Scopus. 46% of the journals are not covered by any of these databases.

      These results have to be contrasted with new databases such as Dimensions and Open Alex that index papers rather than journals. Here we have made some estimations for Dimensions, which showed a coverage of about 1160 (70%) of journals. The coverage was high also in the Global South, with 46 (41%) of African journals, against a 28 (25%) in CAB Abstracts. Only for a few countries, including Iran, Germany, Romania or Cuba, was Dimensions coverage lower than CAB Abstracts.

      The downside of these new, more comprehensive databases (alongside with the Google Scholar Coverage) is the lack of inquiry of the publishing practices of journals. We found that some of the journals included in the larger databases, but not present in the more traditional databases such as CAB Abstracts, have a higher incidence of problematic or questionable editorial and review practices (here the term ‘predatory’ is unhelpful).

      Another bibliographic coverage is possible, and necessary

      In conclusion, another bibliographic world is possible where knowledge is more diverse and accessible – and this is important for agricultural research to be more visible and accessible in and from the Global South. Infrastructures towards this transformation have to be developed to enhance interoperability and cooperation. This is the case, for example, of the analysis centres that feed the FAO's AGRIS information system, including grey literature. While currently no single commercial bibliographic database has a good coverage of agriculture, a new generation of databases in conjunction with metadata aggregators from open access repositories may help fill this gap. This increase in diversity of journals comes at the cost of having a larger greyscale of rigour in journal editorial practices. This challenge could be overcome with catalogues of editorial practices such as DOAJ or Latindex and platforms such as MIAR.

      It is about time to create more comprehensive open infrastructures to provide visibility and accessibility of agricultural knowledge relevant to many more contexts, particularly in the Global South, so that knowledge of appropriate technologies can foster human development across all the world.

      Acknowledgement: We thank Subbiah Arunachalam, Tommaso Ciarli and Diego Chavarro for helpful discussions.

      Header image: Jagamohan Senapati on Unsplash
      ]]>
      Ismael Rafolshttps://orcid.org/0000-0002-6527-7778Madhan MuthuJosep-Manuel Rodríguez-GairínMarta Somoza-FernándezCristóbal Urbano
      Doing science in times of climate breakdownhttps://www.leidenmadtrics.nl/articles/doing-science-in-times-of-climate-breakdown2023-07-06T15:36:00+02:002024-05-16T23:20:47+02:00Whose side are scientists on in times of climate breakdown? Science is often called upon to provide knowledge and expertise to address global challenges and accelerate towards sustainable futures. But, critical times ask for critical thinking on science for sustainability.European and global science policy have been restructured around ‘global challenges’ and ‘research excellence’ to commit to societal impact. Our current global challenges, including climate change, destruction of nature, and increasing global inequality, require critical interrogation of the contributions and consequences of science. In the process of understanding, resolving, and transforming global challenges we should be attentive to what is at the core of science: the attribution of value to numerical or qualitative values such as counting, classifying and evaluating physical and societal phenomena. This also holds for the practice of governing science. Science policy articulates particular kinds of future (e.g. environmental or societal outcomes) that are considered either desirable or unattractive, and it ascribes particular roles and values to science in the making of these futures. This raises important questions about the values attributed to scientific expertise and policy making in relation to sustainable futures, and the role and agency of science and policy in shaping sustainable futures.

      In an attempt to address these questions, we hosted a two-day workshop on 13 and 14 June 2023 as part of the FluidKnowledge project of Sarah de Rijcke. We gathered a variety of academics reflecting on doing science in times of climate breakdown. Participants submitted contributions that covered different topics including but not limited to biodiversity modelling for sustainable financing, sustainable agriculture, deep sea mining and nature conservation. The variety of topics provided different angles to reflect upon roles and practices at the interface between science policy and scientific expertise, and how scientists position themselves in their research. Although many relevant concepts were discussed for each contribution, we would like here to highlight two common themes: Power and Plurality. Both concepts materialized in various forms and contexts and made the bridge between the different contributions. The combination of Power and Plurality made us, during the workshop, reflect upon our own position as researchers.

      Power, Plurality, and the Position of the research(er)

      We started the workshop with two contributions addressing climate and biodiversity modelling. Power materializes in modelling practices when modellers navigate the powerfulness of climate and biodiversity scenario models in shaping policies and futures. Biodiversity and climate models are often developed by scientific institutions to project biodiversity and climate patterns. However, their power extends beyond the scientific institutions when they are applied to, for example, inform decision-making in sustainable financing or global policy-making. In these translation processes from science to environmental decision-making the political, social and ethical dimensions come into play. The plurality of perspectives present in these dimensions are not integrated in the original models. Nevertheless, the models and the knowledge models create are used in high level decision-making and serve therefore as a powerful tool that scientific institutions should take into account in their model designs.

      When zooming out, we touched upon the powerful organizational forms of what is valued as ‘useful science’, which is now dominated by the (Western) techno economic paradigms that steer green technology transitions. A good example of the power of this paradigm is the demands it puts on governments, companies, and researchers to explore the deep seabed for minerals like cobalt to support a sustainable future. We touched upon deep sea research that seem to be trapped into a power grab, controlled by (inter)national governments and industry to generate knowledge on the environmental impacts of deep-sea mining useful for companies and policy-making at international levels. In relation to that, the importance of disinterestedness of researchers in this space is highly valued by most actors involved. As a result, this means that eyebrows are being raised when researchers cooperate with industry or, alternatively, when researchers tend to take radical views against deep sea mining. Is it, as scientists, justifiable to step away from the importance of being detached and disinterested, and actively choose sides?

      Whose side are we on?

      ‘Whose side are we on’ as researchers was vividly highlighted when discussing a contribution on the co-creation of knowledge for nature conservation in South Africa. The pressure put on scientists to engage with the variety of social actors that work in South African nature parks stems from the belief that this would increase the effectiveness of implementing conservation policies and empower local communities. However, based on experiences with research projects on transfrontier wildlife management and private game farming, we discussed whether knowledge co-creation can also be counterproductive for empowering marginalized communities. This could be the case when powerful actors like non-profit organizations or wildlife managers try to silence marginalized communities through discrediting researchers and delegitimizing other types of knowledges and perspectives. Instead of disengaging, detaching, and staying independent from these power dynamics, researchers might have to choose positions when engaging in these types of socio-ecological issues.

      By the end of a fruitful and constructive workshop discussion, we were left with more questions than answers to reflect upon. The discussions and diversity of topics that were addressed in the context of doing science in times of climate breakdown led us to reflect on who’s side we are on as researchers ourselves. This includes the question of what we can potentially do (more of) or should stop doing within our research and beyond to address global challenges. What does it actually mean to be a scientist in this world? Should we politicize science, take (very) critical views on what is happening, stand up from the relatively comfortable science studies armchair and dive in?

      What is next? All workshop participants will continue to write their own contributions and reflect on these questions in the next year. The current contributions will be further developed into a journal collection or edited volume. We extend our warm thanks to all participants of the workshop: Béatrice Cointe, Klaudia Prodani, Mandy de Wilde, Niki Vermeulen, Thomas Franssen, Jorrit Smit, Jackie Ashkin, Francesco Colona, Anne Urai, Esther Turnhout and Marja Spierenburg.


      This blog post is part of a project that has received funding from the European Research Council (ERC) under the European Union’s Horizon 2020 research and innovation programme (Grant agreement No. 805550).

      ]]>
      Renate ReitsmaSarah de Rijcke
      Indicadores responsables y posiciones en rankings. ¿Qué significa una posición en el Leiden Ranking? [Spanish blog post]https://www.leidenmadtrics.nl/articles/indicadores-responsables-y-posiciones-en-rankings2023-06-27T16:25:00+02:002024-05-16T23:20:47+02:00El Leiden Ranking de Universidades 2023 ha sido publicado. En este post, explicamos lo que los indicadores del ranking dicen y lo que no dicen.El Leiden Ranking de Universidades 2023 ha sido publicado el 21 de junio del presente año. Contiene 1411 universidades de todo el mundo, incluyendo 58 de América Latina. Al abrir la página para 2023 encontramos en un listado a la Universidad de São Paulo en la posición 12 y la Universidad Nacional Autónoma de México en la 98. Pero ¿qué significan estas posiciones? En este post, explicamos los indicadores del Leiden Ranking, lo que dicen y aún más importante lo que no dicen.

      ¡Hemos subido en el ranking!

      Cuando un ranking se publica, es común ver noticias acerca de tal o cual universidad que se ha colocado en una posición superior comparada al año anterior y que ahora se encuentra en el top 5, 10 o 100 de cierta región. La nueva posición es usada como una muestra irrefutable de la excelencia de la institución y del esfuerzo de sus empleados. Las preguntas que casi nadie hace son ¿de qué manera es la universidad número 30 mejor que la universidad 31? O, ¿qué tan diferente es la universidad 30 en comparación con la 29?

      Muchos rankings usan indicadores compuestos, esto quiere decir que toman varias medidas como publicaciones científicas, encuestas de estudiantes, número de subvenciones y premios internacionales entre sus graduados; los mezclan de acuerdo a una fórmula interna y le dan una calificación a cada institución. De esta forma es difícil saber de qué manera una universidad es “mejor” o “peor” que una universidad que está una posición arriba o abajo.

      Este modo de asignar valor a una institución en comparación a otras ha sido ampliamente criticado por usar indicadores arbitrarios, por equiparar aspectos difíciles de comparar entre sí, o por la falta de transparencia en cuanto a los mecanismos para asignar valor. Por ejemplo, una universidad que se estableció hace más de 130 años tendrá probablemente más ganadores del premio Nobel que una universidad que se estableció hace 40 años. A pesar de ello, los listados jerárquicos de las “mejores universidades del mundo” siguen siendo publicados y usados ampliamente, especialmente por las propias universidades y los medios de comunicación.

      El Leiden Ranking

      El Leiden Ranking no es un listado jerárquico ni estático, sino que provee indicadores cubriendo varias dimensiones del desempeño de 1411 universidades mundiales a partir de datos bibliométricos, es decir a partir de publicaciones científicas. Las universidades que se han incluido en la última edición, 2023, son aquellas que tienen un mínimo de 800 publicaciones contadas de forma fraccional e indexadas en la Web of Science (WoS).

      El ranking es publicado por el Center for Science and Technologies Studies (CWTS) un centro de la Universidad de Leiden en los Países Bajos, y se guía por 10 principios para el uso responsable de ranking de universidades.

      Perspectiva de listado

      A primera vista, el Leiden Ranking parece un ranking como cualquier otro dado que al abrir la página encontramos un listado de universidades ordenado de acuerdo a cierto criterio de impacto científico: por defecto el número de publicaciones (P) calculadas siguiendo el recuento fraccionario. Sin embargo, este no es un ordenamiento jerárquico estático de universidades ya que de forma interactiva podemos ordenar el listado basándonos en la dimensión e indicador que estemos interesados, de entre las diferentes opciones que se ofrecen. De hecho, el ranking no es un listado sino una herramienta que permite explorar los indicadores desde varias perspectivas. Además, el listado inicial que aparece es una de las tres perspectivas que ofrece el sitio para explorar diferentes dimensiones e indicadores, las otras dos son por mapa o por gráfico.

      Perspectivas de gráfico y en mapa

      Diferentes dimensiones e indicadores

      A diferencia de otros rankings, el Leiden Ranking sólo provee información sobre los resultados de la investigación científica a partir de publicaciones en revistas indexadas por la WoS. Este enfoque nos permite garantizar que los datos hayan sido recolectados y enriquecidos con rigor, y que la metodología usada para el análisis sea transparente.

      Las diferentes dimensiones que se pueden explorar son:

      • Impacto científico – basada en citas a las publicaciones de una universidad.
      • Colaboración – basada en la colaboración de una universidad con otras organizaciones y regiones.
      • Acceso Abierto – basada en las publicaciones en acceso abierto de diferentes tipos.
      • Género – basada en el análisis de género de los autores de las publicaciones.

      Por su parte, cada dimensión se puede explorar a través de diferentes indicadores como número total o porcentaje de publicaciones, distancias para la colaboración y tipos de Acceso Abierto. En la página de indicadores se encuentra una explicación más detallada de cada uno de ellos (en inglés).

      Además de las dimensiones y sus indicadores, el usuario puede crear su propio ranking seleccionando un periodo, disciplina, región y número mínimo de publicaciones. Por último, los indicadores de impacto científico se pueden calcular utilizando un método de recuento total o fraccionario. El método de recuento completo otorga un peso total de 1 a cada publicación de una universidad. El método de recuento fraccionado da menos peso a las publicaciones colaborativas que a las no colaborativas.

      La Universidad de São Paulo y la Universidad Nacional Autónoma de México

      En la edición del 2023 encontramos a la Universidad de São Paulo (USP) y a la Universidad Nacional Autónoma de México (UNAM), entre muchas otras de América Latina. Al ver la vista estándar en el listado parece que USP está en 86 posiciones más arriba que la UNAM. Si nos fijamos en las opciones veremos que se trata del periodo 2018-2021, para todas las disciplinas, en todo el mundo, con un mínimo de publicaciones en 100, dimensión impacto científico, ordenado por número total de publicaciones (recuento fraccionado). Si cambiamos las opciones, las posiciones cambiarían. A continuación, presentamos algunos ejemplos.

      • Impacto científico (Scientific impact); todas las disciplinas; indicadores [P, P(top 10%), PP(top 10%)]; recuento fraccionado:
        • Ordenado por número de publicaciones [P], posición - USP 12, UNAM 98
        • Ordenado por número de publicaciones en el 10% más citado [P(top10%)], posición – USP 75, UNAM 316
        • Ordenado por la proporción de publicaciones en el 10% de publicaciones más citadas [PP(top10%)], posición – USP 1083, UNAM 1299

      • Colaboración (Collaboration); ciencias Físicas y de ingeniería; indicadores [P, P(collab), PP(collab)]:
        • Ordenado por número de publicaciones en coautoría [P(collab)], posición – USP 46, UNAM 96
        • Ordenado por proporción de publicaciones en coautoría [PP(collab)], posición – USP 541, UNAM 722

      • Acceso Abierto (Open Access); ciencias sociales y humanidades; indicadores [P, P(gold OA), PP(gold OA)]:
        • Ordenado por número de publicaciones en gold [P(gold OA)], posición – USP 59, UNAM 267
        • Ordenado por proporción de publicaciones en gold [PP(gold OA)], posición – USP 308, UNAM 285

      • Género (Gender); Ciencias biomédicas y de la salud; indicadores [A(MF), A(F), PA(F|MF)]:
        • Ordenado por la proporción del número de autoras en comparación con el número de autores para los que se ha podido determinar el género, femenino o masculino. [PA(F|MF)], posición – USP 175, UNAM 293

      ¿Quién es mejor?

      Entonces, ¿qué universidad es mejor? A partir de los datos del Leiden Ranking, no podemos hacer ese juicio de valor. La mejor manera de usar el ranking es explorando las diferentes dimensiones y perspectivas, así como la información detallada de cada universidad en específico. Todo ello sin perder de vista lo que se está midiendo: el desempeño de investigación científica a partir de publicaciones en una base de datos específica.

      Como se mencionó anteriormente, el Leiden Ranking es una herramienta interactiva que proporciona diferentes dimensiones e indicadores, no análisis completos. Estos indicadores pueden ser utilizados en conjunto con otros indicadores y análisis para analizar el desempeño de una institución a partir de estrategias específicas.

      El Leiden Ranking tiene, entre sus limitaciones, basarse en datos propietarios, los cuales no cubren muchos idiomas y que no son de Acceso Abierto. En CWTS somos conscientes de estas limitaciones, es por ello que apoyamos More Than Our Rank, una iniciativa de INORMS (International Network of Research Management Societies). La iniciativa busca proveer a instituciones académicas “una oportunidad para destacar las muchas y variadas formas en que sirven al mundo, las cuales no están reflejadas en posiciones de rankings”. Los objetivos de More Than our Rank se alínean perfectamente con nuestros principios de uso responsable de rankings. Esperamos que muchas universidades y partes interesadas se unan a esta iniciativa tan importante y necesaria.

      ]]>
      Andrea Reyes ElizondoClara Calero-Medina
      The CWTS Leiden Ranking 2023https://www.leidenmadtrics.nl/articles/the-cwts-leiden-ranking-20232023-06-21T09:45:00+02:002024-05-16T23:20:47+02:00Today CWTS releases the 2023 edition of the CWTS Leiden Ranking. In this post, the Leiden Ranking team provides an update on ongoing developments related to the ranking.Universities in the Leiden Ranking 2023

      As Figure 1 shows, the number of universities in the Leiden Ranking keeps increasing. Like in the last three editions of the ranking, a university needs to have at least 800 fractionally counted publications in the most recent four-year time window to be included in the ranking. This year 1411 universities meet this criterion, 93 more than last year and 235 more than in 2020.

      Figure 1. Increase in the number of universities in the Leiden Ranking (2020-2023).


      The universities in the Leiden Ranking 2023 are located in 72 countries. Figure 2 shows the number of universities by country. China has the largest number of universities in the Leiden Ranking (273), followed by the US (206), in line with the last three editions of the ranking.

      Figure 2. Number of universities in the Leiden Ranking 2023 by country.


      Three countries previously not represented now also have universities in the Leiden Ranking. These are Indonesia (Bandung Institute of Technology, Universitas Gadjah Mada, and University of Indonesia), Cameroon (University of Yaoundé I), and Kazakhstan (Nazarbayev University).

      More Than Our Rank

      At CWTS we are strongly committed to promoting responsible uses of university rankings. Almost 20 years ago, our former director Ton van Raan was one of the first experts expressing concerns about the fatal attraction of rankings of universities. By creating the Leiden Ranking and contributing to U-Multirank, we have introduced alternatives to simplistic one-dimensional rankings. We have also developed ten principles to guide the responsible use of university rankings.

      Building on this longstanding commitment to responsible uses of university rankings, we are proud to be one of the initial supporters of More Than Our Rank, an initiative launched in October 2022 by the International Network of Research Management Societies (INORMS). By providing “an opportunity for academic institutions to highlight the many and various ways they serve the world that are not reflected in their ranking position”, More Than Our Rank is fully aligned with our principles for ranking universities responsibly (see Figure 3). We hope that many universities and other stakeholders will join this important initiative.

      Figure 3. Why does CWTS support More Than Our Rank? (Slide from this presentation.)

      What’s next - Making the Leiden Ranking more transparent

      Being as transparent as possible is one of our principles for responsible university ranking. While the Leiden Ranking offers methodological transparency by documenting its methods in considerable detail, the Web of Science data on which the ranking is based (made available to us by Clarivate, the owner of Web of Science) is of a proprietary nature and cannot be shared openly. This limits the transparency and reproducibility of the Leiden Ranking. It is also in tension with the growing recognition of the importance of “independence and transparency of the data, infrastructure and criteria necessary for research assessment and for determining research impacts” (one of the principles of the Agreement on Reforming Research Assessment).

      In the new strategic plan of CWTS, openness of research information is a top priority. Open data sources such as Crossref and OpenAlex offer exciting opportunities to produce bibliometric analytics in a fully transparent and reproducible way. We are currently working on an ambitious project in which we explore the use of open data sources to create a fully transparent and reproducible version of the Leiden Ranking. We expect to share the outcomes of this project later this year.

      Let us know your feedback and ideas

      As always, we appreciate your feedback on the Leiden Ranking and your ideas on ways to improve the ranking. Don’t hesitate to reach out!


      ]]>
      Nees Jan van Eckhttps://orcid.org/0000-0001-8448-4521Ludo WaltmanZeynep AnliClara Calero-MedinaDan GibsonMark NeijsselAndrea Reyes ElizondoMartijn VisserHenri de WinterAlfredo Yegros
      "Smart alone, brilliant together"https://www.leidenmadtrics.nl/articles/smart-alone-brilliant-together2023-05-25T15:45:00+02:002024-05-16T23:20:47+02:00Academic publishing is on the move. Dissatisfaction with the dominant publishing paradigm has given rise to a manifold of new ideas, projects and services. The time is ripe for consolidation of the most promising developments.Imagine academic publishing that is fast, transparent, and free. Is that a pipe dream or something within reach? We already have preprint publishing (fast), open peer review (transparent), and diamond/overlay journals (free). If we could connect these disparate initiatives, would that make our dream come true? And how could this best be done? These are questions that are currently being discussed by us and others at Leiden University.

      While we are proud that Leiden is the Dutch champion when it comes to preprint publishing, we realize that we cannot make this journey alone. Colleagues at other Dutch universities also bring invaluable expertise. Wageningen University, for instance, is the leading Dutch university in terms of its contribution to Peer Community In, and Radboud University is at the forefront of the national Openjournals initiative (the assertions in this paragraph are based on some elementary observations. See here). Open Science Communities are found in every Dutch university, and these communities play a crucial role in discussing new recognition and reward systems in relation to open science.

      For researchers, this plethora of new publishing options is a mer à boire. Where to start? What to do next? Is it safe? What does my funder or manager require? In the meantime, the classical publishers offer one-stop shopping: simply submit your article to our journal and we will take care of the rest. That this route is neither fast, transparent nor cheap is then often accepted, though reluctantly.

      But what if some Dutch universities would combine their efforts? We might create a publishing avenue, from preprint publishing to open peer review to dissemination via a diamond or overlay journal, facilitating further dialogue and revised versions. Persistent identifiers are the signposts along this road. Funders could recognize everyone’s contribution in this process, from author to peer reviewer to publisher. It would make predatory publishing impracticable and seriously hinder paper mills.

      If this perspective inspires you, please contact Anna van ‘t Veer, chair of the Dutch Network of Open Science Communities: OSC-NL. At Leiden University some initial discussions have already started, and in the spirit of “smart alone, brilliant together” we would love to work with colleagues elsewhere in the Netherlands to broaden this approach to the national level.

      The title of this blog post is based on the slogan “Smart alone, brilliant together”found on the Crossref website.

      Photo by Kenrick Mills on Unsplash.
      ]]>
      Anna van ‘t VeerThed van LeeuwenDan RudmannLeo WaaijersLudo Waltman
      The focal areas of CWTShttps://www.leidenmadtrics.nl/articles/the-focal-areas-of-cwts2023-05-09T11:35:00+02:002024-05-16T23:20:47+02:00In this post the directors of CWTS introduce the three focal areas of the centre. These focal areas were established on January 1, 2023 as part of the launch of the CWTS knowledge agenda 2023-2028.In a previous blog post we introduced the CWTS knowledge agenda 2023-2028. Building on this, in the current post we present the new focal areas in which CWTS organizes its activities. These focal areas address key challenges in the way science is practiced and governed, in particular challenges for which we believe our centre is uniquely positioned to make a difference and to contribute to transformative changes.

      The focal areas of CWTS

      Focal areas

      Most of our activities at CWTS take place in three focal areas: Engagement & Inclusion, Evaluation & Culture, and Information & Openness. These focal areas were launched on January 1, 2023, replacing the three research groups in which CWTS was organized until the end of 2022. While the research groups represented disciplinary traditions in science studies research, the focal areas are organized around key challenges faced by the research system. This reflects a major shift in our way of working at CWTS.

      Each focal area consists of a core group of about eight to ten senior staff members and a broader group of PhD candidates and other early-career staff members as well as visiting researchers. A focal area has a small coordinating team that includes both senior researchers and a colleague with expertise in project coordination. To benefit from synergies between the focal areas, several staff members are contributing to two areas.

      The box below summarizes the topics addressed by the focal areas. While each focal area covers a distinct set of problems, the areas are also closely interconnected. The selection of the topics addressed by the focal areas is the outcome of an intensive consultative process involving the entire CWTS team. By focusing on these topics, we aim to set clear priorities and to maximize the impact of our work. The importance of setting priorities was emphasized in the evaluation of our centre that took place last year. In its advice, the evaluation committee also identified topics that it felt may deserve more attention in the work of our centre. The suggestions made by the committee have proven very useful in defining the focal areas.

      Engagement & Inclusion

      The focal area Engagement & Inclusion aims to contribute to a more collaborative, engaged, and inclusive research system. We believe in promoting diversity and inclusion in the global scientific workforce, and in recognizing the essential role that communication and co-creation of scholarly activities play in strengthening such a diverse system. The focal area approaches these questions through strategic ambitions around the three pillars of the CWTS knowledge agenda: understanding, intervening, and practicing. Examples of such ambitions include improving our understanding of the role of epistemic diversity in knowledge creation, developing policy recommendations for more inclusive and diverse academic careers, and taking more proactive measures to co-create our own activities with a larger variety of societal stakeholders (e.g., NGOs, educational organizations, and citizens).

      Evaluation & Culture

      The focal area Evaluation & Culture is concerned with the many different ways in which research is evaluated, for instance through assessment of research institutions and individual researchers, and through peer review in publishing and funding contexts. Recognizing the mutual shaping of research and research evaluation, we are committed to promoting forms of evaluation that are suited to diverse knowledge making practices and that foster healthy and inclusive academic working environments. The focal area combines activities in the understanding, intervening, and practicing pillars of the CWTS knowledge agenda. We want to better understand how research evaluation in its many forms conditions research agendas, notions of quality, and daily practices of research and scholarly communication. In addition, we aim to use our insights to promote positive change, for example by advising institutions like universities and funding bodies on how to organize evaluation for epistemic and social inclusivity, diversity, and openness. Lastly, we aim to practice our values by constantly reflecting on how we do evaluation in our immediate working environment.

      Information & Openness

      The focal area Information & Openness is concerned with studying and advancing openness of research information, such as information about the activities and outputs of researchers and research institutions. We believe that openness of research information can play an important role in fostering responsible research assessment practices and promoting global inclusiveness in science. The activities of the focal area revolve around the understanding, intervening, and practicing pillars of the CWTS knowledge agenda. We aim to develop a deep understanding of the open research information landscape and to monitor the openness of research information. We also intend to develop initiatives that promote openness of research information as the norm for scientometric analyses. In addition, we are putting the use of open research information into practice in our own work. The work of CWTS will increasingly be based on open rather than closed research information, making our work more transparent, reproducible, and inclusive.

      Strategic ambitions

      The focal areas are currently developing strategic ambitions for the period 2023-2028. Each focal area organizes its strategic ambitions in three pillars:

      • Understanding: Ambitions that focus on developing a deeper understanding of the problems addressed in the focal area.

      • Intervening: Ambitions that contribute to improving the research system, for instance through Horizon Europe projects, products and services of CWTS BV, and also through training, advocacy, and contributions to policy making.

      • Practicing: Ambitions that contribute to improving our own way of working at CWTS (‘practice what we preach’).

      While a research centre may traditionally be expected to focus primarily on understanding, for our centre intervening is of equal importance. As discussed in our previous blog post, the mission of CWTS is to improve how science is practiced and governed and how it serves society. Realizing this mission requires us to invest our efforts both in understanding and in intervening. In addition, recognizing that we are part of the research system ourselves, we also feel a special responsibility to improve our own way of working by practicing what we preach, for instance in areas such as open science and recognition and rewards.

      At the moment the focal areas are working hard to finalize the development of their strategic ambitions in the understanding, intervening, and practicing pillars. They expect to announce their plans in the coming months.

      Next steps

      The focal areas, along with new ambitions in the understanding, intervening, and practicing pillars, represent a major change in our way of working at CWTS. The full implementation of these key elements in the CWTS knowledge agenda 2023-2028 will take time. We therefore see 2023 and 2024 as a transition period in which the knowledge agenda will be further elaborated and fine-tuned and in which the introduction of a new way of working at our centre will be completed.

      We expect that the Leiden Madtrics blog will be used to provide further updates on the development of the knowledge agenda and the focal areas. Keep an eye on future blog posts!

      We thank the focal area coordinators for preparing the brief descriptions of the focal areas presented in this blog post.

      ]]>
      Sarah de RijckeLudo WaltmanEd Noyons
      Introducing the CWTS knowledge agenda 2023-2028https://www.leidenmadtrics.nl/articles/introducing-the-cwts-knowledge-agenda-2023-20282023-05-09T10:45:00+02:002024-05-16T23:20:47+02:00On January 1, 2023 CWTS launched its new knowledge agenda, a strategic plan for the centre for the period 2023-2028. In this post the directors of CWTS introduce the new knowledge agenda.Academic research has become increasingly complex, multidisciplinary, collaborative, and transnational. The institutions that underpin research - including communication and evaluation systems - are trying to keep up, with varying levels of success. At the same time, our society is facing major challenges, including existential global health, welfare, and sustainability issues. Obtaining solid evidence-informed solutions to address these challenges requires a research system that encourages collaboration between researchers and with societal stakeholders, that values intellectual curiosity, outside-the-box thinking, and a diversity of perspectives, and that stimulates open sharing of results. It also requires a research system that reflects on its own role in society and its own shortcomings. This is the research system that we, at CWTS, want to help create.

      In the coming six years, CWTS will operate under the heading of a new high-level strategic plan. In this blog post we share the purpose and mission of this new knowledge agenda. Our knowledge agenda replaces the research program Valuing Science and Scholarship that we have been working on between 2017 and 2022.

      Not another research program

      Whilst it is common for research institutes at Dutch universities to have a research program, over the past years we began to feel the limits of a framing that prioritizes research and leaves less room for other important activities. Instead, we wanted our new strategy to embrace all our activities, from our fundamental research to our tool development, and from our interventions in policy and education to our consultancy and contract work. The term knowledge agenda is intended to communicate this inclusive ambition. It describes the mission we will work on, the collective values we will uphold, and the strategic topics we will address.

      Mission

      In the lead-up to this new knowledge agenda, we spent a considerable amount of time in 2022 discussing with the entire CWTS team the mission and values of our centre. We also organized two retreats that included brainstorming sessions with academic partners and other stakeholders and even offered an opportunity to develop dream projects. And finally, we worked on defining focal areas for our institute and developed a new organizational structure around these focal areas. We will introduce these focal areas in a next blog post.

      Knowledge agenda


      Together, we came up with the following mission statement for our centre:

      Our mission at CWTS is to improve how science is practiced and governed and how it serves society

      To realize this mission, we aim to develop a deep understanding of the dynamics of scientific knowledge production, based on in-depth engagement with a broad range of scientific and societal stakeholders. We also aim to contribute to reforms in research assessment, adoption of open science practices, changes in research cultures, and innovations in research analytics. Moreover, recognizing that we are part of the research system ourselves, we strive to practice what we preach and to lead by example.

      Values

      In our new knowledge agenda, we are trying to adopt a more explicitly value-led framework that aims for congruence between the knowledge we create, our own research culture, and our internal governance mechanisms. The goal of ‘practicing what we preach’ is to foster a positive culture at our centre, not only stemming from our knowledge about the research system, but also born from and carried by the CWTS community. To incorporate a more active reflection on our own values into our strategy, we collectively developed four core values to guide our work and decision-making:

      • Transformative. We want to make a difference by inciting transformative changes in the way science is practiced and governed and the way it serves society.

      • Evidence-informed. We value evidence-informed work and policy-making. We collect scientific evidence and act on it, but we also acknowledge its limitations. Scientific evidence offers essential insights for improving how science is practiced and governed, but these insights are always tentative and dependent on context.

      • Collaborative. We value collaborative work. To address the complex challenges faced by science and society, we prefer to collaborate rather than compete, both internally within our team and with external stakeholders. We cherish a diversity of perspectives and strive for a balanced representation and recognition of everyone’s interests and contributions.

      • Responsible. We promote more responsible ways of practicing and governing science, for instance by making research processes more inclusive, research evaluations more fair, and research analytics more transparent. We practice what we preach by making our own way of working more responsible.

      The coming years

      The CWTS knowledge agenda 2023-2028 is intended to be an encompassing, high-level, and value-led strategic plan. It is meant to focus our efforts at a time when pushes for reform in research assessment and the increased need for openness in research practices provide us with a unique opportunity to contribute to a stronger and healthier research system. Among other things, we plan to consider how research evaluation in its many forms conditions research agendas, notions of quality, and daily practices of research and scholarly communication; how strategic and meaningful public engagement can become integral to realizing the value and relevance of academic research; how policy recommendations for more inclusive and diverse academic careers can be developed; and how structural inequities and lack of diversity and inclusion in global science can be better understood and addressed. Tackling these and other questions requires joint action by many different stakeholders in the research system. With our new knowledge agenda, we hope to meaningfully contribute to this in the years to come.

      ]]>
      Sarah de RijckeLudo WaltmanEd Noyons
      The Journal Observatory - Connecting information on scholarly communicationhttps://www.leidenmadtrics.nl/articles/the-journal-observatory-connecting-information-on-scholarly-communication2023-05-01T11:02:00+02:002024-05-16T23:20:47+02:00As scholarly communication is getting more diverse and transparent, there is an increasing need for reliable information on platforms’ policies. The Journal Observatory project aims to connect existing data and build toward systematic high-quality information on scholarly communication platforms.The scientific community is moving towards a more transparent way of conducting and reporting research. Scientific publications are becoming more and more openly accessible but openness should also extend to peer review, preprinting, preregistration, data sharing, metadata availability, and related issues.

      Research funders and other stakeholders are putting a significant effort into promoting open science practices in scholarly communication. But there is a lack of high-quality infrastructure that provides information on the openness, policies and procedures of scholarly journals and other publication outlets. Consequently, it can be challenging to answer questions like: how do journals organize quality assurance and peer review? How do journals support open access publishing? How do journals or preprint servers support preregistration, preprinting, and data sharing? How diverse are the editorial teams of journals?

      This information can be crucial to multiple stakeholders:

      Researchers

      Publishers

      Funders, research institutions and libraries

      All stakeholders

      need this information to decide which journals to engage with as reader, author, reviewer, or editor.

      need this information to advertise the distinctive features of their journals, to demonstrate the investments they make in their journals, and to attract readers, authors, reviewers, and editors.

      need this information to inform negotiations with publishers, to support the development of publication policies, and to assess and reward the compliance with these policies.

      will benefit from high- quality information to explore, assess and develop novel publication and review models.

      The Journal Observatory project aims to contribute to making available the information needed by these stakeholders.

      The current landscape, and its shortcomings

      There are numerous initiatives and platforms providing some part of the puzzle, but information is scattered, incomplete, and difficult to compare. For example, tools and databases are available that help researchers understand how to make their research openly accessible (DOAJ), whether their work can be posted in a repository or on a preprint server (Sherpa Romeo), how to ensure compliance with funder requirements (Plan S Journal Checker Tool), and how to pick a publication platform that offers particular peer review approaches (Transpose), open science practices (TOP factor), or that is considered to have a sufficiently high citation impact (Journal Citation Reports).

      Given this complexity, it seems unrealistic to expect stakeholders to know which tools or databases to use to obtain specific information.

      As new models of publishing such as Publish-Review-Curate, publication as you go, preprint review and others emerge, distinct publishing functions like dissemination and evaluation are increasingly decoupled. This creates the need for different platforms to interact and at least to be aware of each other’s policies and requirements. At present, there are minimal standards to enable the systematic interoperability of these platforms. At the research output level, standards like DocMaps and the COAR Notify protocol are under development. However, to empower further innovation in scholarly communication, a shared way to describe these different platforms and their possibilities of interaction is required.

      The Journal Observatory project: aims and approach

      To address this challenge, our project aims to:

      1. define an extensible, machine-readable and traceable way to describe the policies and practices of the various platforms involved in disseminating and evaluating scholarly works: the Scholarly Communication Platform Framework

      2. demonstrate the value of this new framework by building a demonstration prototype called the Journal Observatory, a resource which combines data on journals and other publication platforms from various sources to clarify policy information for authors, reviewers and others.

      1. Scholarly Communication Platform Framework

      The Scholarly Communication Platform Framework is a new, high-level, structured language that enables the exchange of information about platforms for scholarly communication. To date, we have focused on enabling description of platforms for the dissemination and/or evaluation of research articles, such as scientific journals, preprint servers, and peer review platforms. However, the Framework can fairly easily be extended in the future to describe platforms performing other scholarly communication functions (e.g., archiving via platforms like LOCKKS/CLOCKKS or Portico), or to describe dissemination/evaluation of other types of scholarly outputs (books, datasets, software, code, methods, materials). The detailed inner-workings and rationale of the Framework are described in our technical report. Documentation and source code can be found on the project’s webpage.

      2. Journal Observatory prototype

      The Journal Observatory prototype is a proof-of-concept demonstrator which integrates journal information from diverse open data sources including DOAJ, Sherpa Romeo and others, as well as directly from publishers. It shows the power of combining information from these different sources to support three primary use-case areas: open access publishing, preprinting and peer review procedures. By making this information available, we support researchers, publishers, funders and research institutions to make informed decisions and monitor compliance. The prototype comes both with interfaces for machines and with a user-friendly web interface for humans. There are two interfaces for machines: a SPARQL endpoint and a REST API. The web interface for humans is provided by the Journal Observatory Browser. More information about the prototype, including documentation and source code, can be found on the project’s webpage.

      The Journal Observatory

      Next steps

      The Journal Observatory project has achieved much within a limited timeframe and with limited resources. We see our project and its outputs as the start or continuation, not the end, of a much larger conversation. We hope our work will provide a base for a more ambitious long-term agenda, co-shaped with the wider scholarly community, and aimed at working toward open and interoperable infrastructure for providing systematic and reliable information on scholarly journals and other scholarly communication platforms.

      The community event

      To mark the end of the project and to launch the project’s results, we organized an online community event on April 25. During the event, we presented our work, including a live demo of the Journal Observatory Browser to show how the tool can support users in efficiently finding answers to questions like: what journals in my field (e.g. sustainability research) provide options for Diamond Open Access publishing? How do the preprinting policies of two journals compare? What journals in my field adhere to Open Peer Review, in the sense of publishing review reports?

      The demonstration was followed by Lucy Ofiesh’s (Director of Finance & Operations at Crossref) talk on the Principles of Open Scholarly Infrastructure (POSI). Lucy described how these principles, developed as a community resource to help guide organizations, can support the resilience and sustainability of open infrastructure that serves the scholarly communications ecosystem.

      The event was concluded by a panel discussion in which three of the project’s stakeholder advisory board members discussed their perspective on the need and future of interoperable, systematically-collected information on scholarly communication platforms. Johan Rooryck (Executive Director of cOAlition S), Catriona MacCallum (Director of Open Science at Hindawi Publishing) and Gabe Stein (Head of Operations and Product at the Knowledge Futures Group) shared their view from the perspective of a research agency coalition, publisher and infrastructure provider, respectively. They agreed that there is a dire need for the kind of service provided by initiatives like the Journal Observatory project, but also identified several challenges on the road towards sustainability of such initiatives.

      The recording of the event can be watched here.

      Get involved!

      We call upon all within the scholarly communications community to work collaboratively to advance these aims. If you are interested to discuss potential collaboration with us or have ideas about how to take this forward, please contact us via Ludo Waltman, Journal Observatory project lead.

      Acknowledgement

      The Journal Observatory project was supported by the Open Science Fund of the Dutch Research Council (NWO).

      We thank Melanie Imming and Mathijs van Woerkum (im-studio) for their contributions to the illustrations in this blogpost and all members of our stakeholder advisory board for their valuable input to our project.

      ]]>
      Bram van den BoomenNees Jan van Eckhttps://orcid.org/0000-0001-8448-4521Ludo WaltmanTony Ross-HellauerSerge Horbach
      Industry involved in research: The case of Latin America and the Caribbeanhttps://www.leidenmadtrics.nl/articles/unlocking-the-research-fronts-of-industry-and-research-institutions2023-04-13T10:30:00+02:002024-05-16T23:20:47+02:00Collaborations between industry and research institutions are a common phenomenon in science. But what does the situation look like in Latin America and the Caribbean? In a recent study, our author took a closer look and identified central as well as less prominent research areas.Industry-University partnership is now part of the governance canon of higher education. However, the multiple forms this type of partnership can adopt are not so clear for every junior-faculty, administrators, and from there to the top-management in the higher education sector. In addition, the landscape of Industry-University partnerships can get fuzzy — not to mention difficult — given the scarce resources dedicated to research and development in middle and low-income countries.

      Take Latin America and the Caribbean as an example. There are no Latin-American companies listed in Clarivate's Top-100 Global Innovators. In addition, as of 2022 there are only two companies ranked in the SCImago Institutions Ranking, which assesses institutions worldwide in terms of research performance, innovation output, and societal impact. Those companies were Petrobras and Estacio Participacoes AS. Petrobras is one of the largest companies in the petroleum industry in the region, while Estacio Participacoes focuses on private educational services in Brazil.

      Given the absence of Latin-American private organizations in the global innovation sphere, it is both relevant and urgent to identify highly strategic research fields in regions with restricted financial resources and underdeveloped industry ecosystems. For instance, in 2019 the average research and development expenditure in the region was a mere 0.7%. Also, it is of high value to map research fields still-to-be-explored-and-exploited via Industry-University partnerships.

      Mapping the research-fronts of industry in Latin America and the Caribbean

      In a study published in the Journal of Information Science, I identified highly strategic research-fronts for both industry and research intensive institutions, universities among them, in Latin America and the Caribbean. I applied a technique used to establish interconnections and clustering between knowledge domains. This technique is called bibliographic coupling.

      The bibliographic coupling approach enables us to examine the underlying structure of the knowledge required for researchers to produce new knowledge. This technique is quite versatile. It can process highly multidisciplinary amounts of research documents, such as research on the Sustainable Development Goals or the complete set of articles published in the journal Nature in 150 years of history.

      The approach for coupling two documents is straightforward. See the figure below this paragraph. Let's suppose that I'm writing an article on biotechnology (A, in Figure 1), and you, the reader, are writing an article on bioeconomy (B, in Figure 1). We do not know each other. However, we found an interesting article or any other type of scholarly communication such as a book chapter, policy paper, and the like, on thebioeconomy of biotech (C, in Figure 1). Now, we read and assess that scholarly communication, and decide to include it in our own study. We cite it and by that common citation our documents are now connected. The same applies to the fields of research of publication A and B: Because of A and B being connected, biotechnology and bioeconomy now share a link as well.

      In this first step, the bibliographic coupling detects the shared references between research articles to interconnect them. Then, in a second step, it is also feasible to interconnect the research field of the journals in which those articles were published, thereby assembling a network of research fields based on the research articles coupled.

      Bibliographic coupling II
      Figure 1. Bibliographic coupling.

      I applied this process to a sample of 13,000+ research articles indexed in the bibliographic database Scopus. The articles sourced had to be coauthored by at least one author affiliated with an institution in Latin America and the Caribbean — either public or private —, and the same author or another coauthor affiliated with a private organization in any other country.

      As I previously mentioned, the bibliographic coupling enables us to interconnect the research articles produced with industry collaboration and the underlying structure of the knowledge required for their development. Once these articles and the academic journals in which they were published were identified, I use the research fields' classification of the journals to assemble a research field network as follows.

      Each academic journal indexed in Scopus receives a classification to a single or multiple research field based on the All Science Journal Classification system. There are over 330 research fields, categorized into five areas, namely physical sciences, life sciences, health sciences, social sciences & humanities, and multidisciplinary. In consequence, if two articles connected via bibliographic coupling were published in a journal with two classifications such as biotechnology and bioengineering, and a second journal with a single classification in molecular medicine, the research field network based on these two journals is composed by three interconnected fields: biotechnology, bioengineering, and molecular medicine.

      Also, I calculated betweenness centrality, an indicator for each research field that unveils its strategic position within the network. Figure 2 shows the network layout with the research-fields with high strategic position, proportional to the size of the nodes. Also, it shows the time of the first publication of a given research-field.

      Research fronts III 880
      Figure 2. Industry research fronts. Note: nodes proportional to their betweenness centrality score. Based on Julián D. Cortés (2023), "Industry-research fronts – Private sector collaboration with research institutions in Latin America and the Caribbean".

      Physical science, the most active. Multidisciplinary, the most strategic

      Results showed that multiple research-fields from different research areas were active in industry-research collaborations (further on called industry research fronts). Physical science had the most active role. The least active role went to social sciences and humanities.

      The research area of physical science with fields such as computer science applications, information systems, electrical & electronic engineering, energy engineering and power technology took about ~38% of the total nodes of the network. Health sciences made up 23% of the nodes. In this area, we can find research-fields such as public health, environmental and occupational health, or general medicine. For the case of life sciences, an area with ~19% of the nodes, we can find research-fields such as genetics, pharmacology, or agronomy and crop science. Finally, for social sciences and humanities, with ~18% of the fields, we can find fields such as strategy and management, geography, planning and development, or economics and econometrics.

      Despite having just one node in the network, the area of multidisciplinary research had the highest betweenness centrality. Multidisciplinary research was mostly published in scientific journals such as PLoS ONE. According to this journal, they accept: "over two hundred subject areas across science, engineering, medicine, and the related social sciences and humanities." Therefore, it is quite difficult to dimension multidisciplinary research as a single research front, despite its highly strategic position in the research fronts network. More so, to outline specific recommendations and a plausible course of action to follow through the Industry-University partnership. 

      Uncharted research-fronts

      Through recognizing research fronts, I could determine which research-fields had yet to be explored or exploited by industry-institutions. Most of these research-fields were from health sciences, such as emergency medicine, care planning, or optometry, followed by fields in the social sciences and humanities, such demography or life-span and life-course studies.

      Here lie plausible interconnections between the aforementioned uncharted fields. For instance, the number of US citizens aged over 65 is projected to double by 2060. Is it a tangible research front plausibly formed by care planning and demography? Is it a potential research front for industry-research institutions in Latin America and the Caribbean?

      What I have discussed here could be of great use to industry and research institutions. As a first insight, both parties can identify mature and emergent research fronts and assess how strategic their research capacities are amid the bibliographic network structure. Second, they can identify research fields clustered nearby and gauge how likely or attractive it might be to delve into different fields. Finally, parties can see more clearly which research fields are still unexplored by joint efforts between research institutions and industry. Further studies could also source other types of research institutions and industry knowledge outputs such as patents and patent-citation data to expand industry and research institution endeavors.


      Header image: Laurel and Michael Evans on Unsplash

      ]]>
      Julián D. Cortés
      Open Science Knowledge Platform: A Journey to a Dynamic Resourcehttps://www.leidenmadtrics.nl/articles/open-science-knowledge-platform-a-journey-to-a-dynamic-resource2023-03-16T11:32:00+01:002024-05-16T23:20:47+02:00In 2022, CWTS held a series of open science seminars together with the Research Councils of The Netherlands (NWO) and Norway (RCN). Now, all resources from the seminars are available on a new Open Science Knowledge Platform. This blogpost reflects on building this platform and next steps to come.Open science has gained significant momentum over the past few years, with various movements and initiatives emerging to promote sharing of scientific knowledge, data, and resources with the wider community. Open science is a broad term encompassing a range of practices that strive to increase transparency, inclusivity, and accessibility in science. The expected benefits of open science are manifold, from accelerating scientific progress, enhancing scientific rigour, promoting responsible research, and ensuring public trust in science.

      With that in mind, the research councils of the Netherlands (NWO) and Norway (RCN) joined hands with CWTS to organize a seminar series on open science throughout 2022. The seminars aimed to enrich and expand the understanding of open science within the agencies, focusing on programme and policy officers and connected professionals interested in the subject.

      Aware of the challenges to reaching all those interested within NWO and RCN, we decided to create a knowledge platform to store and share the content from the seminars so they could be attended asynchronously. Moreover, recognizing the value of the produced content to a broader audience, we decided to put the idea of openness into practice, making the platform open to the public.

      The knowledge platform

      The knowledge platform features videos from the seminar series presentations, including lectures from Thed van Leeuwen, Ludo Waltman, Wolfgang Kaltenbrunner, and myself. Open science champions, as we call the many experts that shared experiences and their perspectives with our audience, are also there. Additionally, the platform includes support materials, access to the slides used in our presentations, links to relevant resources and literature, and more.

      The seminar series consisted of four individual seminars, included as different sections in the platform. Each one of them covered specific aspects of open science:

      Introduction to open science

      The first seminar provided an overview of the complexity of open science as more of an umbrella term than a well-defined concept. From that perspective, open science refers to a series of movements to remove barriers to sharing any scientific output, resources, methods, or tools and bringing scientific results closer to the general public. Through a series of examples, we adopted the model of five schools of thought proposed by Fecher and Friesike (2014) to understand open science in its multiple dimensions, from being democratic to its role in recognition and rewards.

      Open scholarly communication

      The second seminar delved into open scholarly communication. It covered topics such as open access publishing, article processing charges (APCs), Plan S, pre-printing, and open peer review. The seminar also covered newer forms of scholarly publishing, with diverse levels of openness, and the transition towards a more democratic future in science.

      Open data, software and infrastructures

      The third seminar focused on aspects connected to the infrastructure school of open science, including open data, how to make data FAIR (Findable, Accessible, Interoperable, and Reusable), and data management plans, as well as recent developments in the sharing of code and software. The seminar also covered necessary infrastructures for open science, such as repositories.

      Recognition & rewards and responsible research assessment

      The fourth seminar approached an important ongoing development in the academic world, connecting openness to issues related to recognition & rewards and responsible research assessment. The seminar covered the current state of those issues and the challenges that arise from them. It also discussed responsible research assessment, the development of national matrixes for career assessment, the movement towards adopting narrative CVs, and the importance of transparency and reproducibility in open science.

      Next steps

      To call something a knowledge platform is undoubtedly ambitious. Our four open science seminars were designed to introduce fundamental concepts and to put these in the context of ongoing policy initiatives. We recognize there is still much more to explore, so we built the platform to be updated and expanded. In this way, new topics can be added to follow the development of open science and enrich the platform's content.

      For instance, at CWTS, we already plan to delve into topics such as the open science pillars proposed by the UNESCO Recommendation on Open Science and the convergence of open science and Responsible Research and Innovation (RRI). We are also interested, for instance, in learning from the Global South's efforts in the diamond open access model over the past two decades.

      We also welcome contributions from new open science champions, as the platform is open to growth and development. If you would like to be part of this effort, please reach out to me. Launching the open science knowledge platform is a first step to something bigger, to a dynamic resource that evolves, reflecting the constantly changing nature of open science.

      Reflections on a co-creation process

      The journey to prepare our seminar series and organize the contents into a knowledge platform has been quite interesting and rewarding. While we had the chance to debate the state of the art of open science within CWTS, we had to build a practical program that could be valuable to those working with the topic at different levels, including funding, evaluation, and policy design. That was a mission accomplished by adopting a co-creation perspective with our partners at NWO and RCN. So, we very much like to thank Maria Cruz, Anthony Gadsdon, Marte Qvenild, and Christian Lund not only for fruitful discussions around the program and the outcomes, but also for an active partnership in every seminar.

      Furthermore, it’s also quite important for us to thank our champions. Early in the design of the seminar series, we decided to invite additional experts to contribute with their own ideas, perspectives, and experiences on open science. The nine champions that joined us have expanded our own understanding on open science and helped us create a much more comprehensive seminars than we would be able to do alone. So, we also extend our thanks to Sonja Grossberndt, Sanli Faez, John Arne Røttingen, Anne Scheel, Anna van’t Veer, Marjan Grootveld, Korbinian Böls, Kim Huijpen, and Alexander Jensenius.

      And with that, see you at the Open Science Knowledge Platform!

      Header image by Patrick Tomasso on Unsplash ]]>
      André Brasil
      Narrative CVs: a new challenge and research agendahttps://www.leidenmadtrics.nl/articles/narrative-cvs-a-new-challenge-and-research-agenda2023-03-15T10:45:00+01:002024-05-16T23:20:47+02:00Narrative CVs allow researchers to offer contextual accounts of their career. Ideally, they bring about more inclusive forms of research evaluation. In this collective blog post, we report on a 5-day workshop organized to reflect on narrative CVs and the many questions and opportunities they raise.Most researchers will only think of their Curriculum Vitae (CV) when an application deadline is nearing. Yet a recent wave of initiatives to introduce so-called narrative CV formats by research funding bodies and universities across Europe have created debate about the affordances of an otherwise taken-for-granted bureaucratic genre. Narrative CVs are meant to tackle a widely perceived problem in relation to the use of traditional CV formats in research evaluation, namely an overemphasis on publication- and funding-centric quality criteria, and indicators such as the h-index, lifetime citation counts, or journal impact factors. There are concerns that such information is used to reduce complex comparative assessments in peer review to simple quantitative tallying, and many fear that this will undermine true innovation and openness of academic career systems. When recognition and reward are too narrowly conceived and based on quantitative tallying, broad swathes of academic workers end up feeling undervalued or not able to play to their strengths, which in turn means waste of talent, a less robust/diverse academic system, and persistent inequalities and hierarchies.

      Visual CV, created by Mollie Etheridge.

      Narrative CVs instead supplement traditional types of biographical information with narrative elements through which researchers can tell more contextual stories about their background/ career/ career motivation. Ideally, narrative CVs can help diversify criteria of success and achievement in research, thereby also diversifying the scientific workforce and creating more openness for “irregular” career trajectories.

      Against the backdrop of these debates, we organized a 5-day workshop at the Lorentz Center in Leiden in December 2022 to bring together different academic stakeholders (including researchers, funders, policy makers, and administrators) to reflect on these and other new developments in CV territory. In this post we share some of our main insights. Urgent short-term goals include the need for getting a better sense of the extent to which narrative CVs can be effective in addressing the above-mentioned issues, and which practical conditions must be met for them to achieve their potential. In the medium- to long run, we should ensure that current narrative CV formats are part of a coordinated broader strategy to foster inclusive practices in research evaluation.

      Historical convergence vs a new diversity of CV formats

      Narrative CV formats can be seen as merely the latest development in the evolution of the genre. Research on the morphology of CVs has for example shown that in the humanities in Germany, a narrative format has been gradually replaced by a tabular format during the second half of the 20th century. More research would be needed to substantiate how representative these findings are for CV practices in other fields and countries. Yet overall, we can safely assume that CV formats have tended to converge in recent decades, following a relatively universal structure based on a range of categories of achievements.

      The standardization of formats is in many ways productive. For example, it has made it possible to create overarching digital infrastructures for creating and handling CVs that can also then be reused for specific application purposes. During the workshop, we organized an open source data mining session that drew on the ORCID database, which contains a wealth of biographical profiles by researchers that can be used to interrogate empirical questions about academic career systems and academic dynamics. At the same time, it is exactly the uniformity of CV formats that current narrative CV initiatives and other critical observers of research evaluation systems take issue with, since it exerts a form of normalizing power on researchers that ultimately urges them to develop their careers around a rather narrow range of categories of achievement.

      Visual CV, created by Sarah de Rijcke.

      The narrative CV templates recently introduced by funders and universities in turn are characterized by a diversity in structure and format. At the workshop, we took a particularly close look at CV formats used by organizations who were also represented at our event, which included the Luxembourg National Research Fund (FNR), the Swiss National Science Fund (SNSF), and the Research Council of the Netherlands (NWO). The formats of the Swiss, Luxembourg, and Dutch research councils all ask for some narrative of the trajectory and scientific accomplishments of a researcher. The Swiss format requires up to three shorter narratives, while the Luxembourg CV requires applicants to submit a personal statement and a personal profile. The format used by the Dutch research council in turn is tailored to different career stages, with applicants for more advanced funding programs being asked to include an account of their leadership expertise in the narrative. Even the very term narrative CV is not fully agreed-upon. Rather than creating a sharp distinction between narrative and non-narrative, most organizations adopting such formats aim for a hybrid document that combines more traditional list-based information with narrative elements. One could also argue that interpreting any kind of CV formatalways requires an effort at narrativization, so as to translate a list of achievements into a trajectory that makes sense to human evaluators. These points, as well as the current variety in novel CV formats, caution us not to think of narrative CV formats as a singular new paradigm replacing existing conventions. Nevertheless, we will in the following present some overarching questions that are pertinent to most if not all narrative CV formats.

      Evaluative use of narrative CVs

      A basic assumption that seems to underpin narrative CV initiatives is that changing the way information is presented to reviewers will also change evaluation practices such as the issues discussed in review panels. Yet this seems a rather strong supposition. If we think of peer review not simply as a mechanism for objectively comparing information about applicants but as a practice that is learned through socialization in academic communities, then we should assume that making use of the affordances of novel CV formats is not something that comes overnight. Instead, we should perhaps expect a gradual process in which researchers become familiar with the new format and make progressively more use of its features. Empirical investigation into this may be useful, e.g., how do panel members actually negotiate and interpret evaluative criteria when using narrative CV formats? Do such practices change over time? In the short term, detailed empirical studies that compare how review panels shortlist and select candidates when presented with narrative and traditional CVs would be desirable (see here for a pertinent ongoing research project carried out at Cambridge University).

      There may also be inadvertent risks in broadening the biographical information that is given as input for reviewers. First, it may be that sociocultural biases have a higher chance of coming to the fore. Imagine a scenario where sharing personal details such as sexual orientation, age, ethnic origin or simply particular life choices predispose reviewers for or against the author of the CV. Relatedly, reviewers may be inclined to evaluate those stories that resemble their own more positively, a phenomenon often studied under the name of homophily. Both bias and its specific form of homophily risk undermining ongoing attempts to foster diversity, equity, and inclusion in academia. The potential effects of bias and homophily may potentially be mitigated by unconscious bias training, or by assuring reviewer panels are sufficiently diverse in terms of gender, ethnic origin, nationality and career stages. Again, empirical research on these questions would be desirable. Do bias and homophily occur less or more often when using narrative CVs? Are reviewers more likely to call each other out on bias and is unconscious bias training a suitable answer? Alternatively, can panels better deal with biases if they cultivate a practice making implicit biases explicit?

      Visual CV, created by Annemijn Algra.

      Crafting narratives

      A whole other set of unresolved questions arise even before evaluation, namely in the practice of crafting a narrative. During the workshop, we adopted a very broad perspective on representing oneself as an academic, even experimenting with the use of AI-generated visualizations in CVs that resulted in a live exhibition hosted by artists Ruud Akse and Zwaan Ipema in the art space NP3 in Groningen (the images in this blog post have been created during that session). While narrative CV formats currently abstain from any visualization elements, they do create the possibility to frame academic work in ways that highlight different dimensions of contributions. For example, this potentially allows for focusing also on desirable but usually somewhat undervalued aspects like actively practicing Open Science, communication and engagement with society, teaching, or exerting leadership in innovative ways. And while narrative CVs focus on individual researchers, they principally allow for new ways of showing how individual researchers contribute to collaborative work – for example, by giving space to account for community-building work that does not lead to publications and would normally remain invisible. At the same time, the practice of crafting a narrative is also related to sociological power dynamics, for example to the command of cultural capital, which is unequally distributed across researchers in terms of demographic dimensions such as age and social origin. Crafting narratives after all requires much more tacit knowledge about "how to present yourself" than a standardized tabular format. In addition, crafting narratives may come easier for some personality types than others.

      The prospect of writing a narrative also raises the question of how coherent the biographical account should be. Our workshop featured a group work session chaired by Catelijne Coopmans in which we took a critical look at academic career advice. Academic career advice resources often appear to help reproduce rather traditional assumptions about what it means to be a successful researcher. One of the takeaways was that the cost of conforming to perceived or real career requirements can be high, both to building viable livelihoods and to health and wellbeing. Many researchers still work under the assumption that the goal of doing academic research is to become a professor, while other career paths are perceived as a form of failure. In reality, “irregular” trajectories may not just lead to more professional fulfillment on the side of the researcher, but may also have unexpected benefits for society (e.g., when academics engage or contribute to industry, social organizations, or government). The narrative CV in principle allows for showcasing diverse trajectories through academic research, for example in the sense of creating room to document experience working in other fields, professions, or experimenting with novel methods.

      A final important concern is of course the time required to craft and evaluate narratives, which will often be significant. One way of reducing this work is to aim for a degree of harmonization of formats across organizations. Led by the Royal Society, efforts to achieve this are already underway in the UK. A related risk is that narrative CVs could turn into a new business opportunity for hired consultants, specialized in crafting catchy narratives. The attempt to “optimize” narrative CVs for particular funding opportunities through such professional support would seem to undermine the intention of using new formats to increase the informational value of CVs, and of course it would raise questions about who has or does not have access to the necessary resources for such support. Time will tell how researchers will adapt to narrative CV formats, and it may be that a critical assessment or change of direction will be required in a few years’ time.

      Visual CV, created by Björn Hammarfelt.

      A holistic perspective is needed

      As this reflection on some of the key themes that came up during the workshop shows, there are lots of opportunities but also uncertainties related to the recent wave of narrative CV initiatives. What is perhaps most interesting about it is that the current moment stimulates reflection on practices of research assessment that are usually taken for granted. We might say that experiments with novel CV formats function as a sort of sociological breaching experiment, where the fundamentals of our conventional mechanisms for distributing science funding and academic hiring are put up for discussion. The breadth of the questions we raise in this short essay in any case prompts us to avoid thinking of the introduction of new CV formats as a panacea. CV formats are just one element - albeit a particularly important one - in a broader set of practices of research assessment. Addressing the foundational problems that narrative CV formats are meant to solve will require an empirically and conceptually well-understood view of the self-reproduction of the scientific career system - both in terms of how researchers plan their careers and present themselves strategically for assessment purposes, and in terms of the practical functioning of research evaluation, as well as the science system as a whole.


      The authors of this blog post: Wolfgang Kaltenbrunner, Tamarinde Haven, Annemijn Algra, Ruud Akse, Francesca Arici, Zsuzsa Bakk, Justyna Bandola, Tung Tung Chan, Rodrigo Costas Comesana, Catelijne Coopmans, Alex Csiszar, Carole de Bordes, Jonathan Dudek, Mollie Etheridge, Kasper Gossink-Melenhorst, Julian Hamann, Björn Hammarfelt, Markus Hoffmann, Zwaan Ipema, Sarah de Rijcke, Alex Rushforth, Sean Sapcariu, Liz Simmonds, Michaela Strinzel, Clifford Tatum, Inge van der Weijden, & Paul Wouters.


      Header image by Mike Erskine on Unsplash.

      ]]>
      Reconnecting in person: My account of the STI 2022 conferencehttps://www.leidenmadtrics.nl/articles/reconnecting-in-person-my-account-of-the-sti-2022-conference-and-expectation-to-sti-20232023-02-22T10:30:00+01:002024-05-16T23:20:47+02:00The STI 2022 conference held in Granada was my first large face-to-face conference since the pandemic. I was privileged to attend physically and reconnect with my international peers again. This trip meant a lot to me, but also made me reflect again on the new normal of research connection.The trip to the 26th International Conference on Science, Technology and Innovation Indicators (STI 2022) in Granada, Spain, was my first international trip since I had finished my one-year research stay in Leiden and come back to Taiwan. When I learned that the STI 2022 conference would be held physically, I was very excited about returning to Europe and reconnecting with the colleagues over there. Due to the Covid-measures in place in Taiwan, it was not certain from the beginning that I would actually be able to attend the conference, but in the end it all worked out. I was privileged to attend the STI 2022 conference and extremely grateful for this opportunity. My trip was relatively short, and I did not have much time to enjoy the beautiful scenery of Granada. People might wonder if attending the conference for less than a week was worth traveling here from a faraway country. I did remember one colleague asking me this question, and my answer was, “Yes, definitely.”

      What reconnecting means to me

      It is because I reconnected to the center of the bibliometric community again! As a researcher from faraway Asia, I sometimes felt lost because many new topics have not yet been discussed at my place. Attending the STI conference live again gave me an excellent opportunity to follow the latest trends and have face-to-face discussions with my international peers. For instance, I noticed more and more studies and discussions about open infrastructures and new databases like Overton. The topic of diversity has gained more attention, with bibliometric analyses supporting policy-making in this area. Triangulating quantitative and qualitative analyses has become more common. Many interesting works related to funding policy also allowed me to understand the funding mechanisms in European countries better. I could even get in touch with participants who work at funding organizations. Not to mention that it was great to know who else is studying OA publishing and APCs, which is one of my research interests.

      Moreover, I made some personal “breakthroughs”. For instance, it was my first time hosting an STI conference session, my first presentation on international collaboration, and my first time being part of the reviewers. I have learned a lot from preparation to presentation, which gave me more confidence.

      Besides that, I also attended the first-ever "Women in Science Policy (WISP)” event at the conference. This was organized by Gemma Derrick, Cassidy R. Sugimoto and Caroline Wagner, who attempted to advocate for acknowledging women in science policy to relevant stakeholders and to build up the network for female researchers to coordinate matches between mentors and mentees. All female participants from different career stages were invited to attend this event on the first day after the reception cocktail. The senior female researchers were genuinely willing to share their experiences. When they heard questions from the junior researchers, they even would introduce other senior researchers who had similar backgrounds or had encountered similar issues before to juniors. For me, I did get to know more female researchers during the WISP event. It was a more relaxed environment than the coffee breaks during the daytime. The atmosphere, in general, was great. It did create a safe and friendly space without any burden. Usually, during coffee breaks, people update each other on research progress and career status, discuss their thoughts on the last session or plenary meeting, or introduce and exchange contact information in a hurry. At the WISP, I felt more comfortable asking questions and seeking advice like career planning.

      Of course, some of these observations and experiences could also have been achieved via online conferences, but the live and immediate discussions with international peers is the most valuable thing. It is something that is hardly replaced by virtual conferences. Real-time and physical conferences provide opportunities for connecting. We can interact through more frequent social events like coffee breaks, lunches, and dinners. It also gives us a more flexible schedule for “pre and post-conference activity” to enhance the connection. Grasping the opportunity to explore the city on the day before the conference starts or extending the happy-hour time after the conference ends is a way to get to know our colleagues better.

      Hybrid conferences – a compromise?

      Even though online conference formats may hardly replace the real and live interactions during physical conferences, attending international conferences has its economic and environmental costs and may not always be possible or desired. Here is where hybrid conferences can be a solution and might even help to ensure inclusion and diversity. During the pandemic, organizing a conference in the online format let academic communities get used to the new model of scholarly communication.

      But how do we make online experiences as likeable as meeting physically? I think the most important thing is: people online should not feel left out or disconnected. Besides some issues with technical equipment or internet connection, we often see them being forgotten during discussions. In that sense, ensuring every session host knows how to host hybrid conferences is essential.

      Regarding social activities, pure online conferences usually rely on chatrooms or even games to proceed; however, it seems impossible to engage people online and offline in the same social activities at the same time, for example, having a city tour together. This requires creative thinking to come up with approaches that make the conference experience enjoyable for both offline and online participants.

      Looking forward to STI 2023

      Here I would like to express my gratitude again to the organizing committee of the STI 2022 conference! I really appreciate the idea of inviting more early career researchers to host sessions and organizing the WISP event to provide an excellent opportunity for female researchers to get to know each other, engage in conversations, and exchange experiences. Now I am looking forward to the next one – STI 2023 in Leiden. The organizing committee has already announced that it will be held in a hybrid way. Moreover, the conference motto, “improving scholarly evaluation practice in the light of cultural change,” triggers the ambition of innovating the conference format as well as the submission and review process. Let's start preparing our work and hopefully reconnect again in person or online – whatever we prefer.

      ]]>
      Carey Ming-Li Chen
      Experimenting with open science practices at the STI 2023 conferencehttps://www.leidenmadtrics.nl/articles/experimenting-with-open-science-practices-at-the-sti-2023-conference2023-02-15T13:30:00+01:002024-05-16T23:20:47+02:00As organizers of the STI 2023 conference, we introduce two open science experiments: We adopt a new publication and peer review process and we invite authors of conference contributions to reflect on their open science practices.The adoption of open science practices has become a prominent topic of study for the science studies community. However, the research practices of the community itself are still quite traditional. While open access publishing, preprinting, open peer review, open data sharing, and other open science practices are gradually becoming more common in the science studies community, the adoption of these practices is still at a relatively low level.

      Given the community’s deep understanding of the research system, we think we should be able to do a better job. As organizers of this year’s Science, Technology and Innovation Indicators conference (STI 2023), we therefore introduce two open science experiments: We adopt a new publication and peer review process, fully aligned with state-of-the-art open science practices, and we invite authors of contributions submitted to the conference to reflect on their own open science practices.

      Experiment 1: Opening the publication and peer review process

      In earlier editions of the STI conference, contributions submitted to the conference were reviewed in a traditional closed peer review process. Contributions accepted for presentation at the conference were published in the conference proceedings while those not accepted for presentation were not published.

      For the STI 2023 conference, we are going to experiment with an open ‘publish, then review’ model as an alternative to the closed ‘review, then publish’ approach. The publication and peer review process will be organized as follows:

      • The conference will use a submission and publication platform provided by Orvium. All contributions submitted to the conference will immediately be published as a preprint on the platform. Contributions will be openly accessible under a CC-BY license. Authors will retain their copyright. Each contribution will have its own DOI.

      • The conference will organize an open peer review process. For each contribution submitted to the conference, the reviews will be published on the Orvium platform and will be linked to the preprint version of the contribution. Reviewers will be encouraged to disclose their identity, but they may also choose to remain anonymous. Authors will be invited to update their contribution based on the feedback provided by reviewers. The updated contribution will also be published on the Orvium platform.

      • As conference organizers, we will use the peer review results to select contributions for presentation at the conference. All contributions will remain available on the Orvium platform, both the contributions selected for presentation and those not selected.

      Further information about the publication and peer review process of the STI 2023 conference can be found in the call for papers. The ‘publish, then review’ model that we are going to use at the conference is inspired by platforms such as F1000Research, eLife, and Peer Community In, which combine preprinting and open peer review.

      Expected benefits

      Compared with the publication and peer review process in earlier editions of the STI conference, we see a number of benefits in our new approach:

      • Accelerating the dissemination of new scientific knowledge. The immediate publication of conference contributions as preprints will speed up the dissemination of new scientific knowledge. Interested researchers and practitioners will have access to the latest scientific findings without waiting for the conference to take place.

      • Increasing the value of peer review. In the traditional closed peer review model used in earlier editions of the STI conference, reviews were made available only to the authors of a conference contribution and to the conference organizers. In our new open peer review model, reviews will also be made available to the readers of a conference contribution, helping readers to develop a more informed understanding of the strengths and weaknesses of a contribution, also the ones not selected for presentation. This will increase the value of the reviews.

      • Giving more recognition to authors. The immediate publication of conference contributions as preprints will enable authors to get feedback and credit more rapidly.

      • Giving more recognition to reviewers. In the traditional closed peer review model used in earlier editions of the STI conference, reviewers hardly got any credit for their work. In our new open peer review model, reviewers who choose to disclose their identity will get public recognition.

      Potential concerns

      We recognize that the publication and peer review process of the STI 2023 conference may also raise concerns. A common objection against preprinting is that preprints may present inaccurate results because they are published before peer review. While results presented in preprints may indeed be inaccurate, the same applies to results reported in peer-reviewed articles, since peer review usually does not resolve all inaccuracies in an article. We also note that the reviews that will be published alongside the preprinted conference contributions will help readers to assess the quality of a contribution. Another concern about preprinting is that journals might be reluctant to publish articles that have already been published as a preprint. However, very few journals still have such a policy.

      A common concern about open peer review is that criticism provided by reviewers may be incorrect or even offensive. As conference organizers, we call on reviewers to give constructive and respectful feedback, for instance by following the FAST (focused, appropriate, specific, transparent) principles. We reserve the right to moderate reviews that we regard as disrespectful. If the authors of a conference contribution consider criticism provided by a reviewer to be incorrect, they will have the possibility to publish a response in which they explain why they disagree with the reviewer. Authors will also be able to update their conference contribution to address problems identified by reviewers.

      We appreciate that special consideration needs to be given to the interests of PhD students and other researchers who find themselves in vulnerable positions. These researchers may be disproportionately affected by the drawbacks of the way publication and peer review processes are organized. In a closed ‘review, then publish’ model, peer review may be biased against these researchers, lowering their chances of getting their work published. In an open ‘publish, then review’ model, these researchers may feel uncomfortable both about their own work being critiqued publicly and about publicly critiquing the work of others, in particular the work of more senior colleagues. In the evaluation of our new approach to publication and peer review (see below), we will pay special attention to the experiences of PhD students and other researchers in vulnerable positions.

      Experiment 2: Reflecting on open science practices

      As organizers of the STI 2023 conference, we strongly encourage authors of contributions submitted to the conference to adopt open science practices in their work. At the same time, we recognize that there may be barriers to the adoption of such practices, including for instance reliance on proprietary data sources, legal or ethical concerns, and lack of experience with open science practices. Rather than introducing formal open science requirements, we therefore take a more experimental approach. We invite authors of conference contributions to explicitly reflect on their own open science practices.

      Each contribution submitted to the conference is expected to include a short section in which the authors reflect on the use of open science practices in the research presented in their contribution.Authors may for instance discuss the openness of the data used in their research. If the data is openly available, the authors can explain how the data can be obtained. If the data is not openly available, the authors can explain why they do not use openly available data or why they are unable to make their data openly available. Openness of software and source codes can be discussed in a similar way. Authors may also discuss whether a research plan was made openly available at the start of their research (‘preregistration’) or whether any intermediate results of the research have already been published, for instance in a preprint.

      We hope this experiment will increase the awareness and adoption of open science practices in the science studies community. In addition, the experiment may also help organizers of future conferences to better understand how the adoption of open science practices can be facilitated and promoted.

      Evaluating the experiments

      The above two experiments will hopefully provide an additional motivation to colleagues in the science studies community to submit their work to our conference. We are eager to see how the experiments will work out. After the conference, we will invite conference participants to fill in a survey to evaluate the experiments. The outcomes of the evaluation will be reported in a blog post. In the meantime, if you have any questions about the experiments, or any feedback you would like to share, don’t hesitate to contact us.

      Looking forward to meeting you at STI 2023!

      ]]>
      Ludo WaltmanRong NiKwun Hang (Adrian) LaiMarc LuwelBiegzat MulatiEd NoyonsThed van LeeuwenLeo WaaijersJian WangVerena Weimer
      Navigating Responsible Research Assessment Guidelineshttps://www.leidenmadtrics.nl/articles/navigating-responsible-research-assessment-guidelines2023-02-02T13:00:00+01:002024-05-16T23:20:47+02:00Responsible Research Assessment is discussed and used in many contexts. However, Responsible Research Assessment does not have a unifying definition, and likewise its guidelines indicate that the implementation of Responsible Research Assessment can have many different scopes.Research assessment has a long history continuously introducing new methods, tools, and agendas, for example, peer review of publications dating back to 17th century and catalogues from the 19th century that facilitated publication counting. This blog post discusses Responsible Research Assessment (RRA), an agenda gaining attention today. The blog post gives an introduction to RRA and discusses how to navigate RRA guidelines, which can be a complex task.

      What is Responsible Research Assessment (RRA)?

      A search for definitions of RRA resulted in:

      Two definitions focus on principles for working with metrics, and the third on supporting diverse and inclusive research culture through research assessment. All are valid, and one unifying definition is still lacking. Also, the terminology varies. Assessment and evaluation or metrics and indicators are used interchangeably.

      It can be difficult to pinpoint exactly what RRA is and getting an overview of RRA is equally complex. One approach, however, is RRA guidelines that explain RRA and guide its implementation. Some internationally well-known RRA guidelines are: San Francisco Declaration on Research Assessment (DORA), Leiden Manifesto, Hong Kong Principles, and SCOPE.

      A common starting point for RRA and its guidelines is that traditional quantitative research assessment and its emphasis on bibliometric indicators may be easy to apply but has many biases. Criticism of traditional indicators is seen, for example, in DORA leading to the recommendation not to use Journal Impact Factors for research funding, appointment, and promotion considerations.

      Traditional quantitative research assessment is indicator- or data-driven, meaning that popular indicators—for example the Journal Impact Factor—or easily available data are the staring points of assessments. Instead, RRA focuses on the entity to be assessed and starts with what seems to be lacking in the traditional quantitative research assessments, for example, the values (cf. SCOPE), or the research integrity (cf. Hong Kong Principles) of the entity to be assessed.

      Who use RRA guidelines?

      Universities’ adoption of RRA guidelines is relatively new, and many universities use DORA or Leiden Manifesto, sometimes to develop local RRA policies. It is possible to endorse DORA and Hong Kong Principles at their websites, and the long lists of signatories show that not only universities but also other institutions from the research sector support RRA, for example, funders, publishers, learned societies, governmental agencies, etc. Also, individuals are among the signatories.

      RRA guidelines are not only relevant at the individual, local, and national level. The European Commission has published an agreement on how to reform research assessment. The RRA guidelines contribute to the basis for the reform, and the guidelines are among the tools for the practical implementation of the reform.

      What are the scopes of RRA guidelines?

      For institutions or individuals new to RRA, it can be difficult to navigate the guidelines. Which guidelines are relevant? What are the scopes of the guidelines? How are the guidelines applied? Etc.

      To answer these questions, the Evaluation Checklists Project Charter and its Criteria for Evaluation Checklists is useful. The criteria are developed by experts from evaluation research with the mission to “advance excellence in evaluation by providing high-quality checklists to guide practice” and the vision ”for all evaluators to have the information they need to provide exceptional evaluation service and advance the public good”.

      Using the criteria RRA guideline addresses one or more specific evaluation tasks and RRA guideline clarifies or simplifies complex content to guide performance of evaluation tasks, it becomes apparent that the four guidelines mentioned earlier differ in their scopes: SCOPE aims to improve the assessment process, Hong Kong Principles wants to strengthen research integrity, Leiden Manifesto stresses accountability in metrics-based research assessment, and DORA focuses on assessment of research publications but also other types of output. (See also this poster from the Nordic Workshop on Bibliometrics and Research Policy).

      How easy are RRA guidelines to use?

      Above it is shown that the first criteria can help understand the scope of a RRA guideline. Whether a guideline is easy to use may be addressed by the next sections of Criteria for Evaluation Checklists: Clarity of Purpose, Completeness and Relevance, Organization, Clarity of Writing, and References and Sources.

      Especially, the criteria on Clarity of Purpose address how to use a checklist. Not all four RRA guidelines discussed here are clear on all of these criteria, i.e., the process of applying the guidelines instead of simply the result of using the guidelines. Here are some examples of how to meet these criteria and, thus, help the user applying the guideline:

      SCOPE discusses the criterion The circumstances in which it [the guideline] should be used and concludes that research assessment and, thus, the use of SCOPE is not always the right solution. Assessment is not recommended to incentivize specific behaviours. For example, open access publishing would benefit more from making it easy for a researcher to comply than from measuring the researcher’s share of open access publications.

      DORA addresses the criterion Intended users. The sections in the guideline mention intended users. The users are funding agencies, research institutions, publishers, organizations that supply metrics, and researchers.

      Leiden Manifesto and Hong Kong Principles, respectively, have relatively clear purposes because of their delimited scopes; accountability in metrics-based research assessment and strengthen research integrity.

      The criteria sections Completeness and Relevance, Organization, Clarity of Writing, and References and Sources further review how well a guideline supports the RRA process. For example, the four guidelines provide illustrative examples and cases, but all aspects of an assessment task are not necessarily covered. And the guidelines are organized in sections, but it is not always clear how this organization supports the RRA process.

      Conclusion

      RRA does not have a clear definition, and RRA guidelines can be difficult to apply. The Criteria for Evaluation Checklists provides a tool developed by evaluation researchers that can help users choose relevant RRA guidelines for their work. Applying the understanding of RRA guidelines constituted by the Evaluation Checklists Project Charter may also facilitate a systematic analysis of RRA guidelines that could lead to a clearer definition of RRA.

      Acknowledgements

      This work was supported by a travel grant from the Danish Association for Research Managers and Administrators. I wish to thank the participants at the 27th Nordic Workshop on Bibliometrics and Research Policy. Their comments on my poster have served as inspiration for this blog post. Furthermore, discussions with Jon Holm, Special Adviser from Research Council of Norway, have helped define the scope.

      ]]>
      Marianne Gauffriau
      Five key facts to consider when studying science on Wikipediahttps://www.leidenmadtrics.nl/articles/five-key-facts-to-consider-when-studying-science-on-wikipedia2023-01-10T10:30:00+01:002024-05-16T23:20:47+02:00The presence of science on Wikipedia is a recurrent research topic in the scientometric community. However, its full potential for the study of science-society relations has not yet been fully explored. These are some of the key facts to be considered when studying it.Since its very beginnings, Wikipedia has been the target of criticism. The first (and negative) comparisons of its contents with those of other encyclopaedias are long gone, although the perception from academia was more optimistic. However, in education, the terrain in which this platform is most valuable, the controversy is greater. Its established use among students collides completely with the sceptical perception of part of the teachers. Despite this, there are more and more voices in favour of its use, as well as an increasing number of educational projects that integrate it into the classroom. This conflict has yet to be resolved, although the general perception has progressively improved over time.

      In the case of scientometrics, its community has been studying the presence of science on Wikipedia since before the formal birth of ‘altmetrics’. In most cases, however, these previous studies have mostly focused on the analysis of the scientific works mentioned on Wikipedia, rather than taking Wikipedia itself as their main research object. This science-centric focus typically overlooks the potential of exploring the different relationships that Wikipedia has (or doesn’t have) with science. In this post I reflect about such potential by presenting five key facts about the nature of Wikipedia and its possibilities as a research source for the study of science-society interactions.

      1) Why are scientific publications cited on Wikipedia?

      The most common critique of Wikipedia has to do with the reliability of its contents, a problem that Wikipedia itself exhibits with complete transparency. In its quest for reliability, Wikipedia places great importance on verifiability, which is one of its core content policies.

      There are several issues in these content policy guidelines that cannot be overlooked when studying Wikipedia citations to scientific publications. Firstly, Wikipedia is an encyclopaedia. It may seem obvious, but as stated in its content policy guidelines, "Wikipedia does not publish original research". Moreover, Wikipedia only publishes information of encyclopaedic relevance. Secondly, not all sources are valid as citations on Wikipedia. At the top of the list of source typologies recommended by Wikipedia are peer-reviewed scientific publications. Books are one of the most relevant materials. This relevance of books for Wikipedia has even led publishers to offer free access to their collections to Wikipedia editors via proposals such as The Wikipedia Library.

      The fundamental difference between Wikipedia citations and scientific citations cannot be ignored, as the interpretation of these differs greatly. Thus, the dynamic nature of Wikipedia must be clearly understood. Contrary to the static nature of citations to scientific papers, which theoretically speaking can never decrease, the references in a Wikipedia article can indeed disappear, and even reappear later. Analysing this phenomenon through a snapshot in which only the resources cited at a specific moment in time appear is useful, but it may hinder the consideration of all these fluctuations and specificities of Wikipedia citations.

      2) Linguistic and cultural multiverses

      Wikipedia is a decentralised medium whose management falls in the hands of its community of editors, also known as wikipedians, who dictate (many of) its policies, which must therefore have the support of the community. There is nothing immutable on Wikipedia. This is an important feature, resulting in more than 300 language editions, which are far from being mere translations. The community of wikipedians for each edition (also known as wikipedistas in Spanish, wikipédiens in French or wikipedianen in Dutch) establishes their own policies and manages their contents. It is enough to take a quick look at the main page of the Spanish, French and Dutch Wikipedias to observe clear differences. In fact, even the design or the name itself can have a slight variation, see for example the case of the Catalan Viquipèdia or the Galician Galipedia. This obviously has an impact on the contents, which may introduce cultural biases.

      Although the edits made to Wikipedia articles can come from users who contribute independently, there are also communities organised around topics. These are the so-called WikiProjects. Each of them is focused on a specific topic, for example astronomy, cats or Lady Gaga. Just as each language edition has complete autonomy, so do the WikiProjects. Each one establishes its own specific guidelines for the development and improvement of the project's articles of interest. They can provide recommendations, such as following a specific structure, or even offer suggested literature, as in the case of the lepidoptera WikiProject. Some of these activities can thus affect the contents of an entire block of articles. In addition, especially in the case of the English Wikipedia edition, WikiProjects organise the articles in a very remarkable way. Wikipedia articles are classified according to two criteria: the quality of the article and its importance or priority for the WikiProject in question. The use of references plays a key role in establishing one categorisation or another. It should be noted that this assignment is made freely by wikipedians, although the more advanced categories (Featured and Good Article) depend on a more centralised and standardised system with a particular system of nomination and voting.

      Average length (in bytes) and referenced publications of Wikipedia articles by quality level


      3) Life beyond Wikipedia articles

      In Wikipedia, the contents of articles are the result of consensus. This is not always possible and results in a high number of edits in which several editors try to get ahead of each other in their respective points of view. Wikipedia refers to these conflicts as edit wars, and some of the most regrettable ones have been documented. These conflicts are frequent in articles concerning more sensitive and topical issues. When one of these wars takes place, the community tries to reach a consensus on its own or with the intervention of a committee formed to help resolve it.

      Furthermore, wikipedians have the possibility to discuss the contents of articles openly with the rest of the community. Something that often goes unnoticed on Wikipedia is the talk page (you can find the link to it next to the article title), where editors do not only leave messages related to changes made or proposed changes, but also allow these contents to be discussed for improvement. The scientific literature also has a place in these discussions, for example by commenting on publications of interest for citation in the article or by being used as support for the statements made in the discussions.

      Wikipedia article

      Talks

      Wikipedia article

      Talkers

      1

      Donald Trump

      62,944

      Barack Obama

      6836

      2

      Barack Obama

      46,623

      Wikipedia

      5677

      3

      Climate change

      40,837

      George W. Bush

      5263

      4

      Intelligent design

      32,564

      United States

      4586

      5

      United States

      31,296

      Adolf Hitler

      4565

      6

      Jesus

      30,617

      Donald Trump

      4259

      7

      Sarah Palin

      28,514

      Michael Jackson

      4017

      8

      Gamergate controversy

      27,185

      Climate change

      3897

      9

      Homeopathy

      25,898

      Muhammad

      3197

      10

      Race and intelligence

      25,565

      September 11 attacks

      3132

      Top 10 English Wikipedia articles with the highest number of edits on their talks pages (talks) and unique users discussing (talkers). Article names in bold type appear in both lists.


      4) How are the contents of Wikipedia classified by topics?

      The way in which content is classified by topics on Wikipedia has its ups and downs. Wikipedia's main system is the categories (not to be confused with Wikidata Concepts), a folksonomy which, in the English edition Wikipedia alone, includes 2 million categories. As an example of the usefulness and representativeness of these, the Wikipedia article Bibliometrics has only one category (Bibliometrics), while Derek J. de Solla Price's article has 16, with some such as ‘1922 births’ and ‘1983 deaths’. This problem is undermined by the hierarchical relationships established between them. Because a category may have more than one parent category, it is difficult to establish a single broad topic for each Wikipedia article.

      In addition, Wikipedia has other systems that also organise its contents by topic and make browsing easier. Some of these are overview articles, lists or portals. Systems such as WikiProjects can also be used for this purpose, as they delimit articles related to a topic. There is also no shortage of machine learning applications, such as ORES, an article topic model that predicts the topic of an article.

      Interactive map of WikiProjects of the English Wikipedia with overlays of the average number of references (total, DOI and ISBN) of its articles

      5) Wikipedia as the ultimate social media for measuring social attention

      Finally, there is a wide range of metrics that can be obtained from Wikipedia to understand the different interactions taking place at Wikipedia. In this regard, it is worth recalling that Wikipedia is one of the websites with the highest traffic worldwide. It is in fact easy to find Wikipedia articles at the top of web search engine results, attracting millions of visits. Furthermore, not only is there an English Wikipedia, which is the largest one and can be used as a proxy for international forms of attention, but there are also different language editions that can be used to capture local attention. All things considered, what we have is a perfect social thermometer, the usefulness of which has already been noted, for example, for monitoring outbreaks.

      The number of times an article has been edited, as well as the unique number of editors involved, can shed light on which articles are most active and interesting for the Wikipedia community to engage with. In the case of discussions, these can even be seen as a proxy for identifying controversial content. On the other hand, the years since the creation of the article and its length make it possible to characterise the article, while the number of references to scientific articles reflects the scientific orientation or interest of the article. The possibilities are numerous, go far beyond these more general approaches, and many have yet to be explored.

      What is certain is that only by paying attention to these aspects when analysing science in this social medium will it be possible to understand the role that science plays in Wikipedia, beyond its greater or lesser presence, as well as the implications and reach of these resources within the community of editors and society in general.

      ]]>
      Wenceslao Arroyo-Machadohttps://orcid.org/0000-0001-9437-8757Rodrigo Costashttps://orcid.org/0000-0002-7465-6462
      Happy Holidays!https://www.leidenmadtrics.nl/articles/happy-holidays-22022-12-20T15:25:00+01:002024-05-16T23:20:47+02:00The year is almost over. 2022 was not just another year for the Leiden Madtrics blog, but came with quite a variety of blog posts. We (the blog team) had a lot of fun editing all of them and are proud of our authors. They did an amazing job. 

      At the same time, this year diversified our social media presence: Leiden Madtrics, along with CWTS, can now be found on Mastodon as well, while the institute also launched its own Mastodon instance. In this recent blog post, our colleagues explain why. Are you following us over there already? Of course, you may always opt for old-fashioned email notifications as well. Either way, exciting new blog posts for 2023 are already in the making!

      Until then, we wish you all a very relaxing holiday time and a Happy New Year!

      ]]>
      Blog team
      Take responsibility for social mediahttps://www.leidenmadtrics.nl/articles/take-responsibility-for-social-media2022-12-07T13:00:00+01:002024-05-16T23:20:47+02:00With many former Twitter users looking for alternatives, the decentralised Mastodon platform is on the rise. But decentralisation alone is not enough: institutions should take responsibility and host their own Mastodon server.Ever since Elon Musk took over Twitter, there has been a steady stream of Twitter users looking for alternatives, such as Mastodon. This alternative is part of a larger federation of social media services called the fediverse, which includes not only a Twitter-like platform such as Mastodon, but also Instagram-like photo sharing and TikTok-like video sharing platforms for example. The key idea is that this social media infrastructure is decentralised, having no central authority that oversees or manages everything. Any user on any part of the federated social media can follow any other user, across services, platforms and servers. Perhaps the easiest to understand analogy is email: from a personal mail address like v.a.traag@cwts.leidenuniv.nl you can reach anybody else, regardless of whether they have a Gmail address, a Hotmail address or another institutional mail address.

      Trust and moderation

      You might wonder what the benefit of this decentralised alternative is over established social media such as Twitter, Instagram or TikTok. We believe that part of its potential benefit is that it addresses two large problems of social media: trust and moderation. Social media plays an increasing role in societal debates, and we have a special interest in understanding the role of science in such debates. Social media suffer from various problematic aspects. There are concerns of the spread of misinformation, concerns of large swaths of bots and “fake” accounts, and of attacks on individual users. Although social media have increasingly tried to deal with this, it remains a rather daunting task.

      Addressing problems of trust and moderation requires more than just decentralised social media. At the moment, many Mastodon servers are run by volunteers, and some servers reached their limits under the strain of the millions of users migrating from Twitter to Mastodon recently. Although such volunteer activity is supported by generous donations, this is unlikely to scale to the hundreds of millions of Twitter users. Moderation is also run by volunteers, and scaling this to many millions of users is very challenging, running into exactly the same problems that Twitter and Facebook are facing. These established social media employ hundreds or even thousands of moderators, while problematic messages keep flowing through the cracks. Moreover, moderation should not be in the hands of the few, and Twitter or Facebook should not unilaterally get to decide for the world what should be allowed and what should not.

      Host server

      We propose that institutions should step up and take responsibility and host their own servers. Institutions, like universities, research centres, newspapers, publishers, broadcast companies, ministries and NGOs, all have a role to play in shaping the discussion on social media, without any single institution being in control. We believe that institutions setting up their own servers brings three benefits.

      First, by hosting their own servers, institutions contribute to trust and verification of users. Many institutions already have established and verified domain names, such as cwts.nl for our own institution, and this helps to establish a trusted presence on social media. Within the federated social media, accounts would be clearly associated with that domain name, for example @vtraag@social.cwts.nl, clearly establishing that these users belong to that institution. Institutions can limit users to staff members only and verify their identity, thus establishing a trusted presence. Users may benefit from the institutional connection, and as some have argued, this could establish an organisation as a trustworthy brand, making Mastodon a more suitable platform for institutions than Twitter, instead of less.

      Secondly, institutions with their own servers would contribute to the moderation of social media. Institutions need to take responsibility for moderating the behaviour of users of their own server. This means that institutions should implement a clear moderation policy for their social media presence. This is how it should be: different contexts may require different moderation policies. For example, researchers may have different obligations and responsibilities than the general public. This way, institutions could help ensure that debates take place more respectfully. At the same time, institutions would also help to ensure that people are able to express themselves freely and safely.

      Thirdly, establishing institutional servers makes decentralised social media sustainable. As we already noted, it is unlikely that the current system will scale to millions of people based on voluntary contributions. By stepping up and providing their own servers, institutions provide a critical part of the necessary infrastructure. Not only in monetary terms, but also in terms of time investment for verification and moderation.

      CWTS initiative

      This is why at CWTS we have now launched our own social media server at social.cwts.nl. Only people who are affiliated with CWTS can register for an account on this server. In practice, this means that CWTS staff members can register for an account using their institutional email address. We have written a moderation policy, and set up a moderation committee that will advise on any violations of this moderation policy to the management. The management would not moderate messages directly, and only rely on the moderation committee, thus providing some necessary checks and balances. We trust CWTS staff members to behave responsibly in accordance with this moderation policy. We will not actively check every message being posted, but reported messages will be followed up on.

      Does this initiative solve all problems of social media? Surely not. Institutional users presumably represent only a small minority of social media users. How the large public will find its way on Mastodon is not yet clear. This initiative will not directly reduce societal polarisation, but it may help establish a trusted social media presence of researchers who can engage in societal debates. It also expands the breadth of social media platforms that researchers can use to interact with broader communities. We believe that setting up our own server is a step forward, and we hope to see other institutions taking similar initiatives.

      ]]>
      Vincent TraagJonathan Dudekhttps://orcid.org/0000-0003-2031-4616Eleonora Dagienehttps://orcid.org/0000-0003-0043-3837Nees Jan van Eckhttps://orcid.org/0000-0001-8448-4521Rodrigo Costashttps://orcid.org/0000-0002-7465-6462
      Acknowledging the Difficulties: A Case Study of a Funding Texthttps://www.leidenmadtrics.nl/articles/acknowledging-the-difficulties-a-case-study-of-a-funding-text2022-12-01T10:00:00+01:002024-05-16T23:20:47+02:00Research on funding acknowledgments is in ascendance, with more data available and more studies done. Yet, there are specific challenges in accurately capturing this type of data. This blog post looks at a single publication's acknowledgment section in order to discuss several of these challenges.In June of this year, the Open Research Funders Group (ORFG) published an open letter to the wider academic community with a call towards improving research output tracking. Funding acknowledgments were a particular focal point. In the previous blog post in this series, we already addressed several issues at play in funding acknowledgment data sets. In this second installment, we examine a specific real-life example of one funding acknowledgment within which many of the issues presented in that previous post come together. The article in question was published in the Journal of Molecular Biology, with the research being primarily conducted at the College of Medicine, Florida State University.

      In this blog post, we suggest a taxonomy of different types of acknowledgment, all of which co-occur regularly in acknowledgment sections of published articles. In the reproduced acknowledgment section below, these different types are color-coded. We will show how different bibliographic databases parse and extract funding agencies and/or grant numbers from this text, and how they can all end up with a different result. By doing so, we would like to make clear that assigning funding agencies to publications is a process with a level of ambiguity, a process that relies at least partly on interpretation.

      ACKNOWLEDGMENTS

      We thank Dr. T. Somasundaram (X-ray Crystallography Facility) and Dr. Claudius Mundoma (Physical Biochemistry Facility, Kasha Laboratory, Institute of Molecular Biophysics) for valuable suggestions and technical assistance. We also thank Ms. Pushparani Dhanarajan (Molecular Cloning Facility, Department of Biological Science) for helpful comments. We acknowledge the instrumentation facilities of the Biomedical Proteomics Laboratory, College of Medicine. This work was supported by grant 0655133B from the American Heart Association.The use of the “mail-in crystallography” facility of the Southeast Regional Collaborative Access Team for diffraction data collection is acknowledged. The use of the Advanced Photon Sourcewas supported by the US Department of Energy, Basic Energy Sciences, Office of Science, under contract no. W-31-109-Eng-38. All X-ray structures have been deposited in the PDB.


      In the above text, we identify three main types of acknowledgment:

      • Personal acknowledgment: Individuals being acknowledged for their roles in the research process
      • Financial support: Reference to grants, contracts, or any phrasing that elucidates the financial component of the acknowledgment (terms like “funded”, “financially supported”, etc.)
      • Logistics acknowledgment: Reference to the use of facilities, materials and/or machines used in the research process

      When bibliometric databases count funding acknowledgments, it is important to accurately make the above distinctions, since different analyses require inclusion and exclusion of different acknowledgment types. This can already be difficult to ascertain when the wording in the acknowledgment text is ambiguous (i.e., is “Author A was supported by Harvard” a financial acknowledgment?) or when the logistic support comes with a grant or contract number.

      That latter distinction, between grant and contract, is important to note on its own terms:

      • Grant: in referencing grant 0655133B from the American Heart Association, the authors are referencing a specific grant number.
      • Contract: the authors also reference Contract No. W-31-109-Eng-38, a contract awarded by the US Department of Energy, Basic Energy Sciences, Office of Science.

      These types of financial support are distinct in their structure and function. While the case can be made for either type to be included as a funding acknowledgment, adding them up without distinction can feel like comparing apples and reds. Whether the financial support counted pertains to researchers’ salaries, a tailored grant, or a large government contract for a laboratory can be an important difference depending on one’s analysis.

      Different interpretations from bibliometric databases

      The idea that acknowledgment texts are highly interpretable can be observed in how different databases capture the acknowledgments of this example paper. The tables below show the resulting funding organizations when using the Web of Science, Dimensions, Scopus and Crossref databases respectively.

      Web of Science:

      Grant numberFunding agency
      W-31-109-Eng-38US Department of Energy, Basic Energy Sciences, Office of Science


      Dimensions:

      Grant numberFunding agency
      n/aOffice of Basic Energy Sciences
      0655133BAmerican Heart Association
      n/aArgonne National Laboratory


      Scopus:

      Grant numberFunding agency
      n/aU.S. Department of Energy
      n/aAmerican Heart Association
      W-31-109-Eng-38Office of Science
      n/aBasic Energy Sciences


      Crossref:

      Grant numberFunding agency
      0655133BAmerican Heart Association


      When comparing these results with the original acknowledgment text, the different databases clearly exhibit varying degrees of accuracy.

      Dimensions and Scopus provide the most comprehensive results, identifying financial support from both the US Department of Energy and the American Heart Association. In comparison, Web of Science only identifies the US Department of Energy and Crossref only identifies the American Heart Association.

      In addition to this, the results from Dimensions also list the Argonne National Laboratory which is not mentioned in the acknowledgment text. After further investigation it was found that the Advanced Photon Source is located at Argonne National Laboratory. This is a complicated case precisely because it can be partly categorized as logistical support (“Use of the Advanced Photon Source”) and partly financial (the mentioned contract). However, we would argue that having the Argonne National Laboratory as the funder here is debatable since the funding that is in play here is from the US Department of Energy to the Argonne National Laboratory. Arguably, the support from Argonne National Laboratory is logistical, while the support from the US Department of Energy is financial yet of a more indirect type than the American Heart Association.

      Furthermore, there is also a variability in the identification of grant numbers by the different databases. Web of Science and Scopus only find a grant number for the US Department of Energy, whereas Dimensions and Crossref only find a grant number for the American Heart Association.

      Extracting and identifying funding acknowledgements

      The variation in the results can be partly explained by the different approaches taken by the databases for the extraction and identification of funding acknowledgment data.

      Web of Science extracts and displays the raw (source) text from the acknowledgment text, while Dimensions only displays the resulting assignment to an organization in the GRID database it uses. To end up with this assignment, Dimensions uses a combination of “text-mining the ‘Acknowledgments’ or ‘Funding’ section” and “structured metadata received from some of our publication data sources, e.g., Crossref or PubMed”.

      The funder registry used by Crossref was donated by Elsevier, and is combined with acknowledgment and grant information provided to Crossref by publishers and funding agencies in order to connect the funders in the registry to publications. Scopus extracts organizations from the acknowledgment text and matches them to the Crossref funding registry.

      These methodological differences can result in the potential loss of discerning information regarding the identification of funding organizations. For example, in the acknowledgment text the reference to the US Department of Energy consists of three parts: the funding agency (US Department of Energy), the funding programme (Basic Energy Sciences) and the programme office (Office of Science).

      Web of Science identifies this information as one funder, including the hierarchical structure of the organization within the name. In comparison, Scopus lists these different levels as separate organizations, resulting in the identification of three funders where there should only be one.

      It is also important to note that the relationships between the organizations are not documented within the funding registry created by Web of Science. The hierarchical relationships between different organizations are available within the Crossref and GRID registries used by the other databases, allowing organizations to be aggregated into higher-level entities.

      Conclusion

      These types of discrepancies in funding acknowledgments are not rare. The standards and practices of what or whom to acknowledge vary depending on the field of study, with cultural factors also playing a role.

      The above example illustrates certain nuances that one needs to be aware of when analyzing funding acknowledgment databases; each database captures and interprets the data differently and the exact nature of the acknowledgment is not always obvious. Moreover, it also shows that counting acknowledgments is not a straightforward task, with one paper resulting in either 1, 2, 3 or 4 acknowledgments depending on which bibliographic database you refer to.

      It would be helpful if bibliographic data providers were more forthcoming on the decision processes that lie behind such results as shown above. How do they distinguish funding acknowledgments from other types of acknowledgments? Why do they include certain mentioned organizations in the text and ignore others? For some data providers, it is also not clear whether the connected funder is extracted from the text or derived from other sources, such as data provided by the publisher or funder. Here, too, transparency would be helpful for those using the data.

      Finally, though one standardized format of writing acknowledgments could never fit every case, as mentioned in the previous post, using persistent identifiers and templates provided by funders can help to streamline the processing of this data.

      Part 2 of the series on Funding Acknowledgements in Academic Publishing

      Photo by Markus Winkler on Unsplash

      ]]>
      Dan GibsonJeroen van HonkClara Calero-Medina
      We need to talk about our partnership: lessons from the EVALUATE projecthttps://www.leidenmadtrics.nl/articles/we-need-to-talk-about-our-partnership-lessons-from-the-evaluate-project2022-11-29T12:30:00+01:002024-05-16T23:20:47+02:00How to evaluate strategic partnerships? International officers of six universities asked this simple yet challenging question. CWTS and STIS participated and decided to co-create with the international officers. The result is an evaluation framework that looks unlike anything they had imagined.Researchers collaborate across borders and continents. Students go on exchange and go study abroad. Nothing new so far. Yet formalised international strategic partnerships between universities are more recent. These agreements include both research and education and cover a range of departments. And they are expected to contribute to strategic goals and have great impact.

      The University of Edinburgh is involved in a range of strategic partnerships, and noticed a lack of consistent, aligned evaluation practices. It proved a challenge to assess whether to enter into an agreement with a potential partner, or whether a strategic partnership indeed delivered its expectations, let alone to discuss this with their strategic partners. They invited five of their strategic partners (Universities of Copenhagen, Helsinki, Leiden, Sydney, and University College Dublin) to join hands, develop an evaluation framework and publish a handbook. The framework had to be based on state-of-the-art literature and had to lead to clear assessments of strategic partnerships.

      Enter Leiden University’s CWTS and the University of Edinburgh's Science, Technology and Innovation Studies (STIS). We were asked to contribute to the project, given our expertise in research assessment, research governance and STIS’s knowledge of collaboration and internationalization.

      The literature review by STIS is extensive and rich and covers internationalization, mobility, and environmental impacts of international collaboration. Yet it was not straightforward to find literature immediately relevant for international strategic partnerships between universities, nor on the evaluation of such agreements. Therefore, we first unpacked the notion of international strategic partnerships, to understand the different forms and formats it can take. This approach delivered keywords for a broader literature review, which put forward various, separate bodies of literature that are all relevant to international partnerships. The literature review provided our evidence base to develop the framework. And more on (the literature review on) internationalisation in an upcoming blogpost by Rodrigo Liscovsky.

      As strategic international partnerships come in different shapes and forms, we had doubts from the start about the feasibility to develop a simple framework, with straightforward guidelines on data and a clear assessment as result. To ensure the framework could be used in a variety of situations, we wanted to take the context into account. Context is relevant both in terms of governance (e.g. how the evaluation is used), as well as in terms of the partnership, including the history of the partnership, its goals and implementation plan.

      Some examples to illustrate the diversity the framework needed to cover. According to the definition developed by our partners, strategic partnerships include both research and education. However, it soon became clear that some of their strategic partnerships are research only. In addition, according to their definition, strategic partnerships are between universities, while we also heard about partnerships with a variety of partners, including local authorities. Also, a strategic partnership should be university wide. Yet several of the partnerships are focused on one or two topics only. And regarding use and governance: we noticed that some universities wanted to use evaluation to gain insight into the partnership and develop recommendations for improvement, whereas in other universities the evaluation was going to be used to inform decisions.

      We heard a lot about the strategic importance of partnerships, little about its implementation and management, and even less about their evaluation. We realized that whatever framework we would develop, it would differ substantively from the expectations of a comprehensive evaluation tool. Instead, we felt we needed to address simple implementation and evaluation questions, and we wanted to ensure the framework could be used in different governance systems, and at any time in a partnership (before, during, towards the end). We therefore started to think of a framework consisting of a set of questions and were inspired by examples such as the Societal Readiness Thinking Tool and the Toolbox Policy Evaluation (in Dutch).

      We realized that in order to develop a useful evaluation framework, we had to collaborate closely with the international officers from the six partner universities and take them along in the development. We proposed to develop the framework on the go. One of us had done so before, when developing a societal impact approach with and for research infrastructures in the ACCELERATE project. We asked each of the six partners to do a case study, i.e., to evaluate an existing strategic partnership and we offered to guide them through this approach. We also suggested to use a “logbook” and keep notes of any changes in the evaluation, new insights, eye-openers, questions, etc.

      As a result, our partners contributed evaluations of, in random order, their very first partnership; a research collaboration focused on two topics and two universities; a research collaboration of one university with a variety of partners in a specific region; the portfolio of partners in one continent and university wide collaborations covering research, education as well as professional staff.

      We organized four online meetings with each partner and planned to address different topics in every meeting. The topic of the first meeting was the history, rationale and context of the partnership and the reason to evaluate. The result would be a clear evaluation question. The second meeting was dedicated to data collection, the third to analysis of the data and the fourth and final to the interpretation of the evidence collected, and the formulation of the assessment of the partnership.

      In practice the flow was iterative, and new topics arose every time. Composing the evaluation question was not easy at all and required many reformulations. The history and rationale of a partnership were addressed in subsequent meetings. The implementation of the partnership and the roles and responsibilities were brought up more than once. And when several partners wanted to reach out to researchers and students, we spent ample time talking about qualitative research methods such as interviews and surveys.

      According to their own account, our partners lost confidence when they first started working on their case. They grappled with the complexity of contextual factors and the variety of perspectives of students, researchers, administrators, and the partner university. However, after four online meetings, they regained confidence when we met in person for the very first time. They presented and discussed their evaluations, thought along with each other, and advised on next steps. Several mentioned that it was all about asking the right questions and they asked each other the right questions indeed.

      In the end, the framework we developed together is basically a series of questions. About the context of the evaluation (Why evaluate? What is the goal?); about the specific evaluation (What is the evaluation about? What is the central question?); and about the context of the partnership (What is the history? What are the targets?). Plus, it includes an extensive methodological section. When we presented the framework, our partners recognised the questions and accepted it as a useful framework.

      The final phase of the project was the development of the handbook. We described the framework, completed the literature review and our partners described their evaluation. Perhaps the most interesting chapter is Lessons Learnt from the EVALUATE project, written by our partners. Remember how they struggled with the diverse perspectives? They now acknowledge the variety of perspectives, suggest taking these into account and use participative methods. They provide recommendations on such diverse topics as data collection, the use of evaluation and the implementation of strategic partnerships. They question unrealistic expectations and bold claims, such as turning students into “global citizens” or using research to address “global challenges”. And they advise thinking about evaluation as an opportunity to build capacity and involve and inspire partners.

      We had hoped that talking about evaluation of strategic partnerships would lead to changes in the management and implementation. And indeed, when we met for the second time, we noticed how our partners were changing their practice. Several had discussed expectations and intentions with their partner universities, as well as within their own university. Something they hardly did before. Moreover, they wanted to reach out to partner universities outside of Europe and Australia and use the experience, and the framework, for these partnerships as well.

      But we need to be realistic. In general, many see strategic partnerships as, well, of strategic importance. They expect great contributions, however small the partnership. And when it comes to the newest development of university alliances, expectations are even grander. Four universities involved in EVALUATE, including the universities where we are based, are part of Una Europa. The alliance believes a university is created by and for society and as such driven to be of relevance, impact and high quality. It is a laboratory of the here and now, where creativity and experimentation unlock the hidden potentials of tomorrow. Who is against this creed? Not many, we guess. But what does it mean in practice? What is the evidence? How can this be assessed? Let’s talk about our partnership!

      EVALUATE is funded under ERASMUS+ Key Action 2.

      This blogpost is based on the experience of the authors with the EVALUATE project and on the EVALUATE framework and handbook. Pictures are of EVALUATE meetings and of the EVALUATE framework and handbook: EVALUATE project (2022): The EVALUATE framework and handbook: Harnessing the power of evaluation to build better international strategic partnerships between universities. Edinburgh: The University of Edinburgh.

      ]]>
      Leonie van DroogeCarole de BordesNiki VermeulenMayline Strouk
      Why are diversity and inclusion important for Global Science?https://www.leidenmadtrics.nl/articles/why-are-diversity-and-inclusion-important-for-global-science2022-11-10T11:00:00+01:002024-05-16T23:20:47+02:00CWTS is starting a new UNESCO Chair on Diversity and Inclusion in Global Science. In this blog post we outline why this topic matters and how our team aims to contribute to UNESCO's agenda of making science a positive force for development.Created in 1992, the UNITWIN/UNESCO Chair programme is intended to support developing expertise in areas related to UNESCO’s mandate, such as education, culture, communication and the natural and social sciences. This network of over 850 institutions in 117 countries mobilises knowledge to address pressing societal challenges and contribute to development.

      UNESCO has developed the 2017 Recommendation on Science and Scientific Researchers and the 2021 Recommendation on Open Science, building on the notions that science is a common good, that all humankind should enjoy the benefits of scientific knowledge and has the right to participate in it.

      If you agree on this understanding of science as a common good, you may reply: “all right, yes, science is a common good, but right now:

      • Who benefits from science?
      • Which type of research topics are considered important?
      • Who participates in making science and deciding which knowledge is produced?”

      The answers to each of these questions point in the same direction: science is heavily concentrated towards the interest of the privileged and it supports forms of innovation that actively contribute to world inequalities. For science to be a common good, there is a need for diversity and inclusion, which means:

      • Widening the distribution of the benefits of science across populations.
      • Pluralising research topics.
      • Broadening participation and activities in knowledge production, both of citizens and the academic workforce.

      The new CWTS UNESCO Chair on Diversity and Inclusion in Global Science aims to contribute to the implementation of the 2017 and 2021 UNESCO Recommendations through a focus on Diversity and Inclusion in Global Science, in collaboration with a variety of research and policy partners in the world.

      Why does the diversity of research topics matter for global science?

      It has long been argued that, in general, diversity in research is beneficial because:

      • it fosters new ideas through recombination, for example in terms of interdisciplinarity;
      • it is an insurance against incertitude, given that we don’t know what the best solutions to problems are, it’s better to try out different avenues;
      • it prevents research from lock-in, i.e., it keeps the flexibility to adapt knowledge in the face of changing environments;
      • it accommodates plural perspectives, i.e., it allows science to reflect the contrasting views on issues that exist in society.

      If we think of science as a key element for improving well-being and human development, diversity of knowledge is even more important. This is because research agendas are too often concentrated towards the issues and the framings that are relevant to the Global North and for powerful or privileged actors.

      The historical role of science in colonialism and environmental degradation would be examples of this concentration of research towards the interest of the powerful. On the contrary, there is relatively much less research in topics which are more relevant for example for women, the Global South or some ethnic or indigenious groups.

      Research efforts across diseases is a classic example of this: there is little research not only in some tropical diseases such as malaria, but also in topics such as cardiovascular diseases which affect poor populations, in comparison to investments in diseases such as cancers which are relatively more frequent in the richest populations.

      Another example of imbalance is artificial intelligence. In this case, research is concentrated in topics that are relevant to big corporations rather than research involving other methods that are more useful to consider the societal and ethical implications of AI.

      In short, making the contents of research more diverse is important for science to address the scientific problems associated with the challenges that matter to most people in the world.

      Why is inclusion of social groups important for global science?

      Now, for research to address a wider variety of topics, and especially societal challenges, it is necessary that science is more representative of the world population. Plural representation is both a normative and substantive imperative. In other words, researchers must come from a broader variety of social backgrounds and citizens must participate more actively in shaping knowledge so that science is more democratic and reflects plural interests and needs. For this purpose, science also needs to be created and shared in local languages (as suggested by the Helsinki Initiative on Multilingualism) and through open scholarly infrastructures.

      In recent decades, science is already undergoing a transformation in this direction, with the growth of citizen science, and the increasing participation of concerned groups such as patients, or marginalised groups in dimensions such as gender, ethnicity or Global South countries.

      However, many social groups still remain heavily underrepresented and face discriminatory working conditions or lack of academic freedom, and stakeholder engagement in science remains a challenge. There is still a lot of progress to be made so that science reflects the plurality of world societies.

      How will the CWTS Chair contribute to UNESCO’s agenda?

      Given the expertise of CWTS on S&T indicators and research assessment, our Chair aims to provide evidence to raise awareness on existing problems in diversity and inclusion in world science. We will work mainly along two complementary lines.

      First, developing monitoring methods that illuminate progress in the adoption of the 2017 Recommendation on Science and Scientific Researchers, and the recent Recommendation on Open Science, with a focus on making knowledge more accessible, representative and participatory.

      The monitoring methods for these recommendations are not straightforward at all because they are related to values and need contextualisation. We have to go beyond existing statistical methods. To do so, we will build on expertise developed in projects for monitoring Responsible Research and Innovation, in particular SuperMoRRI.

      Second,developinga multi-perspective observatory of global scholarly communication (let’s call it a Multiversatory!), focusing on making visible outputs and activities of the global academic community which are currently invisible. A classical example is the exclusion of national and local scientific journals from mainstream scientometric databases. So far, the global research landscape has been mapped using selective commercial databases which miss a large share of all scientific publications, particularly from journals in the social sciences and humanities and from the Global South.

      However, more comprehensive open databases such as Crossref and OpenAlex are becoming increasingly available. These databases provide a more inclusive (though still incomplete) coverage for the Global South and also allows comparison of how visibility differs depending on perspectives. We believe that with these new databases a step change will be soon made in the analysis of the geography of scholarly communication. We expect to show that world science is actually more diverse than is frequently believed, but that many parts of the knowledge created often remain invisible.

      ]]>
      Ismael Rafolshttps://orcid.org/0000-0002-6527-7778Ingeborg MeijerRodrigo Costashttps://orcid.org/0000-0002-7465-6462
      Reflections on guest editing a Frontiers journalhttps://www.leidenmadtrics.nl/articles/reflections-on-guest-editing-a-frontiers-journal2022-10-31T12:00:00+01:002024-05-16T23:20:47+02:00In this blogpost, the authors critically discuss their experience as guest editors for a Frontiers journal. They aim to foster open scholarly debate about Frontiers publishing practices, triggered by Frontiers hindering such debate on their own pages.The idea for this blog post emerged in the context of a special issue with the online journal Frontiers in Research Metrics and Analytics. We, a group of researchers that can broadly be associated with science & technology studies and meta-research, were invited by Frontiers to guest edit what they call a ‘Research Topic’, suggesting it could focus on innovations in peer review practices. We accepted the invitation, and subsequently launched a call for contributions around the topic of “Change and Innovation in Manuscript Peer Review”. The resulting collection appeared in January 2022 and contains six articles we are very proud of. They touch on such topics as the specificities of peer review in law journals, the changing role of (guest) editors amidst increased use of editorial management systems, and mechanisms and labels to assure quality in book publishing.

      We were aware of previous criticism of Frontiers’ approach to scholarly publishing (see for instance here, or here for a recent example) and intensively discussed whether we should embark on this project. We came to the conclusion that the topic is important and timely, especially in the context of a journal that itself represents (and pushes) new peer review and editorial practices. That said, working with Frontiers forced us to develop a form of reflexivity about our own publishing process we would have rather liked to do without. More specifically, we aimed to publish our reflections on the editorial practices we encountered during our editorship as part of the introduction to the Research Topic, but Frontiers did not allow us to. After more than half a year of discussions - and particularly long periods of silence from Frontiers - we decided to publish our editorial as a preprint and write this blog post to inform the scientific community about our experiences.

      Concerns about the editorial process

      Our worries began with the organisation of the peer review process itself. Frontiers forces users into a relatively rigid workflow that foresees contacting a large number of potential reviewers for submissions. Reviewers are selected by an internal artificial intelligence algorithm on the basis of keywords automatically attributed by the algorithm based on the content of the submitted manuscript and matched with a database of potential reviewers, a technique somewhat similar to the one used for reviewer databases of other big publishers. While the importance of the keywords for the match can be manually adjusted, the fit between submissions and the actually required domain expertise to review them is often less than perfect. This would not be a problem were the process of contacting reviewers fully under the control of the editors. Yet the numerous potential reviewers are contacted by means of a preformulated email in a quasi-automated fashion, apparently under the assumption that many of them will reject anyway. We find this to be problematic because it ultimately erodes the willingness of academics to donate their time for unpaid but absolutely vital community service. In addition, in some cases it resulted in reviewers being assigned to papers in our Research Topic that we believed were not qualified to perform reviews. Significant amounts of emailing and back-and-forth with managing editors and Frontiers staff were required to bypass this system, retract review invitations and instead focus only on the reviewers we actually wanted to contact. As it turns out, the editorial management system is so rigidly set up, that even Frontiers’ own staff does not always have the ability to adjust key settings.

      Another concern we had is the pacing of the review and publication process. Frontiers aims to avoid unnecessary delays in the reviewing of submissions, a goal we wholeheartedly subscribe to. Yet the intended workflow is such that reviewers have only seven days to complete their reports as a default, with the possibility to extend the deadline to twenty-one days - however, again at the cost of a cumbersome process of emailing with Frontiers staff. Also, automatically generated review invitations as described above are sent out if the editors do not send out sufficiently many review invitations themselves within three days, including weekends, holidays and (as was the case with us) summer breaks. While we see how short deadlines can contribute to fast dissemination, we feel that the current standards might jeopardize the quality of the review process.

      A third element of the rigidly organised review process we found to be a mixed blessing concerns the level of editorial control that editors maintain. In fact, editors are encouraged to accept manuscripts as soon as they receive two recommendations for publication by reviewers (regardless of how many other reviewers recommend rejection). This holds for all review rounds. Especially in combination with the factors mentioned above, i.e. potentially unqualified reviewers being invited and high requirements on review speed, this potentially creates additional challenges to the quality of the editorial process.

      Hindered to voice reflections

      As referred to before, a learning experience of a questionable sort was our attempt to publish an editorial that reflected on these issues. We naturally intended to include our editorial in the very special issue we edited. However, upon submission of our draft we received a message informing us that our text was not in accordance with the guidelines of Frontiers. They insisted that the text could not be published unless we took out the two paragraphs of rather critical reflections on Frontiers’ editorial process. We insisted that these reflections were an essential element of our editorial and closely related to the content of our Research Topic, which dealt with the impact of editorial processes on knowledge production and dissemination. In addition, we felt that being forced to erase the reflections drastically impacted on our editorial freedom. This then led to several emails back and forth, among others including Frontiers’ head of research integrity and various in-house editorial staff members. When the issue could not be resolved through correspondence, we ultimately scheduled a zoom call with Frontiers’ Chief Executive Editor (CEE). We once again explained our stance regarding the appropriateness of reflecting on our editorial process in our editorial.

      In our meeting, the CEE confirmed that such a reflective element was appropriate and that Frontiers was of course ‘very willing to listen to our feedback’. However, he felt that an editorial was not the right place to voice such reflections. There were concerns about “our editorial lacking context”. Apparently, the issues we identified were specific to our own process and were in no way indicative of Frontiers’ general practices. We have reasons to doubt the veracity of this claim.

      Subsequently, we were promised that the CEE would come up with a suggested solution to the situation in the week following our call. After four months and six reminders, we have still not heard back from Frontiers. That is why we decided to publish our editorial as a preprint (in line with Frontiers’ own preprint policies) and publish this blog post to inform the scientific community about our process. We informed the Frontiers staff about the publication of the preprint and this blog post in advance, but once again without response from their side.

      Towards open scholarly debate

      By writing this blog, we aim to share our experiences as guest editors at Frontiers, contributing to the ongoing debate about changing publishing and editorial models. We are generally in favour of improving and innovating editorial and peer review processes and find several elements of Frontiers’ editorial model interesting, including the Open Identities and Open Reports formats of review, and creating a forum for authors, reviewers and editors to interact. However, we have concerns about other elements, believing that they affect the quality and integrity of the process and published record. We believe that openness about our experiences is important to support stakeholders in making informed decisions about how, where and with whom to engage in the publishing process. We much regret Frontiers’ attempts to hinder an open discussion about these aspects. Despite our reflections not being part of the Research Topic, where we still feel they would have fitted best, we hope our editorial/preprint and this blog post can trigger the open scholarly debate we believe to be essential.


      Header image: Bench Accounting
      ]]>
      Serge HorbachMichael OchsnerWolfgang Kaltenbrunner
      Q&A about Wiley's decision to open its abstractshttps://www.leidenmadtrics.nl/articles/q-a-about-wileys-decision-to-open-its-abstracts2022-10-25T15:40:00+02:002024-05-16T23:20:47+02:00In this post Ludo Waltman and Bianca Kramer reflect on today’s announcement that Wiley is joining the Initiative for Open Abstracts (I4OA) and is going to make abstracts openly available through Crossref.Why is it important that abstracts are made openly available?

      In a blog post that we published two years ago together with our colleague Aaron Tay, we discussed numerous ways in which open abstracts can be of great value. This includes scientific literature search, both using traditional query-based search tools and using more advanced text mining and visualization tools. It also includes the analysis of the structure and dynamics of research fields using bibliometric visualization tools such as VOSviewer and CiteSpace. In addition, we pointed out that open abstracts can be used to support systematic literature reviewing, to algorithmically identify relations between scholarly outputs, to assign these outputs to research topics or research fields, and to enable automatic knowledge extraction, for instance by algorithmically identifying biomedical entities and gene-disease associations.

      Publishers typically make abstracts freely available on their websites. However, to support the above use cases, it is essential that abstracts are openly available in a centralized infrastructure. For publishers that work with Crossref to register DOIs for their content, the Initiative for Open Abstracts (I4OA) recommends making abstracts openly available through Crossref.

      Many other publishers have already opened their abstracts. What is the significance of the step taken by Wiley?

      Indeed many publishers have already opened their abstracts, and of these publishers 100 are also formal supporters of I4OA. This includes Hindawi, Royal Society, and SAGE, three of the founding organizations of I4OA. Abstracts are currently openly available for 39% of the journal articles in Crossref in the period 2020-2022. Until today, however, of the world’s five largest publishers, in terms of number of journal articles, MDPI was the only one supporting I4OA. Of these five publishers, Wiley is now the second one joining I4OA. It follows the example of Hindawi, which was acquired by Wiley last year. Given that Wiley published 6% of the journal articles in Crossref in the period 2020-2022, we see Wiley’s support for I4OA as an important milestone for openness of abstracts.

      What do you expect other large publishers will do?

      With support for I4OA from the world’s third (Wiley) and fourth (MDPI) largest publisher, we do not see any credible argument for other large publishers, in particular Elsevier, Springer Nature, and Taylor & Francis, to withhold their support for open abstracts.

      Springer Nature is under pressure from the editors of its flagship journal Nature to support open abstracts. It is already making abstracts openly available through Crossref for its open access content, but unlike Wiley and other publishers supporting I4OA, its policy is not to make abstracts openly available for its subscription content. Extending its support for open abstracts to all its content seems a natural next step for Springer Nature.

      While it may take a bit more time, we expect that Taylor & Francis and Elsevier will follow as well. Taylor & Francis has a daughter company, F1000, that was one of the initial supporters of I4OA. We do not see any reason for Taylor & Francis not to follow the example of its daughter company.

      In an apparent attempt to protect its Scopus business, Elsevier initially declined to open its citations, despite strong protest from the scientometric community. However, in 2020, Elsevier changed its position and joined the Initiative for Open Citations (I4OC). Of the larger publishers, Elsevier was one of the last ones to open its citations. To prevent this history from repeating itself, we are hopeful that Elsevier will act more swiftly in opening its abstracts.

      How does the step taken by Wiley fit into the bigger picture of openness of metadata of scholarly outputs?

      While openness of abstracts and citations is of critical importance, it is of limited value if other metadata is not made openly available as well. This for instance includes affiliation and funding metadata, license information, and links between scholarly outputs, such as links between preprints and the corresponding journal articles or between journal articles and the associated data sets. This metadata should as much as possible make use of openly-governed persistent identifiers, for instance ORCID and ROR identifiers.

      As can be seen in the figure below, in recent years publishers have made significant progress in making metadata of journal articles openly available through Crossref. More detailed statistics reported in this preprint show that Wiley is doing a good job by making affiliation metadata openly available. Other large publishers, such as Elsevier, Springer Nature, and MDPI, have not yet taken this step. Like many publishers, Wiley is also making funding metadata openly available. However, as shown in recent analyses (see here and here), for many publishers the funding metadata made available through Crossref suffers from gaps and other quality issues.

      rcentage of journal articles with open metadata in Crossref.

      Percentage of journal articles with open metadata in Crossref. Source: Van Eck & Waltman (2022, Figure 2).

      In some cases, metadata that is not made available through Crossref can be obtained from other open data sources, such as OpenAlex. OpenAlex collects affiliation metadata from publisher websites and makes this metadata openly available. As shown in a recent analysis performed by one of us, OpenAlex is able to provide affiliation metadata for publishers that do not deposit this metadata to Crossref. However, this metadata has not been ‘authorized’ by publishers and may suffer from inaccuracies due to technical challenges in the algorithmic extraction of metadata from publisher websites.

      Similarly, OpenAlex is able to provide abstracts for 75-80% of the recent journal articles in Crossref, partly by scraping abstracts from publisher websites, which might cause accuracy issues. These abstracts are made available in an ‘inverted format’ (i.e., as a list of individual words with location indicators) for copyright reasons, which is somewhat cumbersome and potentially less sustainable than having abstracts made available by publishers in their Crossref metadata.

      How can researchers and other actors in the research community contribute to openness of abstracts and other metadata?

      Realizing openness of abstracts and other metadata requires significant efforts by publishers and their technology providers, and also by the team of Crossref. Other actors in the research community can contribute as well, in particular by showing the value they attach to open metadata.

      Researchers can contribute by taking openness of metadata, including abstracts, into account when choosing the journal to which they submit their work. Openness of metadata will reduce the dependency on proprietary platforms such as Scopus and Web of Science for discovery of research and assessment of researchers. Crossref provides Participation Reports that researchers can use to get a quick overview of the metadata that a publisher makes openly available through Crossref.

      Research funders can make a contribution by including openness of metadata as a requirement in their open access policies. This is for instance already done in Plan S. Likewise, research institutions and their libraries can contribute by including openness of metadata in their negotiations with publishers, as suggested by the TIB library, one of the more than 60 stakeholders supporting I4OA.

      If you would like to contribute to openness of abstracts, the I4OA team is happy to help. Feel free to reach out, either on Twitter or by email.

      ]]>
      Ludo WaltmanBianca Kramer
      A monitoring and evaluation framework for responsibility in R&Ihttps://www.leidenmadtrics.nl/articles/a-monitoring-and-evaluation-framework-for-responsibility-in-r-i2022-10-20T10:30:00+02:002024-05-16T23:20:47+02:00In this blogpost (and the next), the development of a Monitoring and Evaluation framework for Responsible Research and Innovation (RRI) in the EU is told through our learnings in the H2020-funded project SUPER MoRRI over time.The learnings have been presented and published in different shapes and forms, book chapters, working papers, reports, many deliverables, publications, and presentations. Here we present the breadth and depth of the work by linking it to the SUPER MoRRI blogpost series and turning them into an overarching story in two episodes.

      In 2014, CWTS got involved in the MoRRI project funded by the European Commission (EC) to follow up on their new policy of Responsible Research and Innovation (2013). In the policy context, the concept of Responsibility is attributed to anticipatory, reflexive, responsive, and inclusive attitudes in research and innovation processes and was operationalized in six key principles: gender equality, public engagement, ethics, open access, science literacy and science education, and governance. MoRRI followed the key principles of the EC, building upon earlier indicators, and developing new ones, on a national level. Data collection across Europe on the actual situation was hampered by the low number of responses, and it was felt that such an approach didn’t do justice to the diversity in policy, geographical and organisational aspects. This was all taken up by the MoRRI successor, SUPER MoRRI.

      SUPER MoRRI is one of the EC flagship projects that brings together the EC policies on Responsible Research and Innovation, funded through the H2020 Science with and for Society (SwafS) program. It does so in different ways: continuing the MoRRI train through a significant data collection exercise, doing broad conceptual work through in-depth case studies, and connecting with European and global partners. But first, the consortium felt that they should take the time and go back to the drawing table to reflect on several aspects.

      Reflections on what monitoring and evaluation of RRI is

      In the first blogpost of the SUPER MoRRI series, Wouter van der Klippe discusses the transition from MoRRI to the new SUPER MoRRI project. When we stop focusing on the outcomes of measurements and their accuracy and instead consider the possibilities that monitoring provides, evaluation is set free from producing indicators. Instead, evaluation can be an opportunity to create a space for articulating what is valued and why. Thus, SUPER MoRRI is creating a transformative opportunity that may better equip us to develop more open potential RRI-enriched futures, as diverse and inclusive as were initially hoped for.

      But when we talk about monitoring RRI, is there a consensus on the purpose or even the content of RRI? Roger Strand distinguishes between three policy narratives for RRI in his blogpost. They are portrayed in a slightly caricatured way and exaggerate the differences. The first policy narrative is: “How do we regain control over the runaway train of science and technology before it totally destroys our world?” Some hope that RRI will enable society to speak back to science and help shape research agendas and ultimately research trajectories so that they will lead to outputs and outcomes that are beneficial to people and the planet. The second, opposite narrative is: “How do we educate, reassure and calm down the ungrateful public and make them trust us, trust science again?” RRI, and especially the so-called RRI “keys” of the EC are better fit for the purpose of providing accountability and legitimacy to calm down the citizens and argue that everything is in order. The third policy narrative sees the world of science, technology, and society as a set of entangled networks that are increasingly in need of mutual collaboration and communication. Here RRI is seen as a way to improve collaboration across silos and promote thinking outside of the box. Therefore, it is important to be aware of such plurality of desires for RRI when working for SUPER MORRI.

      In the third reflection, Paula Otero Hermida describes the difference between monitoring science and monitoring innovation. In science, there is a wide set of indicators and periodic monitoring efforts on e.g. gender aspects. As the main reference, there are the She Figures reports (European Commission) as well as indicators in the main RRI monitoring initiatives at the European level. However, when looking at the monitoring of innovation, it seems that the current paradigm ignores who (and in which conditions) innovates, but rather focuses on the firm’s environment and systemic variables. It is hence important to realise which data are not available: there are no data on the human factor in the innovation surveys. That means we can find data regarding innovation’s investment and firms, but there are limited data available on the sociodemographic traits, labor conditions, or other factors regarding the actors that are innovating themselves. Therefore, there are no data on gender in the case of the OECD, EUROSTAT nor in the innovation survey carried out by the Spanish National Institute of Statistics. When data is not collected or available, it is important to be aware of gender and other diversity aspects, and include it in the monitoring framework to make it explicit.

      SUPER MoRRI’s principles

      When we do monitoring and evaluation of RRI, we would like ourselves to be responsible too! That is reflected in the strategic plan that emerged from the internal conversations. Richard Woolley describes our principles in the SUPER MoRRI strategic plan. The consortium’s conceptual view on RRI takes engagement among diverse constellations of actors as the key driver of enhanced responsibility in both research and innovation and would increase consideration of relevant environmental and societal uncertainties. The monitoring framework will provide interested stakeholders with resources that can help them to plan and progress toward more responsible practices and strategies. This will be done on the basis of a ‘responsible quantification’ approach in which data and information are presented, and made interpretable, in appropriate ways. A related conceptual innovation is what we call ‘credible contextualisation’. This is the idea that any indicators we develop should, first, pass through a co-creation phase with potential users, and second, be accompanied by guidance on the degree of interpretive ‘stickiness’ of the indicator.

      Three years into the project, the two principles still stand and are applied as further elaborated by Richard Woolley in a blogpost. Transforming these principles into a framework presenting SUPER MoRRI indicators in three components: an indicator fiche; a description of potential interpretive models; and complementary information to support user understanding and interpretation of the indicator. In the case of new RRI indicators, the interpretive model will explain the rationale for the creation of the indicator and how it is perceived to support RRI. For indicators that are time-series – or have the potential for future replication to create time-series – the model describes what a change in the indicator can be reasonably understood to mean. Further information is provided to try and ensure the credible contextualisation of the indicator. Involving users in the development phase of the indicator also helps to guide the design and production of these supporting elements as work progresses.

      Putting the monitoring framework into practice

      How to operationalize then the data collection in a responsible way? Moving away from surveys and analysis at the country level, instead, we focus on the organisational level. In a blog post, Massimo Graae Losinno explains how SUPER MoRRI has engaged a panel of Country Correspondents. The monitoring activities cover all EU countries, Norway, and the UK. For each of these 29 countries, a Country Correspondent contributed to data collection and reporting. Country Correspondents were chosen on the basis of their expertise in social science methods, their knowledge of the national research and innovation system in their country of residence, and their familiarity with RRI and monitoring. The Country Correspondents are responsible for conducting interviews and document analyses in relation to studies examining 55 Research Funding Organisations (RFOs, 2 per country) and 142 Research Performing Organisations (RPOs, 4-8 per country) in their respective countries. With this approach we build upon local knowledge and qualitative methods across diverse political, cultural, and social settings, as well as diverse research and innovation environments.

      The substantial qualitative data collection effort of the Country Correspondents is complemented by the repeated collection of secondary data that were presented in MoRRI as well, and hence provide timeseries. In the first monitoring report (i.e. D2.2), secondary data on R&I expenditure, patent applications, labour market participation (gender equality), bibliometric data on open access, and Eurobarometer data are presented in a responsible way. The second and third monitoring reports are available shortly from the SUPER MoRRI website. Here the results of the RFO and RPO studies are included, which provide for the first time extensive organizational level data.

      From the beginning, SUPER MoRRI aimed to create impact by connecting to other funded SwafS-projects on RRI-related topics. And the wish from the EC to take a global perspective on responsibility too, has been implemented through the Global Satellite partners and the annual events we organized. This will be described in the second blog post on SUPER MoRRI’s European ecosystem and global network.

      ]]>
      Ingeborg Meijer
      Dreaming at CWTShttps://www.leidenmadtrics.nl/articles/dreaming-at-cwts2022-10-18T10:30:00+02:002024-05-16T23:20:47+02:00What happens when you bring together the CWTS team and let them dream into the blue? Five visionary project ideas! From a New Society-Science Collaboration to the Participatory Activists Network or the enigmatic GRRASS: nothing was unthinkable.At CWTS we are currently working on the development of our new knowledge agenda, a strategic plan for our center for the next six years. As part of this process, we are having lots of discussions, both internally within our center and with external colleagues and experts. While it will still take a few more months before we can share the outcomes of this process, we can already provide some impressions of the types of ideas we are discussing.

      On September 15 and 16, the CWTS team got together in a hotel in Leiden for a two-day retreat. On the first day, we discussed the preliminary plans for our new knowledge agenda with a number of external experts, who offered very useful feedback and helped us broaden our horizon. On the second day, we challenged ourselves to think big and to develop ‘dream projects’ that CWTS could work on in the coming years. We formed five groups, each consisting of five or six CWTS colleagues, and each group spent a few hours developing a dream project.

      Dream projects

      One group proposed to set up a Global Responsible Research Assessment Support Station (GRRASS). The ambition of GRRASS is to bring together all stakeholders worldwide interested in making research assessment more responsible. GRRASS would consist of a global network of satellite organizations on each continent, each helping to mediate between regional and global level activities and issues. Together, these sites would aim to develop standards for responsible research assessment and organize accreditation in which the compliance of institutions with these standards is evaluated.


      Another group proposed the New Society-Science Collaboration. This proposal builds on partnerships that CWTS has established in different parts of the world, through existing initiatives such as the SUPER MoRRI project. Supported by Unesco, the created network would be used to develop projects in a co-creative way, meaning needs-driven, with awareness of diversity and equality aspects. That would include partners that are, for instance, geographically diverse, but also originating from all helices of the quadruple helix: academia, policy, industry and citizens. The objective is to expand and foster the network through activities. In mixed methods, where the non-digital contexts prevail, CWTS could bring in new digital methods including diverse data sources and advanced mapping approaches.


      A related idea was developed by one of the other groups. This group proposed to set up a Participatory Activists Network. This network would focus on helping bring together activists who are pushing for change in the science system but who are not formally involved in decision making in scientific organizations. Contributions by CWTS would initially be situated with specific actors in the network (e.g., around evaluation), but eventually our participation would be present across the network, working closely with a variety of activists.


      Another dream project aimed to eradicate scientific misinformation from societal debates. Using a combination of quantitative and qualitative methods, the project would systematically map interactions between science and society. By making science-society dynamics visible and comprehensible, the project envisions to empower academic and societal stakeholders to mitigate misinformation and renew trust in science.


      The final dream project is the Open Comprehensive European University Research Information System (OCEURIS), an open CRIS system for all European universities that will contain information deemed necessary by many institutions to realize the ambition of making their research assessment processes more responsible. The aim is that in the next five years at least half of the European universities will join OCEURIS.


      Employee of the Year Award

      Besides dreaming about future projects, we also used the opportunity of being together at our retreat to celebrate some of the work currently being done at our center. Each year an Employee of the Year Award is handed out to a CWTS colleague who deserves special recognition. This year the award turned out to be a little bit different than in earlier years. To acknowledge the importance of teamwork at CWTS, Ingeborg Meijer, last year’s awardee, decided to hand out the award not to an individual colleague but to a team. The award was given to the A-TEAM, which performs a crucial task at CWTS by performing high-quality curation of the data in our bibliographic database system. Congratulations to all members of the team for this well-deserved award. Thank you for taking such good care of our data!

      What’s next

      Have we just been dreaming at our retreat, or are we actually going to make our dreams come true? We believe the process of developing dream projects is valuable in itself, even if ultimately a project is not going to be realized. Developing dream projects stimulated us to think in less conventional ways than we normally do and to find out what we are truly passionate about. Time will tell whether we will manage to find ways to make our dreams come true. Stay tuned for further updates on the development of our new knowledge agenda!

      We are grateful to our CWTS colleagues for sharing their dreams and contributing to this blog post.

      ]]>
      Ed NoyonsLudo Waltman
      Cocreating science that society needs: introducing the EXPLORE approachhttps://www.leidenmadtrics.nl/articles/cocreating-science-that-society-needs-introducing-the-explore-approach2022-10-05T10:30:00+02:002024-05-16T23:20:47+02:00How can local knowledge production help regions to create more sustainable and inclusive societies? This post will delve deeper in how we combined the core concepts of Responsible Research and Innovation (RRI) and smart specialisation and how this developed into the EXPLORE methodology.The EXPLORE methodology was developed in the context of the two territorial RRI projects CHERRIES and RIPEET (H2020) that CWTS is participating in since 2020. It can assist territories in developing more innovative, inclusive, and self-sustaining R&I ecosystems by ensuring bottom-up involvement of all kinds of local stakeholders and citizens. This blogpost follows up on the first RIPEET CHERRIES blogpost that explains what these projects are about and what CWTS has learned from working at the science-society interface.

      RRI & SMART Specialisation

      The core concept in both projects is RRI. This policy approach anticipates and assesses potential implications and societal expectations with regard to research and innovation, with the aim to foster the design of inclusive and sustainable research and innovation. It implies that societal actors (researchers, citizens, policy makers, business, third sector organisations, etc.) work together during the whole research and innovation process in order to better align both the process and its outcomes with the values, needs and expectations of society. In practice, RRI is implemented as a package that includes multi-actor and public engagement in research and innovation. RRI thus enables easier access to scientific results, the take up of gender equality and ethics in the research and innovation content and processes, and formal and informal science education. RRI actions such as fostering co-creation and demand driven R&I in an open and responsible way can be a complex matter due to the plurality of actors involved and the socio-cultural divergences between the different geographical areas in Europe. However, it can also be a great opportunity for growth if it is done effectively. However, neither the theory, policy nor practice of RRI pays attention to the spatial dimension of research and innovation processes. As a consequence, RRI practices often ignore the various ways in which regional context affects not only the development of innovation but also the perception of what is responsible and socially desirable.

      Smart Specialisation’ is an innovation policy concept intended to promote the efficient and effective use of public investment in research. Its goal is to boost regional (territorial) science and innovation in order to achieve economic growth and prosperity, by enabling regions to pursue new developments by making use of their local strengths. It has been gaining importance for innovation policy because of the role of proximity and the presence of knowledge-related institutions in associated fields are thought to have a positive influence. Thereby, the smart specialisation strategy (RIS3) programme is the most ambitious and endowed approach of EU-funded territorial innovation policies so far. However, the potential implications and societal expectations with regard to research and innovation have often been ignored in the smart specialisation discourse and the entrepreneurial development process that should support S3.

      The European Commission recently launched the new smart specialisation policy framework; S4. S4 specifically focuses on sustainable innovation, which aims at demand driven social innovation that should bring long lasting systemic changes and green innovation to the European regions. This requires not only a well-designed priority portfolio tailored to the region, but also active participation from regional actors and a regional learning process. The concept of regional participation, experimentation and initiatives to achieve desired social transformative change originates from the third frame of innovation policy, regarded in literature as the most recent paradigm in which to view innovation policy (distinguished from two earlier framings related to R&D and national systems of innovation). These social transformations that S4 targets are often very complex with many stakeholders involved, take place on different levels of society and are of systemic nature. Therefore, S4 calls for a directional systemic approach in which a diverse set of local actors determine the directions to take collectively. To support regions in this process, methodologies, tools and workshop formats have to be developed to guide regions in for instance stakeholder engagement, regional mapping, target setting, working backwards from goals, and reflection and evaluation. The European Commission is working on the S4 Playbook in which these type of approaches are collected to assist the regions here. Although a helpful support, regions will likely differ a lot in their nature, needs and questions, which means that often a case to case assessment is required.

      RRI X SMART SPEC (S4)

      It is especially in S4 that smart specialisation and RRI can be well aligned, given that both concepts address demand driven, social and inclusive developments in a participatory process involving regional actors. Combining the two concepts has the potential to better align research with local societal demands and to bring new research insights to society more effectively. This combination is a new one that CWTS has implemented in both CHERRIES and RIPEET by conducting a mixed method approach. On the one hand regional data was collected on scientific output, technological development, actors and policy programs. On the other hand regional discussion groups were organised in which all types of regional actors could voice their innovation needs and ideas as well as comment upon the collected regional data. This was very much an iterative process in which we went back and forth between the data and regional actors multiple time. Nevertheless, in the end we ended up with a comprehensive overview of the regional innovation ecosystem of which the data was screened by regional actors and in which the societal needs voiced by the regional actors could be evaluated by the regional data.

      Expertise at CWTS

      CWTS is very well positioned to conduct this type of analysis, as it had expertise in multiple related areas. In the first place CWTS is a mixed method institute with both quantitative and qualitative expertise, which fits this type of analysis well. It also has been involved in many related projects focusing on topics like the sustainable development goals (STRINGS), participatory processes (Knowledge Ecosystems), scientific and technological data analysis (RISIS), innovation dynamics (H2020 projects) and development of a monitoring framework for responsible R&I practices (SUPER MoRRI). An approach that combines these elements enables CWTS to put its knowledge and expertise in practice and support transitions that benefit society. Moreover, participating in such projects helps to align the research conducted at the institute with present-day questions that arise in societal, scientific and policy communities.

      EXPLORE

      In order to facilitate local knowledge production and experimentation that help regions to create more sustainable and inclusive societies, CWTS recently launched the EXPLORE (EX(ploring) P(articipatory) L(ocal) O(pen) responsible R(&I) E(cosystems) methodology. As the acronym suggests, it combines the fundamental building blocks of RRI and S4 into an accessible R&I approach. We do this by integrating heterogeneous elements like group workshops, process evaluation and territorial mapping under the same methodological umbrella in a modular format. This modular format enables us to select the specific elements that a given territorial societal demand requires, thus making the approach very flexible to any kind of territory or challenge. Moreover, this approach helps to avoid the “one policy fits all” pitfall by enabling a bottom-up approach and taking the region specific situation as the starting point of each assessment. The EXPLORE methodology enables CWTS to be more involved in local and regional experimentation and innovation, the co-creation of new priority targets and policy mixes, the monitoring and evaluation of these processes, and social transformative change in general.

      What includes EXPLORE

      The modular building blocks in EXPLORE can be stored under three main important innovation processes: Mapping, priority setting & transition process and monitoring & evaluation (M&E).

      Firstly, EXPLORE can help territories to get an overview of their R&I landscape by offering different mapping analyses. This is an important understanding for governments and societal actors alike, because it provides the basis from which new plans, strategies, experiments and innovation in general can be developed. Among these analyses are for instance stakeholder discussion sessions that identify barriers and opportunities in the R&I system together with the local actors. Also the policy landscape can be analysed to identify what opportunities for experimentation already exist and where gaps may be found that should be addressed. Lastly, EXPLORE also offers extensive data analysis of the regional knowledge landscape based on publication and patent output with visualisations that show in a glance where the relative capabilities of the territory are located in a given innovation field. One such approach is the Science Landscape, as shown below for the energy field in Extremadura.


      Secondly, EXPLORE can also assist in priority setting and in the transition process itself. The included tools help government and local actors to make difficult choices, approach complex challenges outside their usual scope and initiate experimentation. It can provide hints for prioritisation compliant to the smart specialisation rationale based on local knowledge data analysis that should then be combined with local actor input. It provides further assistance tools by a wide variety of workshop options to get closer to the desired priorities and outcomes. Among these are for instance workshops that structure the local needs present, visioning workshops that constitute a vision of what could be achieved and backcasting exercises that work out how to get to a desired future. In all these workshops participants are challenged to keep an open mind, local actors are heavily involved and exercises are flexible to adhere to the local context.

      CHERRIES Policy Labs session in Brussels (May 2022)

      CHERRIES Policy Labs session in Brussels (May 2022)

      Lastly, EXPLORE can assist in the monitoring and evaluation of ongoing prioritisation and experimentation. Monitoring and evaluation is crucial in every innovation process, as it checks whether the process is on track to reach its desired goals, participating actors are still on the same page and makes sure that the right changes can be made on the fly in a dynamic process. EXPLORE includes a wide spectrum of activities that can be deployed in this regard. These range from short and frequent like monitoring discussions or expert and stakeholder interviews to more intensive like on-site monitoring visits and impact workshops. M&E is guided by evaluative conversations rather than following up a set of indicators. The impact workshops can be general, but can also be more specific on a certain aspect where impact is challenging or highly desired to reach more specific feedback and results.

      Conclusion

      In a nutshell, with EXPLORE CWTS wishes to make the valuable insights of S4 and RRI more accessible and easier to apply in a practical context. This will give territories a stronger basis to develop successful and sustainable initiatives that serve society. Combined with a participatory transition process this has the potential to open more opportunity for experimentation and social initiatives. Hopefully, this will accelerate the transformation that all territories in Europe desperately strive for while strengthening local interests.

      ]]>
      Ingeborg MeijerTim WillemseSonia Mena JaraAnestis AmanatidisTjitske HoltropGaston Heimeriks
      University technology transfer: 'it's not a business, but run it like a business‘https://www.leidenmadtrics.nl/articles/university-technology-transfer-its-not-a-business-but-run-it-like-a-business2022-09-28T09:56:00+02:002024-05-16T23:20:47+02:00Technology transfer from universities can be intricate. The roles – and perceptions – of researchers, universities, and companies alike need to be considered on the way from ideas and inventions to innovation and investments. But in the end, it may just be a question of “Einstein or Columbus?”I’ for invention

      Academic researchers and inventors are explorers – boldly going where no one has gone before. Most people agree on this. However, the relevance of their discoveries or breakthroughs is perceived very differently by different groups, at least when it comes down to technology transfer of that invention from universities to companies. Is the discovery the work of the singular individual, the spark of genius and deep matter expertise that shed light on what would have otherwise remained in darkness – the ‘Einstein’ type of explorer? Or is the discovery like making landfall on a distant shore, a shore that this just a small part of potentially an entire continent, the exploration of which will require effort and time by many – the ‘Columbus’ type?

      The four I’s

      In university technology transfer settings, the key interactions and patent licensing negotiations between the university and company usually evolve around the patented invention. The university researcher works from idea to invention and company R&D departments pick up the invention and turn it into innovation. This invention, often laid down in a patent application, is a central element of the transfer. Although the patent is arguably often the capstone for the know-how and commitment of the inventors, it plays a central role in university technology transfer. Granting a company access to such an invention, through a license or some other arrangement, is one of the defining transactions in technology transfer and often a bone of contention for many involved, researchers, technology transfer managers, entrepreneurs, and investors.

      These people, usually overseen by the respective executive management layers, are the negotiation parties that have to strike the arrangements that result in the intended transfer. That is not always a smooth and straightforward process: their different backgrounds and goals lead to asymmetric information distribution, misunderstandings, and friction. Even the corporate R&D staff are prone to this, as the context in which they operate is very different from academic research environments. The difference is not the science underlying all their work but the processes, aims and structures of the organizations that drive and aim their work. The researcher’s place in their respective organizations, and their R&D objectives, sets them apart when it comes to role, goal and responsibility within the tech transfer negotiation processes.

      Such fundamental differences in perspectives between universities and companies are not always fully recognized, which also play out at the negotiation table. Take for example terminology. Although the term ‘R&D’ is used by both sides to describe their work, the actual activities will differ markedly. Moreover, a lot of university researchers will claim they are ‘innovating’ but their use of this catch-all term refers to ‘newness’ in general, rather the more apt definition of an innovation in economic settings and the business sector: producing a ‘new or improved product or process for the marketplace’. In other words, innovations are produced by industry and it is the company that creates significant economic value – not the university.

      Three more I’s

      To better understand the complexity of university technology transfer it is important to understand the ‘human factor’ dimension, especially the role of the university researcher who has made the invention. Most researchers or professors at a university lack extensive direct experience with industry R&D or business practices. Similarly, the colleagues of the company researchers are usually not very familiar with the culture and processes at a university and struggle to understand the university and its peculiar ways.

      This university researcher, the Einstein, not only came up with the idea but also contributes in-depth expertise on the topic and access to a network of other experts. Especially in the case of a first patent application, and the tentative nature of the new invention, the company wants her to be part of their corporate R&D process. Such inventors may not see themselves as subordinates to university management and transfers of researchers (and their grant funding) is common; their interests and perspective may not align with the university’s perspective. However, the university owns the right to the invention, making them an inseparable part of any tech transfer arrangement with the company.

      Consequently, ‘I, the researcher’, ‘I, the university’ and ‘I, the company’, often have to enter into what amounts to a trilateral relationship within license negotiation positions.

      It takes two to tango, but three can be a crowd

      Research shows that these three groups tend to have strong opinions of each other, owing to their different perspectives, objectives and interests. Where the university and technology transfer managers see themselves as brokers, the researchers lament their lack of technical expertise, while the companies complain about the lack of market acumen. The researchers consider their invention the crucial link to new, innovative products, while the company sees one of multiple routes to a new product, and the university sees a publicly funded asset to be exploited. Managing the financially risky development process by the company is perceived by entrepreneurs and investors as a complex step towards innovation, while the researcher sees a straightforward path from ‘invention to innovation’, and the university may want to avoid a PR risk in being seen as perhaps too involved in commercial activities rather than its two core institutional missions (education and research). The organization’s structure and culture impact the perception of management and authority. Large organizations, be it corporates or universities, operate on different speeds compared to eager startup companies and enterprising individual professors.

      All of this leads to different views between the three ‘I’s’ engaged in the negotiations on tech transfer rewards and risks. The difference between ‘Einstein’ and ‘Columbus’ is the negotiated compensation. The former is an individual of unique creativity, the latter is a team player who reached his goal because through perseverance that. The value of a unique idea versus the first step of a long and winding road is different. The role and importance of university technology transfer for all of the ‘I’s’, from the professor’s idea and the company’s innovation is an important value-creating trajectory; for the university it is perceived to be a tertiary function at best and one that comes with PR risks. Think of, for example, a professor suddenly the proud owner of an expensive car paid for by income generated from university technology transfer.

      While one can lament the university‘s risk-averse culture and the friction it may create for university technology transfer, the challenge-driven academic research culture also fosters creativity, independent thought and critical thinking – traits that are highly valued in Western society and values that universities are expected to teach their students. Students who may also find employment in those same innovative companies. The duality of culture that makes it difficult to cross the ‘public/private’ divide and collaborate with companies in the private sector, but also worthwhile in terms of economic gains and societal benefits. Of course many sensible people recognize that finding a middle ground is necessary and crucial. As Lita Nelsen, the former Director of the MIT Technology Licensing Office, noted on the nature of tech transfer: “It’s not a business, but run it like a business”.

      The I in information gap

      But what does that mean; to run it like a business? To make university technology transfer processes more efficient and effective, it is important to move beyond generalized opinions and misperceptions. Practice does not make perfect, but accumulating experience in tech transfer offers guidelines and creates valuable expertise for practitioners. But to really improve university technology transfer, some issues need to be made more explicit and information gaps need to be filled in order to have the I’s come together.

      Crucially, it is important to move beyond the general understandings of technology transfer negotiation processes into the nitty-gritty specifics of those interactions. Detailed analyses may generate new insights that can not only benefit new entrants in tech transfer, but also inform experienced practitioners on both sides of the fence – both companies and universities. This is the topic of ongoing research which takes individual cases as a starting point. Looking into the perspective of all the ‘I’s’ of a patent licensing negotiation. It aims to identify the intentions, perceptions and the information gap between the various negotiating parties and their stakeholders. To test hypotheses based on those case studies a survey has been designed which will be distributed in October among interested parties through a variety of networks.

      This blog post is part of my ongoing PhD study at CWTS, which is supervised by Prof. Robert Tijssen and Prof. Sarah de Rijcke.

      ]]>
      Ivo de Nooijer
      CHERRIES and RIPEET: CWTS traveling the Science - Society interfacehttps://www.leidenmadtrics.nl/articles/cherries-and-ripeet-cwts-traveling-the-science-society-interface2022-09-22T10:00:00+02:002024-05-16T23:20:47+02:00This blogpost presents how CWTS got involved in two H2020-funded projects, CHERRIES and RIPEET, what they are about (territorial RRI), what we have learned from it, and what our contribution was (and still is) to developing interactions between science and society.Looking back

      At the STI conference 2018 in Leiden, two strands of work at CWTS, the Responsible Research and Innovation (RRI) work in the MoRRi project, and the regional knowledge patterns for innovation, got together. We realized that RRI (demand driven, contextual engagement in R&I) and the policy to focus on regional strength (smart specialization) could be complementary and should be developed in a concerted way in regions. This happened to be the topic of the Horizon 2020 Science with and for Society (SwafS) 14 call on ‘Territorial RRI’. In 2020 (CHERRIES) and 2021 (RIPEET) two H2020 3-year territorial RRI projects were granted, in which CWTS is partnering.

      CHERRIES and RIPEET

      CHERRIES is about experiments in Responsible Healthcare systems. The main question is how CHERRIES experiments can help investigate opportunities and challenges that are associated with the role of need and demand within the healthcare sector. CHERRIES has 11 partners from 7 European countries – Austria, Belgium, Italy, the Netherlands, the Republic of Cyprus, Spain and Sweden. Coordinated by ZSI (AT), the consortium brings together heterogeneous actors of the innovation ecosystem, including small and medium enterprises, research institutions, universities, territorial authorities, a hospital and a Civil Society Organisation to collectively reflect on and design policy experiments around enabling Responsible Research and Innovation (RRI) in the healthcare sector in three European territories: in Murcia (ES), Örebro (SE) and the Republic of Cyprus (CY).

      RIPEET is about Responsible energy transition policy experiments. The purpose of RIPEET is to support territories in establishing experimental spaces to address the territorial dimensions of the European Green Deal. RRI-based Transition Labs will create collective stewardship of the territorial energy future via participatory instruments and serve as a framework for envisioning sustainable energy futures. RIPEET has 11 partners from 7 European countries – Austria, Belgium, Finland, Italy, Netherlands, Spain and the UK. Coordinated by ZSI (AT), the consortium brings together quintuple helix actors (policy, industry, academia, civil society and the environment); the team is highly inter- and transdisciplinary, building on long lasting experiences in RRI, territorial innovation and smart specialisation strategies and energy policy and research. The (RRI) policy experimentations for energy transition is investigated in three European territories - in Extremadura (ES), Highlands and Islands of Scotland (UK) and Ostrobothnia (FI).

      In the remainder of the blogpost we will introduce:

      1. The CHERRIES model, and where RIPEET is different;
      2. The tasks that CWTS is involved in based upon our expertise;
      3. The learnings of CWTS on working at the science-society interface;
      4. What we do different in RIPEET, and how our work has developed into a methodology, EXPLORE, which will be described in more detail in our next blogpost.

      The CHERRIES Model

      The CHERRIES team aimed to mobilise territorial stakeholder ecosystems and engaged them into regional pilot actions, applying an RRI framework. The pilot actions include:

      1. identify needs in the healthcare sector at territorial level (through a call for needs);
      2. encourage the proposition and co-creation of innovative solutions to the identified needs (call for solutions);
      3. stimulate institutional reflection processes on how to innovate products and services in the healthcare sector through participatory approaches;
      4. present evidence-based recommendations for revision of sectoral policies, strategies and innovation support instruments.

      The CHERRIES model (below) is based upon co-creation activities with stakeholders, and testing in the regions. The model works well to effectively develop targeted innovations and provide legitimacy and motivation through inclusion and engagement. However, it still lacks strategic directionality and misses anchoring in regional processes.


      In the figures below, the topics of the healthcare innovation in the three CHERRIES regions are depicted. Each of these pilot actions as such is carried out by local actors in a democratised fashion.


      RIPEET follows a largely similar approach with some changes. In RIPEET, the regions each form a so-called Transition Lab, which is based on the evolutionary model of socio-technical transitions (Geels and Schot, 2007). The Energy Transition Labs (ETL) aim to set up spaces for learning, interaction and interconnection between key actors (government, civil society, industry, academia) to collaboratively produce knowledge about the current problems of the energy sector, the preferred future scenarios, and possible strategies to achieve a sustainable vision. It includes joined reflection, visioning, and back casting before arriving at the needs identification and call for solutions which was just launched (September 2022).

      CWTS tasks in CHERRIES and RIPEET

      In CHERRIES, the role of CWTS is on tasks where the project can benefit from our expertise in RRI and regional innovation. We are involved in the mapping of existing local knowledge, qualitative work regarding the local policy mix and the project’s overall impact assessment / evaluation.

      The mapping included a) identification of regional stakeholders in healthcare, research, policy, and industry; b) collecting (national and regional) policies on smart specialisation, RRI aspects (including those reflecting the RRI-keys, such as Public Engagement, Ethics, Open Access, Gender Equality, Science communication and governance) and healthcare innovation; and c) mapping of regional science and technology strengths based upon bibliometrics and project analysis. The rationale for the latter being that regional innovation benefits from local strengths.

      The policy approach in CHERRIES departed from the idea how technological change (invention, innovation, diffusion) is faced with multiple market, system and institutional failures and thus requires multi-faceted policy interventions (Weber and Rohracher, 2012). A policy mix which combines several policy instruments would be the response to this challenge. However, during the project, the interactive sessions with the regional partners on policy revolved around two major, related, issues that are prerequisites for developing appropriate policy mixes: How can we develop arenas for deliberation that bring together stakeholders from different backgrounds to allow them to discuss policy jointly, and how can we make the pilot actions sustainable? As with many projects, there is no answer to what comes after the pilot.

      The monitoring and evaluation (M&E) is currently ongoing. The focus is on M&E of the territorial experimentations led by the local partners and the overall impact assessment of CHERRIES as a project. In addition, M&E activities take into consideration the translational abilities of an interventionist project like CHERRIES locally and the changes these can trigger. Hence, M&E is both inward and outward looking. It builds upon systematic collection of information in bi-monthly evaluation sessions with the regional partners on how implementation of smart specialisation and RRI is taking place, complemented with a site visit and evaluative conversations with stakeholders beyond the regional partners to assess how CHERRIES may have affected or even changed local policy and practice.

      In RIPEET, CWTS is involved in similar tasks.

      The learnings of CWTS on working at the science-society interface

      Since 2014, CWTS is involved in Responsible Research and Innovation (RRI), through a range of activities and H2020-funded projects (e.g. MoRRI, NewHoRRIzon, SUPER MoRRI) bringing together R&I partners across Europe knowledgeable on RRI from different perspectives. Often these partners are universities, research institutes or not-for-profit research organisations, for which ‘the project’ is an instrument to do research whilst engaging with others in the field. In CHERRIES, 3 partners represent such a research background, of which CWTS is one. The aim of the RRI projects funded through the (SwafS) programme from an EC perspective is to bring RRI to the region, or to implement the European-oriented RRI policy in regional contexts. One of the major learnings is that there is a big gap between ‘a policy’ (RRI in this case) and bringing it to life in actual research and innovation practices. While co-creation is put central, projects such as CHERRIES and RIPEET require translation between the stakeholders involved and their diverse needs and wishes and the researchers in the projects. Stakeholders occupy different worlds and want and need different things from our projects. It is important to become aware of this diversity. Drawing on Michel Callon’s sociology of translation, several challenges needed to be addressed in the ‘problematization, involvement, enrollment and representation’ in CHERRIES: Who actually defines the regional healthcare problem? Project partners, stakeholders, funder?​ When involving and engaging with non-academic stakeholders: who takes ownership of processes, what are power dynamics and how do we include diversity?​ And thirdly, how do we translate projects into representative and effective narratives and indicators, that fit with the local needs and contexts. One of the major conclusions is that RRI as a policy when put into practice is operationalized differently in different contexts, and that these contexts should lead the way. The action research approach we eventually developed around evaluative conversations works well.

      What we do different in RIPEET

      Whilst CHERRIES and RIPEET are different in their topic (healthcare and energy transition) and regional partners, they are similar in their set-up and approach. Because we started with RIPEET exactly a year later, we at CWTS were able to improve how to connect our contribution to the rest of the project. This was particularly relevant since in CHERRIES we realised that preparing a mapping, including bibliometrics, goes well beyond the interest and understanding of the partners. In other words, to make our contribution useful for our partners and beyond, we as well should translate the needs and adjust our work. In RIPEET, we therefore worked much more demand-driven, leaving the lead to the regional partners, as the mapping should serve their purpose, and not necessarily our own ideas. So the mapping exercise became an integral part of the Transition labs, and was co-created with the local partners. Interestingly, the joint mapping, in an iterative process, resulted in partly similar topics of attention (CWTS and region), but also additional ones that were shaped by local context and needs, and also, types of partners involved in the process. As such, the ownership of the mapping process was better accounted for.

      Our work, combining mapping and evaluative conversations to serve both RRI and Smart Specialisation (a regional innovation policy) has developed into a methodology, EXPLORE, which will be described in more detail in our next blogpost.

      In conclusion, the territorial RRI projects have allowed us to travel and explore the science-society interface by engaging with local non-academic stakeholders from the start; to become embedded action researchers in a co-creative process, and to realise that it takes a lot of effort to bring science out of its own world to society.

      ]]>
      Ingeborg MeijerSonia Mena JaraAnestis AmanatidisTim WillemseGaston Heimeriks
      SciCon 2022: A look at Decentralized Sciencehttps://www.leidenmadtrics.nl/articles/scicon-2022-a-look-at-decentralized-science2022-09-19T10:30:00+02:002024-05-16T23:20:47+02:00In July 2022, the first SciCon took place with the aim of connecting the metascience community with the Decentralized Science movement (DeSci). This post briefly summarizes the experience and introduces DeSci to the reader.The event

      SciCon 2022 has been an online event seeking to bring together members of the academic metascience community and DeSci, to discuss some of the issues that exist in scientific research and highlight how DeSci efforts might contribute to improve the way we do science. SciCon has been organized by one of the leading DeSci initiatives: ResearchHub.

      While the conference included tutorials, community workshops and even a week-long community competition to write new contributions, talks were organized over two days and included a rich set of topics. Several prominent DeSci projects and initiatives were presented, with themes as varied as decentralized medical trials (Azizi Seixas, NYU’s Langone Health), decentralized research centers (Eugene Leventhal, Smart Contract Research Forum), open verifiability and reproducible, on-chain scientific records (Christopher Hill, DeSci Labs), among many more. For the metascience community, Silvio Peroni presented on how to enable reproducible studies through Open Citations, Ludo Waltman introduced the recently launched “Publish your Reviews” initiative, while I presented on the (selfish) advantages of making research data open.

      In their talk, the co-founders of ResearchHub Patrick Joyce and Brian Armstrong further explained the motivation for SciCon and, more broadly, their vision for DeSci. The full program of SciCon and all the talks are available online, I invite you to take a closer look.

      Decentralized Science

      But what is DeSci exactly? On Ethereum.org, we find the following definition:

      In short, projects in DeSci apply blockchain technology to science. DeSci is inspired by the open knowledge movement and related to the open software and open science communities and efforts.

      In a brief period, the DeSci landscape grew substantially on the onset of the general 2021 blockchain and crypto currency boom.

      A recent illustration of the DeSci landscape is provided in the DeSci Wiki(@UltraRare Bio):

      Desci picture1

      The DeSci movement is diverse, yet several biotechnology initiatives stand out, including funding organizations, decentralized laboratories, incubators and more. Molecule is developing a decentralized protocol to fund and manage research-related IP (Intellectual Property) in biotech. Key to Molecule’s approach is the use of blockchains to accelerate funding biotech research and building a marketplace for the generated IP. They recently raised above 12M$ in venture funds for future development. Many more Decentralized Autonomous Organizations (DAOs) also play a prominent role in DeSci. These are communities managed via blockchains, sometimes associated with incorporated entities (e.g., companies), just like Molecule. Another example is VitaDAO, focused on crowdfunding longevity research through the VITA token.

      Scientific publishing also attracts considerable effort in DeSci, especially towards re-designing the peer review system. Science Non-Fungible Tokens (NFTs) are used to record and manage scientific outputs, for example Intellectual Property, reviews and publications. Several initiatives focus on funding research or other forms of commons with a considerable degree of different instruments. Gitcoin Grants fund public commons via Quadratic Funding, an optimal way for crowdfunding public resources within a community. Lastly, it is worth mentioning that some research-focused organizations have also been started with ties, yet not a direct involvement with DeSci. For example, the Astera Institute specializes in frontier research and technology projects (including on metascience) using Focused Research Organizations (FROs) as an instrument to combine the two.

      On this site, we can find an (optimistic) overview of the ways in which DeSci could contribute to improve the scientific ecosystem:

      Decentralized ScienceTraditional Science
      1. Distribution of funds is determined by the public using mechanisms such as quadratic donations or DAOs.Small, closed, centralized groups control the distribution of funds.
      2. You collaborate with peers from all over the globe in dynamic teams.Funding organizations and home institutions limit your collaborations.
      3. Funding decisions are made online and transparently. New funding mechanisms are explored.Funding decisions are made with a long turnaround time and limited transparency. Few funding mechanisms exist.
      4. Sharing laboratory services is made easier and more transparent using Web3 primitives.Sharing laboratory resources is often slow and opaque.
      5. New models for publishing can be developed that use Web3 primitives for trust, transparency and universal access.You publish through established pathways frequently acknowledged as inefficient, biased and exploitative.
      6. You can earn tokens and reputation for peer-reviewing work.Your peer-review work is unpaid, benefiting for-profit publishers.
      7. You own the intellectual property (IP) you generate and distribute it according to transparent terms.Your home institution owns the IP you generate. Access to the IP is not transparent.
      8. Sharing all of the research, including the data from unsuccessful efforts, by having all steps on-chain.Publication bias means that researchers are more likely to share experiments that had successful results.

      While some arguments appear less convincing to me, or at least not clearly benefitting from using blockchain technology (e.g., 2, 4, 7 or even 8), others not only intervene on open challenges in the science ecosystem, but also promise to leverage the strengths of blockchain technology (e.g., 1, 3, 5 or 6). Personally, the areas where I see most promise for DeSci include 1) developing open and distributed infrastructures to track and incentivize scientific outcomes (e.g., reviews and replications), 2) opening alternative sources of funding, and 3) providing a playground to experiment with organization and incentive design in science (e.g., including around publishing and funding).

      ResearchHub, the organizer of SciCon 2022, is a decentralized autonomous organization (DAO) attempting to combine all three of these aspects. Let us take a closer look to further showcase how blockchain technology is being used in DeSci.

      A DeSci organization: ResearchHub

      ResearchHub is a community effort to accelerate the pace of scientific research by making its publication, review and discussion more open and collaborative. The Hub uses a crypto currency (Research Coin or RSC) to incentivize participation. The portal currently supports a variety of science publishing activities including sharing, discussing and reviewing articles, or even incentivizing activities via bounties, such as answering a research question.

      A central feature of ResearchHub is the possibility to upload a research paper (or pre-print) for further analysis, as in this example:

      Desci figure2

      A paper can then be openly discussed, peer reviewed or summarized (like in this case), via an interaction like Reddit’s:

      Fig3

      To know more

      DeSci has so far developed with little input from the scientific community. While the movement is young and sensitive to the broader crypto market sentiment, we can certainly use more experimentation in how we go about doing science. Often, it is easier and faster to think outside of the established system. This means that, while many, if not most DeSci projects might not last, the movement has the potential to develop out-of-the-box solutions to at least some of the considerable challenges currently facing scientific research. To know more, the best way is to check this very comprehensive and up-to-date overview of DeSci initiatives and, if any interests you, not hesitate to get involved. Another option is to get in touch with me: I will be happy to help.


        Disclaimer: The author volunteers as a Metascience editor for ResearchHub.

        Header image: GuerrillaBuzz Crypto PR ]]>
        Giovanni Colavizza
        The disconnection between artificial intelligence engineering research and sustainable developmenthttps://www.leidenmadtrics.nl/articles/the-disconnection-between-artificial-intelligence-engineering-research-and-sustainable-development2022-09-08T10:40:00+02:002024-05-16T23:20:47+02:00Artificial intelligence (AI) has the potential to contribute to solving some of the most pressing societal issues of our time, but to what extent are engineers reflecting on the uses of their technologies for sustainable development, and who is producing the engineering knowledge behind AI?We are witnessing a vertiginous global technological development, but this development is not paralleled with a growing improvement in the sustainable development of the planet. For instance, next-generation computing, air transport, energy production, and more recently the development of 5G technologies, cryptocurrencies - among others - enhance human capacity in certain directions but limit it in others: they increase our dependence on non-renewable sources and increase the inequalities between countries that provide such resources and countries that develop these technologies. If we do not connect our technological development with global priorities – such as the UN Sustainable Development Goals (SDGs), how can we preserve the future of humans and other beings on the planet?

        In our study, we evaluate the relationship between published engineering research and sustainable development and focus on two key points that are getting little attention: 

        • A large extent of AI engineering research papers do not incorporate sustainability goals in their reflections on the development of technology.
        • The extent to which countries have the ability to produce new knowledge on AI, which we refer to as AI engineering research capabilities, are being increasingly concentrated on powerful countries, leaving the scientifically marginalized countries with little room to define the directions of AI and assess the implications of AI research.

        In this blog post, we show our findings that support these observations.

        On the first point, given that technologies can be used in different ways and that academia is one of the main engines for their development, it is necessary for academia to motivate critical thinking and reflect on the potential uses of technologies. However, we found that sustainable development issues are little addressed in global engineering research, specifically in artificial intelligence We found that it is not common to find researchers' reflections on the impact of their inventions on the planet in AI publications, as well as their potential uses to achieve the SDGs by 2030. Out of 220,000 engineering articles indexed by IEEE Xplore on AI published from 2000 to 2020, only 8% to 30% approximately -depending on the engineering discipline- discuss issues related to their contribution to sustainable development.

        Those disciplines that discuss sustainable development in more than 20% of their production focus on cognitive and cooperative systems, prediction methods, decision support systems, and computation theory. Other disciplines, such as learning systems, bio-inspired computing, and autonomous robots, which are crucial for sustainable development, discuss it to a much lesser extent (see figure 1). 

        While it can be argued that entrepreneurs and other parties will find applications of these technologies to sustainable development, scholars such as Yuval Noah-Harari have warned that what drives the development of AI is not an ambition to solve our main societal issues, but rather increasing profits and surveillance of the population. We contend, then, that at a time of planetary crisis we need more awareness and commitment of engineers to help envision applications for solving the major challenges of our time. Not engaging in the potential uses of technologies poses a risk of a disconnection between AI engineering research and these societal issues, leaving the development of these technologies to the forces of the market and state control.

        20220906 picture1
        Figure 1. Percentage of papers within the Computational and Artificial Intelligence category in IEEE Xplore database that address SDGs, classified into Artificial Intelligence, Neural Networks, Computational Intelligence, and Logic.

        On the second point, we found a disproportionate concentration of AI engineering research capabilities in a few dominant countries. This means that in terms of power, AI research follows the traditional pattern of most technological developments, which is increasing the already huge technological gap between “centers” and “peripheries”. The following figure shows the global co-authorship patterns of AI engineering research, in which most countries involved are traditional scientific powers while the rest seem to play a very minor role.

        20220906 picture2
        Figure 2. Co-authorship of AI papers in Engineering, network of countries*

        * Nodes positions attempt to preserve the location of countries in the Mercator projection of the world map. Size and color indicate betweenness centrality; only countries in the top 10 percentile by betweenness centrality are highlighted. 

        If this trend of concentration of engineering research capabilities – the extent to which countries can produce new knowledge - continues, how can it be ensured that all countries have a voice and can act on the development of AI technologies? Additionally, to successfully regulate these technologies, research capabilities are pivotal. Lacking such capabilities means that potential regulations, such as limitations to data collection, manipulation, and algorithm biases, may not be ensured because of a lack of infrastructure to reproduce research results and technologies, and a lack of local expertise to audit them.

        A hopeful finding in our article is that sustainable development is increasingly being discussed in certain AI-related engineering disciplines. We identified Broadcast technology, Systems Engineering and Theory, Ultrasonics, Ferroelectrics, and Frequency Control, Sensors, and Education. Specifically on AI subjects, we found emerging discussions of sustainable development in Recurrent neural Networks, Prediction Methods, Computation Theory, Learning Systems, and Machine learning. We believe building on these emerging interests can help to educate engineers that are more concerned with their natural and social environment. 

        However, to foster the relevance of AI research for sustainable development, capabilities need to be built in those countries that have traditionally been marginalized. A decisive and generous approach to international collaboration and knowledge exchange needs to be supported and fostered by multilateral organizations such as the OECD and the United Nations if contribution of AI research for sustainable development -leaving no one behind- is to be achieved. 

        Given that power is in the hands of a few countries, coordinated programs and funding in regions such as Latin America and South Saharan Africa need to be developed and maintained over the long-term if these regions want to exert real influence on the global AI agenda, rather than being mere subordinated consumers of AI.

        Photo by @DeepMind ]]>
        Diego ChavarroJaime Andrés Pérez-TabordaAlba Ávila
        Unlocking the frontiers of Scientometrics: CWTS Summer School 2022https://www.leidenmadtrics.nl/articles/unlocking-the-frontiers-of-scientometrics-cwts-summer-school-20222022-08-11T10:00:00+02:002024-05-16T23:20:47+02:00The fourth CWTS Summer School took place from June 20 to July 1, 2022. Scientometric scholars from over 23 different countries representing an array of disciplinary backgrounds met online and in-person in Leiden to learn, share and network on scientometric methods.The 2022 CWTS Summer School provided a thorough introduction to scientometrics. First, we defined scientometrics. We then discussed major scientometric data sources, their strengths and limitations, including Web of Science, Scopus, and Dimensions as well as explored cutting edge tools available to scientometricians, including Elsevier’s International Center for the Study of Research Lab (ICSR) and Dimensions on Google Big Query.

        We learned how to construct and analyse a network using quantitative and scientometric methods based on scientometric data relationships, such as causal inference, text analysis, and network analysis. We also had the opportunity to experience working with the VOSviewer software to gain an intuitive understanding of visualisation techniques.

        Furthermore, the summer school offered various alternative perspectives on the study of science. We learned about altmetrics as indicators of science-society interactions, about the connections between Science and Technology Studies (STS) and Scientometrics, and between the Science of Science and the Sociology of Science. These perspectives on science are unlocking a new era of scientometric thinking, enriching our knowledge, and broadening our horizons. They also inspire us to think about our own research in new ways.

        Student presentations

        To conclude on the content part of the summer school, it would be relevant to mention the student presentations. Due to our different disciplinary backgrounds, we exchanged ideas on a wide variety of research topics, which had a very special significance for us in the summer school. Among other topics, we talked about translational psychotherapy, the role of gender in solar energy research in Turkey, public policies in Latin America, and public research institutions in Korea. We talked about the terms "ultrafine particles and nanoparticles", and "elderly independent living" as well as broader topics such as education policy during the COVID-19 pandemic and health data sharing. Although we focussed mainly on scientometric methods, there was no lack of diversity in the way to apply them: we looked at citation behavior, talked about the development of new indicators, the relationship between survey data and bibliographic data, and learned more about grant proposals, delayed recognition in science, and the quantification of adjacent in distant reuse of references within disciplines.

        Global summer school: a hybrid experience

        This edition of the CWTS Summer School was the first to offer a hybrid learning experience, and like all first times, it brought a few challenges. Still, the hybrid mode enriched diversity by including participants who otherwise could not have enjoyed the summer school. We could classify the challenges into two main categories: unexpected comical MS Teams happenings and issues related to technicalities. On the comical side, we encountered unintentional unmuting and cat appearances, and on the technical side, we sometimes experienced poor connections and sound issues. However, all challenges were professionally managed by the teachers, not affecting the rhythm and pace of the summer school. One on-site participant said: "I found the hybrid format very enriching. Getting to know Leiden and the CWTS on site was great, but equally great were the digital presentations and the enrichment of the discussions provided by those connected online. Apart from the content of this course, networking and being able to exchange were the two main arguments for me to take part in the summer school - there was nothing else to be desired.”

        From the perspective of the online participants, the hybrid environment felt like being in a movie; there were camera-shifting angles and zoom-in to participants speaking in person. Also, the teachers managed the time for Q&A and discussion equally for all participants. In conclusion, although online participants were not in the room, their valuable contributions showed the importance of bringing their voices into this edition of the summer school.

        IMG 20220701 153030

        Impact beyond classroom

        The summer school came just at the right time when most of the participants needed it. Indeed, it came at a point where most of us are working on metric-related studies but needed a broader understanding and to learn more about the distinctions between scientometrics, bibliometrics, and altmetrics. Discussions and clarifications on these approaches and on methods applied to diverse types of studies benefited most participants. Participants who got the opportunity to present their work-in-progress received comments from fellow participants which in return aided in improving their work.

        According to one participant: “The summer school helped me to address critical comments of reviewers regarding the 'methodology' section of an article about the impact of international collaboration on Namibian science production".

        All the information on data sources and different tools used in scientometric studies provided during this course is a bonus that will enrich the future scientometric-related studies of all participants. Additionally, free access to data sources such as the ICSR Lab and Dimensions on Google Big Query will provide an opportunity for participants to use data for further exploration in metric-related studies. Empowered by the knowledge gained at the summer school, we look forward to expanding the frontiers of scientometric research together in the future.

        Photo by Deleece Cook

        ]]>
        Anna LeonardBasil MahfouzSantiago Ruiz-NavasTereza ŠímováVerena WeimerQianqian Xie
        What Affects Research Productivity: View from Inside the Universityhttps://www.leidenmadtrics.nl/articles/what-affects-research-productivity-view-from-inside-the-university2022-08-08T10:30:00+02:002024-05-16T23:20:47+02:00Dmitry Kochetkov, Ph.D. candidate at CWTS, together with colleagues from the Ural Federal University, analyzed factors affecting the performance of research groups.Background: Russian Academic Excellence Project 5top100

        The Russian Academic Excellence Project 5top100 is a Russian excellence initiative in higher education that ran from 2013 to 2020. The aim of the initiative was to place five Russian universities in the top 100 of global university rankings. The goal was not achieved; in political and academic discourses, there are conflicting assessments of the results of the project. On the one hand, the main goal of the project was not achieved; no five project participants got into the top 100 of the most common global university rankings (here we mean ARWU, THE and QS rankings). On the other hand, the Accounts Chamber (official auditor of the state budget) noted that the implementation of the 5top100 project made it possible to form a group of leading universities in the country, as well as to integrate Russia into the global trends in the implementation of academic excellence programs and strengthen the scale and significance of Russian university science in the world. We tried to look at the problem from inside the university.

        The Ural Federal University has been involved in the project from the very beginning. The main mechanism for bringing public funding to the final recipients was the creation and development of research groups. This scheme was typical for most of the participants of the 5top100 project. To the best of our knowledge, our work offers the first study of the results of the implementation of the excellence initiative not at the level of universities, but at the level of research units. This approach was made possible thanks to the availability of structured data for the period 2014-2020 provided by the Department of Strategic Development and Marketing.

        Key results

        In total, the analysis included performance indicators of 79 research groups. The number of articles indexed in Scopus and Web of Science was used as the main indicator. As an alternative indicator of quality, we used the number of articles in journals with an impact factor above two. Unfortunately, disciplinary features were not taken into account in the process of research assessment, so the threshold was the same for all groups. Correlation analysis revealed a moderate positive relationship between the dynamics of these two indicators (0.56); thus, we refuted the widely held assumption that stimulating quantitative growth of publications necessarily leads to a decrease in their quality. Our results indirectly support the existence of constant or increasing marginal returns for most research areas.

        The amount of funding was set annually depending on the type of group and the performance for the previous period. The type of group (research group, research laboratory, center of excellence) was determined depending on the number and level of group members. Paradoxically, funding (current and previous) does not have a significant effect on the change in research group productivity. Moreover, in some cases there was an inverse relationship. We can assume that in this case, prospective funding plays a more significant role than current level of funding. For example, a decrease in funding forces a group to work harder in the hope of increasing funding in the future. It is important to note that this variable refers exclusively to government funding. In terms of R&D revenue, we found an inverse relationship: the more R&D revenue, the smaller the increase in the number of articles. Thus, we can state that publications and innovative activities (measured as R&D income in our case) in research groups are substituting, not complementary.

        No less surprising is the fact that the experience of the research leader of the group also has an inverse relationship with the increase in performance. This does not mean that groups with an experienced leader have poor results, quite the contrary. However, the results of such groups tend to be stable rather than growing.

        Our study showed that the main factor influencing research productivity is the size of the research group. The age of the project, defined as the period of time from the establishment of a group to the termination of its operation, is also important. Note that we performed separate analyses for social and humanities areas (15 of the 79 groups) and all others. Interestingly, the age of the group has the greatest significance for both models in the social sciences and humanities fields with either the number of articles or articles in the journals with IF > 2 as dependent variables. We attribute this to the fact that there are fewer journals in these areas (purely humanities journals do not have an impact factor in principle); respectively, it takes more time to accumulate publications in top journals. Moreover, it simply takes more time to publish anything in these fields compared to natural and technical sciences. Thus, we can conclude that social sciences and humanities projects require a longer planning horizon so that one can see the effects from funding.

        In conclusion, our study found that:

        • The main factors affecting the performance of research teams are the number of participants and the age of the project (the latter especially for social sciences and humanities)
        • Funding (current and previous) has no impact on performance, although it certainly affects the ability to hire more team members
        • Decrease in current funding can paradoxically increase productivity
        • Experienced researchers are more likely to create stable rather than rapidly developing groups in terms of publication activity
        • Publication and R&D activities are at least partly substituting towards each other

        The study focused on one university, and the number of research groups is relatively small. Comparative analysis and expansion of the empirical base will provide more meaningful results in the future. For example, it will be interesting to compare the performance of research groups across different disciplines in a larger sample. Another limitation is that only two databases (Scopus and Web of Science) were used in the evaluation procedure and in this study as well. The results obtained are highly dependent on the sources of bibliometric data. This study mainly covered quantitative performance indicators but did not touch upon other project outcomes such as increased academic mobility and foreign recruitment.

        Concluding reflections

        Our study showed that the 5top100 project empowered a dramatic increase in the number of publications by Russian scientists in international databases. This statement is true for both a particular university and the country as a whole. Below is the statistics of publications for 2013-2020 for the Ural Federal University, participants of the 5top100 project, and Russia.

        Figure1 new

        In the end, I would like to return to where I started this post, i.e., to the project 5top100. In my opinion, the Project failed to solve two major problems of Russian higher education. First, there remains a monstrous gap between the budgets of the world's leading universities and Russian universities. Universities should have a more balanced funding structure with more private participation, for example in the form of revenue from R&D. It is impossible to solve this problem solely at the expense of public funds, and the demand for university research products (first of all, innovations) from the leading Russian companies is still at a consistently low level. The reality is that most of the science-intensive products are purchased abroad, with the only exception for the military complex. Secondly, the 5 top100 project did not lead to institutional changes within the universities and in the national higher education system. All changes were implemented in the traditional rigid vertical with no real autonomy of universities (all project participants are state universities) and decentralization within universities. The quality of academic institutions, and first of all, academic freedom determines academic excellence, in my opinion. Therefore, it will be interesting to observe not only the research performance issues under the new Priority 2030 project, but also how the new program will cope with these two challenges.

        This text is solely the personal position of the author and was prepared on the basis of materials in the public domain.


        Photo by Marvin Meyer

        ]]>
        Dmitry Kochetkov
        What lies ahead for research assessment reforms in Europe?https://www.leidenmadtrics.nl/articles/what-lies-ahead-for-research-assessment-reforms-in-europe2022-07-14T11:30:00+02:002024-05-16T23:20:47+02:00Alex Rushforth reflects on a recent announcement by the Council of the European Union to push ahead with an agreement on research assessment reforms across its member states.In June 2022, the Council of the European Union gave the green light for a European Agreement on research assessment reforms to go ahead. Plans for this initiative were proposed in a European Commission scoping report in 2021. Under the Agreement, research actors across European member states (including research performing organizations, funders, and national or regional assessment organizations) will be invited to sign up voluntarily and pledge their commitment to translate principles outlined in the report into local assessment reforms.

        The initiative builds on ten years or more of campaigns movements to curb the misappropriation of research metrics in academic research assessment contexts, to broaden quality criteria and to change research culture more broadly. The fact that such an influential actor as the European Commission has taken up the research assessment reform baton suggests this agenda truly has landed, at least in certain policy spaces (see also recent reform efforts being coordinated within the Netherlands, Finland, and Norway) (Pölönen and Mustajoki 2022).[1]

        Following the decision to press ahead with the Agreement, I would like to reflect on the strategy the European Commission appears to be adopting for facilitating such reforms, and consider some of the opportunities and challenges their approach may encounter. Before doing so, I briefly outline what principles the European Commission considers to be central to more responsible and fair modes of research assessment.

        The European Commission’s scoping report laments the current state of research assessment in Europe, which it states is driven by races for publications and citations, at the expense of quality, and which leads to a publish or perish culture that is damaging for research and researchers. The optimum method for research assessment is said to be qualitative peer review, and while the report adopts a critical tone towards uses of research metrics in research assessment - it does not completely reject their use as long as they are used appropriately in supporting (not replacing) qualitative decision making (citing, for example, the Leiden Manifesto). By signing the Agreement, research actors are effectively committing to ensure that their research assessments will:

        • recognize and reward the plurality of contributions researchers make to academic life (not just publishing and bringing in grant money)
        • respect epistemic differences between research fields
        • reward new (or newly emphasized) quality dimensions such as open science (broadly defined), research integrity, and societal relevance, when evaluating individuals, institutions and research proposals.

        As with the majority of efforts to initiate reforms of research assessment over the past decade, the European Commission Agreement is an example of ‘soft governance’, with the emphasis on steering from a distance rather than hierarchical imposition. The scoping report avoids giving precise prescriptions on how to implement reforms – rather it provides a broad vision and signposting to researchers and research organizations on how and why they should seek to redefine research quality, arguing that adhering to such values is commensurate with better (or more responsible) ‘academic citizenship’. To reiterate, signing the Agreement will be voluntary and not a legally binding commitment: while there may be reputational fallout if a signatory were to be seen as not acting within the spirit of the Agreement, there are unlikely to be formal sanctions.

        How far can ‘soft governance’ take research assessment reform efforts?

        A ‘soft governance’ approach like the Agreement has its attractions for different actors across the European research landscape: in a period of restricted economic growth and belt tightening around public funding, the Agreement requires little fresh money from the Commission, with individual signatories expected to self-fund their internal changes. The fact an actor like the Commission has so visibly put their weight behind this agenda will no doubt help local change agents when lobbying for their own research organizations to revisit current assessment practices. Likewise the lack of top-down prescriptiveness about what exactly the reforms should look like affords agency and flexibility to those on-the-ground in universities, funding bodies or assessment agencies to enact changes in a ‘bottom up’ way. On the flipside, one can envision potential limitations to this soft governance approach: lack of new, centralized funding means universities and other research actors may not wish (or be able) to invest their own scarce resources in enacting this agenda. Furthermore, the voluntary ‘opt in’ nature of the changes may well mean they can be easily ignored by those for whom the shared visions for change do not resonate. Soft governance mechanisms like voluntary agreements ultimately rely on their intended audience getting excited about the vision being set out or feeling a social pressure to conform, but if big players are seen as ignoring these calls, or organizations see them as too difficult to achieve, then the reforms will likely only be taken up sporadically by a handful of enthusiasts.

        Another concern mentioned in the scoping report is the risk that research system actors in some member states will adopt reforms much quicker or enthusiastically than others, thus threatening potentially the logic of a common European Research Area (ERA), which envisions a single borderless market for research and for researchers. At national and local levels, influential actors with potential wrecking power may present opposition to the reforms. We have already seen criticisms being voiced against the Agreement from national research actors, for example in Germany, where an alliance of research organizations responded to the plans for the Agreement by stating they are against plans for a ‘harmonized’ European-wide assessment system and declaring they will not be signing up. Opposition and counter-reform movements are challenges for which champions of European research assessment reform should prepare themselves.

        As such, there could well be a bumpy road ahead towards reformed research assessment practices becoming mainstream across the European Union. In Leiden, the need to make sense of assessment reform developments in Europe and beyond has prompted us to establish a Responsible Evaluation thematic hub in our institute, CWTS. Through the Responsible Evaluation Hub, CWTS colleagues will meet bi-monthly to discuss ongoing developments around research assessment reforms, including projects we are involved in, external initiatives, and to act as a sounding board for colleagues’ own encounters with ‘responsibility’ dilemmas. We think there will be plenty to discuss.

        [1] Pölönen, J. and Mustajoki, H. (2022) ‘European recommendations on responsible research assessment’ Presented at EASST Conference, Madrid, July 6-9, 2022, Session on Responsible Research Assessment and STS, organized by A Rushforth, M Sienkiewicz, J Zuijderwijk, S de Rijcke.

        ]]>
        Alex Rushforth
        The growth of open peer reviewhttps://www.leidenmadtrics.nl/articles/the-growth-of-open-peer-review2022-07-06T09:21:00+02:002024-05-16T23:20:47+02:00The closed nature of the traditional journal peer review system is often criticized. Over the past two decades, significant efforts have been made to make peer review more open. Ludo Waltman and Nees Jan van Eck use data from Crossref to analyze the growth of open peer review.Twenty years ago, Fiona Godlee, at that time Editorial Director for Medicine at open access publisher BioMed Central, wrote a sharp critique of the traditional system of closed pre-publication peer review, arguing that the system needs to be opened and drawing attention to the opportunities offered by “preprint servers combined with open commentary” to realize this openness. In subsequent years, Godlee contributed to increasing openness in peer review as Editor-in-Chief of the British Medical Journal, a journal with a long-standing commitment to open peer review.

        To what extent have ideas on open peer review developed by Godlee and others been realized over the past two decades? There is no straightforward answer to this question, since the availability of systematic data on peer review practices is limited. In this blog post, we use data from Crossref to offer some partial insights into the growing popularity of open peer review.

        Open peer review - Journal articles

        Two years ago, Dietmar Wolfram and colleagues revealed a strong growth in recent years in the number of journals supporting some form of open peer review. Over 600 journals offered open peer review in 2019. These journals published the reports of reviewers, the identities of reviewers, or both.

        Figure 1 shows a similar growth in the number of peer review records in Crossref that are linked to a journal article. This number increased from fewer than 10,000 in 2018 to more than 60,000 in 2020 and 2021. Each of these peer review records represents a review report of a reviewer, a decision letter of an editor, or a response letter of an author. Many journal articles are linked to multiple peer review records in Crossref. In 2021, over 13,000 journal articles had a link to one or more peer review records.

        Figure 1. Growth in the number of peer review records in Crossref linked to a journal article


        As shown in Figure 2, Publons is by far the largest contributor of peer review records in Crossref, accounting for two-third of all records. A large majority of these records are linked to journal articles published by Wiley. Indeed, Wiley has made a considerable effort to promote open peer review (referred to as transparent peer review by Wiley). Other important contributors of peer review records in Crossref are PeerJ and eLife.

        Figure 2. Peer review records in Crossref linked to a journal article: Breakdown by platform (left); Breakdown by publisher for Publons peer review records (right).


        Importantly, there are several publishers that publish review reports but don’t register a Crossref DOI for these reports. This is for instance the case for BMJ, EMBO, MDPI, PLOS, and Springer Nature. There is no straightforward way to determine the number of review reports published by these publishers, although some figures can be obtained from information provided by the publishers. MDPI for instance reports that in 2020 it published review reports for over 34,000 articles. Recent statistics for PLOS show that PLOS published review reports for more than 7,500 articles in 2021. For Springer Nature recent statistics don’t seem to be available, but the journal Nature reports to have published review reports for almost 450 articles in 2021. While precise figures aren’t available, it is clear that the total number of articles in 2021 for which review reports were published without a DOI is much larger than the 13,000 articles for which review reports were published with a DOI. Hence, a large majority of the published review reports don’t have a persistent identifier and don’t have openly available metadata. This severely limits the value of these reports.

        Open peer review may refer not only to publication of review reports, but also to publication of identities of reviewers. The pros and cons of disclosing reviewer identities have been discussed extensively. For peer review records in Crossref classified as review report (instead of decision letter or author response), we found that the identity of the reviewer is disclosed in 39% of the cases.

        Open peer review - Preprints

        A recent development is the publication of review reports for preprints instead of journal articles. A variety of platforms and initiatives offer a range of different approaches to peer review of preprints.

        Figure 3 shows the growth in the number of preprint peer review records in Crossref. While the number of records is much smaller than for journal articles, the growth is impressive, from 20 records in 2019 to 733 records in 2021. Three platforms, Qeios, MIT Press Rapid Reviews COVID-19, and ScienceOpen, account for almost all preprint peer review records in Crossref. A small number of records originate from Publons, and a few records represent review reports published by one of us using the PubPub platform.

        Figure 3. Peer review records in Crossref linked to a preprint: Growth in the number of records (left); Breakdown by platform (right).

        Many review reports for preprints don’t have a Crossref DOI. These reports aren’t included in the statistics presented in Figure 3. This is for instance the case for review reports from PREreview, a platform for preprint peer review that uses DOIs from DataCite instead of Crossref. PREreview currently contains more than 250 review reports (excluding so-called rapid reviews). Other review reports for preprints don’t have a DOI at all. This applies both to review reports published directly on a preprint server and to review reports published on various preprint peer review platforms. The latter reports may be visible in Sciety, a platform that aggregates review reports and other evaluations of preprints from a variety of sources.

        Open peer review - Copernicus and F1000

        Copernicus and F1000 are special cases. Copernicus offers an integrated platform that publishes both journal articles and preprints as well as the associated review reports. Likewise, F1000 provides a platform that publishes multiple versions of an article, including the review reports for each version. Because of their special nature, we present statistics for Copernicus and F1000 separately from the statistics reported above. Peer review records for Copernicus and F1000 aren’t included in Figures 1, 2, and 3.

        Figure 4 shows the growth in the number of peer review records for Copernicus and F1000. The statistics for F1000 were obtained from DataCite instead of Crossref, because F1000 uses DataCite to register DOIs for review reports. Copernicus is a major contributor of peer review records in Crossref, especially in earlier years. F1000 is a pioneer in registering DOIs for review reports, starting in 2012. The number of peer review records for F1000 is much smaller than for Copernicus, but it has shown a steady growth over the past decade.

        Figure 4. Growth in the number of peer review records in Crossref for journal articles and preprints published by Copernicus (left) and in the number of peer review records in DataCite for articles published by F1000 (right).

        Recommendations

        The statistics presented in this blog post show an impressive growth in the adoption of open peer review, especially in recent years. Nevertheless, the transition advocated twenty years ago by Fiona Godlee, from the “flawed system of closed prepublication peer review” to a system of “preprint servers combined with open commentary”, is still in a very early stage, with preprint peer review starting to take off only very recently.

        We see improvement of peer review as a joint responsibility of all stakeholders involved. Each stakeholder needs to make a contribution. We recommend that:

        • Authors and reviewers explore the interesting new opportunities offered by preprint peer review platforms.

        • Scientific publishers and preprint peer review platformsregister DOIs for open review reports and include links in the metadata of these reports to the corresponding journal articles and preprints.

        • Bibliographic databases provide data not only for journal articles, but also for preprints and for open review reports linked to journal articles and preprints.

        • Research funders and institutions consider using this data in research assessments in order to give appropriate recognition to the work done by authors and reviewers.

        We end this post by drawing special attention to an opportunity individual researchers have to contribute to the growth of open peer review. The Publish Your Reviews initiative, launched today by ASAPbio (and co-organized by one of us), calls on researchers to publish their review reports alongside the preprint version of an article. This offers an easy way to promote openness in peer review. Researchers are invited to express their support for the initiative by signing a pledge.

        This blog post is largely based on a presentation given by the authors in the CWTS research seminar on June 10, 2022. The slides of this presentation can be found here.

        Photo credits header image: Katerina Pavlyuchkova

        ]]>
        Ludo WaltmanNees Jan van Eckhttps://orcid.org/0000-0001-8448-4521
        Bibliometrics in press or the representation of indicators in the Italian newshttps://www.leidenmadtrics.nl/articles/bibliometrics-in-press-or-how-newspapers-shape-the-social-representation-of-bibliometric-indicators2022-04-13T10:30:00+02:002024-05-16T23:20:47+02:00The use of bibliometric indicators such as the h-index or the journal impact factor is not limited to academia: from time to time, they make it into the news as well. Our author studied Italian news articles and found that they are used in quite different contexts and cover a variety of functions.In spring 2020, Italy, like other countries in Europe and around the world, was in the midst of the first wave of the Covid-19 pandemic. Lockdown measures were in place in the entire country in the attempt to limit the spread of the virus. In these hard times, Italian public opinion was exposed to hitherto specialistic notions of epidemiology such as exponential growth, basic reproduction number, respiratory droplets and so on. Experts from medicine and other scientific fields had rapidly acquired a new centrality in the media and in government. A scientific-technical committee was established to advise the government, while medical doctors and scientists were routinely interviewed in newspapers and invited in talk shows.

        In this context, on May 2 the newspaper Il Tempo published an article bearing the title: “The poorest experts in the world: Burioni, Pregliasco and Brusaferro”.[1] In this article, the scientific reliability of several experts taking part in the scientific-technical committee or appearing in the media was gauged using the most (in)famous bibliometric indicator, the h-index. Experts were ranked and licenses of expertise attributed or discarded based on h-index scores. The journalist explained:

        The frankly crude use of the h-index made in the article attracted much criticism from the Italian scientific community (see here and here, sources in Italian). On my part, I was deeply impressed by how a specialized notion from bibliometrics percolated in the generalist press and was mobilized in public debates on scientific authority and trustworthiness of experts. I was aware that bibliometricians and scholars in STS were increasingly revealing the performative nature of bibliometric indicators: far from being neutral measures, these statistical constructs shape the behavior of scientists and deeply intrude into the epistemic structure of the sciences themselves. However, this kind of research had so far mainly focused on intra-scientific contexts and practices, with little attention for extra-scientific arenas. Yet, the article mentioned above seemed to me a clear example of how academic/scientific actors are notalone in generating the socialrepresentation of bibliometric indicators: a complete description of the processes of negotiating meaning should encompass further actors, such as journalists, and further arenas, such as the press.

        I then started a research project aiming at investigating the representations and uses of bibliometrics in the press, with the aim of developing the previous classifications of relevant actors. I decided to focus on the Italian press for two reasons. First, Italy’s research evaluation system is heavily based on bibliometric indicators. This system was introduced in 2010 as part of a vast reform of the country’s university management, which was heavily contested by the Italian academic community. Second, Italy lacks a strong indigenous community of bibliometrics experts. In this sense, no community could claim an epistemic control of the social discourse on bibliometrics in the country. These factors created the conditions for newspapers to become a key arena for the discussion of bibliometrics and bibliometric indicators and, hence, a perfect viewpoint to observe the collective construction of their social representation.

        Using the online archives of four major Italian newspapers, I retrieved a corpus of 583 articles, published between 1990 and 2020, that mentioned the Journal Impact Factor, the h-index, or other bibliometrics-related terms. In this blog post I cannot go into the details of this very rich material.[2] I will try, however, to highlight what I deem to be the three most interesting findings and suggest some ideas for further research.

        Indicators in the press between meritocracy, science news, and rankings

        The first result is that the Impact Factor (IF, in the following) started to appear in the Italian press in news about scandals in competitions for university chairs. In the early 1990s, it become common practice to sum the IF of the journals in which scientists published, obtaining an IF-based metric of individual researchers. In this way, candidates rejected in competitions had at their disposal a new, easily interpretable metric to compare their scientific performance with that of the winners and, thus, could reclaim justice. In this sense, the IF started its career in the Italian press as a “justice device” to promote meritocracy in academic recruitment. The following quote is representative of the general tone of the news denouncing scandals:

        The rhetorical use of indicators as objective measures that can fix the perceived endemic clientelism of Italian academy grows over the years and reaches its highest intensity in the years before the implementation of the 2010 university reform (Figure 1).

        Fig 1 petrovich
        Figure 1 - Articles presenting bibliometric indicators as a means to promote meritocracy in the Italian university system. Figure adapted from the published article.

        This shows that indicators were integrated into a meritocracy-centered narrative frame long before they were officially enrolled in the Italian research evaluation system.

        The second finding, which is particularly relevant for understanding how the press contributes to the social construction of scientific facts, is that the Impact Factor is frequently used by journalists as a “quality seal” for science news. The IF is presented as a warrant of the scientific reliability of the venue of publication, and hence, of the credibility or relevance of the science news reported:

        Note that no article where the IF plays this function mentions the limitations of the indicator, that hence is presented as a completely “transparent” quality seal, easily interpretable and uncontested.

        Interestingly, the IF can be mobilized also to deconstruct the validity of research in the news. For instance, the reliability of a study allegedly showing the efficacy of homeopathy is contested based on the IF factor of the publishing journal, observing that this was “very low” compared to that of serious scientific journals such as Nature.

        The third interesting result concerns the role of amateur bibliometrics in the press, that is bibliometrics produced by nonprofessional bibliometricians. The h-index arrives in the Italian press in 2008, just three years after its creation by Jorge Hirsch. The “vector” of the indicator was a ranking of Italian scientists known as “Top Italian Scientists” (TIS), published online by the association Virtual Italian Academy. In 2010 and 2011, most of the articles that mentioned the indicator were in fact about the TIS. This ranking offered journalists a ranking of individual scientists that nicely complemented rankings of universities that started popping up in the press in the same years. However, it was the result of a private initiative without institutional support. Again, about one out of three of the news about the TIS ranking lack any definition of the indicator and less than the half report its limitations.

        These three findings show that bibliometric indicators in the press occur in different contexts, play a wide range of functions, and are integrated into different narrative frames. They appear in debates on academic recruitment, but also in the communication of scientific discoveries to the public. They can be used to claim justice but also to satisfy the hunger for rankings and measuring “excellence”.

        Next steps

        The next, natural step in the investigation of bibliometrics in the press is to understand how the social meaning of indicators is constructed in the press of other countries and in other media or press types. It has for instance been suggested to me that Dutch journalists represent the IF differently from their Italian colleagues, using it as a “shorthand” for any bibliometric statistics. In this research, I analyzed the generalist press, but there is also a specialist press, such as Times Higher Education, or specialist blogs, such as Leiden Madtrics and ROARS (Return on Academic Research), in which the representation of indicators may follow different logics. Bibliometrics in press has still lots to tell.

        [1] The original article is no longer available on the website of Il Tempo. However, a version of the same article is still available on the website of Il Corriere del Giorno [accessed on April 1, 2022].[2] The complete analysis of the corpus is available here in open access.
        Photo credits header image: Ludovica Dri
        ]]>
        Eugenio Petrovich
        Do research priorities for mental health actually reflect the goal of fostering well-being?https://www.leidenmadtrics.nl/articles/do-research-priorities-for-mental-health-actually-reflect-the-goal-of-fostering-well-being2022-03-30T11:00:00+02:002024-05-16T23:20:47+02:00Do mental health research priorities reflect societal needs? This post explores the landscape of mental health research and introduces an interactive visualization that allows to explore research portfolios of specific countries, funders and organisations.This post was previously published on the LSE impact blog.

        Mental ill-health and well-being are increasingly recognised as being intimately linked to a wide range of environmental and social factors. As such, the ways in which researchers approach, understand, and engage with mental health must be broad, ranging from the biophysiological mechanisms underpinning brain function, to the societal determinants which alter it. The significance of this connection has been illustrated by the effects of COVID lockdowns on mental health in which: fear, sudden changes in daily habits, family roles, domestic violence, work burnout, etc. have all palpably impinged on mental well-being.

        Given this multiplicity of effects, mental health research should consist of a wide diversity of topics, disciplines, approaches, and methods. It also raises the question of prioritisation. To what extent should more research efforts be directed towards prevention, rehabilitation, or understanding the social determinants of health, in comparison with therapeutics or neurosciences? In a collaboration between Vinnova and the Centre for Science and Technology studies (CWTS), we have undertaken a study to begin to understand this diverse research landscape, with the aim of opening up conversations about research priorities. Underlying our analysis is one motivation: how should research be prioritised for the greatest possible reduction of mental ill-health?

        We found broad agreement amongst public health researchers and practitioners that mental health is largely determined by environmental, social and economic factors. Factors such as one’s work environment, the natural and built environment (presence of pollution, transportation systems, green spaces, such as parks); one’s relative level of poverty and wealth etc. However, what remains an open question, is the extent to which current research priorities (at the level of scientific fields) are aligned with this understanding. So, do research priorities acknowledge the role of the social and environmental contexts in influencing mental well-being?

        To address this, we carried out interviews and focus groups of experts as well as quantitative analyses of publications on mental health. In so doing we built up a picture of what research experts perceive should be prioritised and the current priorities manifest within the published research.

        An expert consensus

        Our focus groups comprised of discussions with experts, including clinicians, school psychologists, as well as patient representatives. Throughout these exchanges, several key findings emerged with regard to the current priorities of mental health research and their potential disconnect with the needs of the health and welfare systems. A common theme from the interviews was a need for systemic research on the social and environmental determinants of mental health. In particular, experts called for research that is more focused on:

        • Health systems and health services
        • Psychosocial interventions, rather than only biomedical and pharmaceutical, interventions, as well as diagnostic classifications
        • A perspective of mental health that focuses on the entire life-course, with special attention to childhood and adolescence

        These points highlight the conclusion of experts that mental health research has become focused on decontextualized individual and biomedical approaches. Further, experts argued that the reason for this focus on biomedical psychiatry and neuroscience, were incumbent authority, recognition, and reward structures within academia, which prioritise funding for ‘novel and highly technical’ approaches. More contextualized forms of research, focused on social determinants were on the other hand felt to be devalued and under-prioritized.

        Mapping research priorities from publication data

        Alongside this qualitative data, we documented the current distribution of research for mental health across disciplines and topics using publication data (Web of Science) with an interactive visualization interface that allows users to compare research efforts by specific countries, organizations and funders.

        Figure 1. Disciplinary profiles in mental health research. See interactive visualization interface for data on other countries, organizations or funders.

        The first visualization provides information on the relative amount of research that a given unit (e.g. a country) publishes in certain disciplines, as illustrated in Figure 1. with Germany, United Kingdom and Sweden given as examples. Publication data shows that psychiatry-related disciplines, neurosciences, and biomedicine constitute the largest share of research, with around 60%-75% of all research. It also confirms experts’ perceptions that there is relatively little mental health research in social science, public health and policy, and in healthcare systems, with around 10-20% of publications altogether. According to stakeholders, this low percentage is due to the relative lack of academic prestige of qualitative and implementation research among health funders and evaluation systems. However, Figure 1 also shows that Sweden (and the Nordic countries if you explore the interactive visualisation) has a more balanced portfolio than countries such as Germany or the UK.

        The second visualization allows users to compare the relative number of publications of a specific country, organization or funder over 280 research topics related to mental health, as illustrated in Figure 2. With this more detailed description, it is possible to explore particular specialisation patterns – thus spotting research strengths or gaps for a certain country or organization. For example, we were able to see that Sweden is relatively specialised in Alzheimer’s disease, that Denmark is relatively more focused on schizophrenia and bipolar disorder, while the US is more active in autism research. More interestingly, the mappings also show the specific social determinants of mental health studied, e.g. the relationship between racial inequality and mental health, inequalities, school bullying, job insecurity or homelessness.

        Figure 2. Fine-grained research landscape of mental health research. Each node represents a specific research topic such as autism, postpartum depression, or school bullying. The size of a node is proportional to the number of publications. Nodes are positioned near related topics, for example with biomedical topics in the bottom right, public health issues in bottom left and psychiatry in the center. See interactive visualization interface for details.

        Facilitating deliberation on research priorities

        Our hope is that the comparisons provided by the visualization tools can support deliberations between policymakers and experts so as to rebalance mental health research in ways more effective in reducing the amount of mental ill-health, as well in promoting mental well-being.

        Redressing these imbalances in mental health research has the opportunity to better countless lives. Research funders and policymakers, have a responsibility to reflect on whether or not current research priorities truly serve the needs of society.

        We thank the editor of the LSE Impact Blog, Michael Taster, for editing suggestions.

        Photo credits header image: Emma Simpson

        ]]>
        Wouter van de KlippeAlfredo YegrosTim WillemseIsmael Rafolshttps://orcid.org/0000-0002-6527-7778
        Seven Guiding Principles for Open Research Informationhttps://www.leidenmadtrics.nl/articles/seven-guiding-principles-for-open-research-information2022-03-16T12:30:00+01:002024-05-16T23:20:47+02:00What should research organisations consider when creating and acquiring services to manage research information?Research is increasingly data-driven, and so is the management, communication, and evaluation of research. The area of research intelligence is fuelled by big data analytics and provides new prospects for assisted decision-making on funding opportunities, publishing venues and next generation metrics. Such types of analysis are based on research products (such as articles and datasets) and by-products (such as metadata about funding). Of a total of €17.5 billion annual investment in Dutch research and development, 30% is funded and 34% performed by public institutions. It is therefore essential that research intelligence undertaken in these institutions is done so in accordance with scholarly values. This is all the more urgent when more and more big publishers are moving from a content-provision to a data analytics business.

        In 2020 and 2021 we took part in a Taskforce on Responsible Management of Research Informationthat developed seven Guiding Principles for Open Research Information. One of us, Alastair Dunning, recently worked with a designer to publish a slightly updated and more visually appealing version of the Guiding Principles. This is a good occasion to bolster the principles, which we believe should be widely read and lived up to in the Netherlands and beyond.

        The guiding principles are trusted and transparent provenance, openness of metadata, openness of algorithms, enduring access and availability, open standards and interoperability, open collaboration with third parties, and academic sovereignty through governance. 

        A previous version of these principles was applied in the contract with Elsevier,  established in 2020 by the Association of Universities in the Netherlands (UNL), the Netherlands Federation of University Medical Centres (NFU), the Dutch Research Council (NWO). The deal included Open Access publishing and reading services, but - crucially - it was also an agreement about the joint development of new research intelligence services. The million dollar question was of course if the deal was consistent with Dutch Open Science goals, and if undesirable platform effects would be avoided. 

        We are glad that the Dutch universities adopted the Guiding Principles for Open Research Information in the Summer of 2021. This should now lead to in-house application, as well as adoption in commercial systems. This is a crucial step in the move toward more open (information about) research. All research performing organisations that rely on public spending should provide leadership in this area. This will require effective cross-sectoral governance and sustained investments in open infrastructures.

        ]]>
        Magchiel BijsterboschAlastair DunningDarco JansenMax HaringSarah de RijckeMaurice Vanderfeesten
        Responsible metrics for societal value of scientific researchhttps://www.leidenmadtrics.nl/articles/responsible-metrics-for-societal-value-of-scientific-research2022-03-10T10:30:00+01:002024-05-16T23:20:47+02:00What does responsible research evaluation look like when it comes to societal value? This blog post provides four practical recommendations.In the global research evaluation community, there is an increasing awareness of the importance of responsible evaluation. The current situation, with an emphasis on quantitative metrics, does not do justice to diversity between scientific fields, to different roles of researchers, or to the societal value of research. Moreover, studies have shown that researchers adjust their activities in anticipation of evaluations. So far, there has been little awareness for effects on the system level (see Leiden Manifesto for research metrics).

        The debate about responsible evaluation focuses mainly on indicators of citation impact, such as journal impact factors or the Hirsch index. This blog post explores the requirements for a responsible approach to evaluating the societal value of science.

        Over the past few decades, a number of tools and methods have been developed to evaluate the societal value of science. Society urgently needs science to guide sustainability transitions, to fight the COVID-19 pandemic and to decrease global economic inequality. High expectations from publicly funded research give rise to a need for assessing the societal benefits of science. Does scientific research actually deliver the societal value that it promises or that public funders expect?

        Available methods use qualitative or quantitative data to make the use, uptake or impact of scientific knowledge in society visible. A promising avenue is to focus on the process rather than eventual impact. Societal value comes in many different forms, such as improved public health, economic growth or better education. Such diversity makes its measurement and comparability highly unfeasible. Moreover, the impact of scientific knowledge often develops over longer time periods, and is influenced by many factors beyond the control of the researchers involved. It becomes more attractive to focus the evaluation on the immediate response in society, or on the interactions between research and societal stakeholders as these are instances that are more concrete and verifiable than broadly defined or large-scale societal impact. These responses and interactions are then taken as pre-conditions of impact.

        How can the available methods be applied to evaluate societal value in a responsible way? Here we provide four recommendations. 

        1. Choose methods that match the purpose of evaluation

            A key consideration in planning your research evaluation is what you want to achieve with it. Is it mainly an accountability exercise, to illustrate that investments have resulted into societal uptake and use? In that case you may want to focus on empirical evidence of impact, for example using the Monetization method. Or do you want to support a learning process, in order to improve strategies for societal impact? In that case, it will be more helpful to make an inventory of the key audiences in society and investigate how they respond to the research products of the unit of evaluation, using altmetrics, for example.

            Toolbox
            There’s nothing like a well-equipped toolbox!

            2. Choose methods that fit the research context

            Given the heterogeneity of research practices, it is key to tailor the evaluation approach to the disciplinary and organizational context of the research unit under evaluation. While patents may be a meaningful indicator of impact in a biotechnology department, advisory reports will be more important in an institute for macro-economics. If the evaluation context allows, it can be useful to design a ‘theory-of-change’. This is a causal model representing the desired impacts, the intermediate ‘outcomes’ and the immediate ‘outputs’ that can lead to those impacts. Building a theory-of-change, preferably in co-creation with stakeholders, will help distinguishing relevant audiences inside and outside of the research setting that will need to be reached in order to generate any impact. Analyses of collaboration networks or social media interactions can then help to explore to what extent these audiences respond to research products or how they interact with the researchers. 

            3. Combine qualitative and quantitative data

              Qualitative and quantitative data can both provide insights into the dynamics of generating value from scientific research. The Leiden Manifesto argues to use quantitative indicators only to support qualitative, expert assessment. In line with this, we recommend using quantitative analysis of digital responses or productive interactions to start a conversation rather than to end one. And to consider the use of qualitative data from interviews, focus-groups or interactive workshops in addition. One of the tools that we use in Leiden, Area-Based Connectedness, focuses on the connections of a research area with industry, policy or other societal domains. Instead of “measuring” the direct connections of a research unit with societal actors, this method provides evidence of the connectedness of research areas in which the unit publishes. In this way, it indicates the potential societal relevance rather than the particular impact it generates. We have experienced that this kind of information can help both research units and evaluation committees to understand the interactions between research activities and society. It can form a fruitful basis for conversations either to improve research strategies or to formulate evaluative conclusions.

              4. Consider the theoretical assumptions of your evaluation method

                In a recent review, Jorrit Smit and Laurens Hessels show that the available methods vary not only in terms of the methodological approach but also in terms of their theoretical assumptions about societal value, the actors involved and the interaction mechanisms to produce this value. Some methods, such as Science and Technology Human Capital, for example, hold a linear view on knowledge exchange and perceive knowledge users merely as recipients of knowledge. Other methods, such as ASIRPA, are based on a cyclical model, emphasizing the feedback mechanisms between the production and the application of knowledge. There are also methods, such as Contribution Mapping, that follow a co-production model, an almost equal perspective that allocates more agency to users and intermediaries. Similarly, the new proposal of “heterogeneous couplings” introduces more interactive science-society perspectives in the altmetrics and social media metrics toolset. Each method has its own merits, as it will highlight particular achievements or mechanisms. For this reason, it is often fruitful to combine different methods. One key consideration for choosing methods will be the data required. However, we recommend research managers and evaluators to not only consider practical constraints, but also the alignment between the theoretical foundations of an evaluation method and their own convictions about the way scientific research generates value in society.

                To conclude

                The recommendations presented here are grounded on an interactive understanding of the creation of societal value, assuming that the value of science to society is produced in mutual interactions between academia and society. They address a rather broad audience, as research evaluations are typically designed by collectives of researchers, policy makers, research managers and advisory committees. These four recommendations can help them to design suitable evaluation approaches. We do not believe in blueprints of how to evaluate the societal value of scientific projects, programs, or organisations. Rather we hope to give some guidance in tailoring evaluation approaches, in order for them to support learning and accountability effectively.


                Photo credits header image: Patrick Perkins; photo credits in-text image: Barn Images

                ]]>
                Laurens HesselsLeonie van DroogeTjitske HoltropRodrigo Costashttps://orcid.org/0000-0002-7465-6462
                Building knowledge infrastructure to support research assessment reforms: Dispatches from the Dutch Recognition and Rewards Festival 2022https://www.leidenmadtrics.nl/articles/building-knowledge-infrastructure-to-support-research-assessment-reforms-dispatches-from-the-dutch-recognition-and-rewards-festival-20222022-02-23T10:30:00+01:002024-05-16T23:20:47+02:00In this blog post we reflect on knowledge infrastructures currently emerging to support organizations that are pursuing research assessment reforms, and call on sociologists of science and research evaluation researchers to study and contribute to these unfolding developments.How can academic research systems enable more diverse profiles and career paths for academics? How can research assessment better recognize quality, content, creativity, and social relevance of research? Can academics be better rewarded for individual and team-based contributions, where appropriate? These were some of the questions at stake at the second annual Recognition and Rewards Programme event in the Netherlands on 4 February 2022, moved online due to coronavirus.

                Combining elements of bottom-up and top-down coordination, the Recognition and Rewards initiative is a coalition of research funders, universities, university medical centers, and public research institutes that aim to reform and diversify academic career and research quality assessment. Since the publication of the position paper, Room for everyone’s talent: towards a new balance in the recognition and rewards of academics in 2019, Dutch Universities have pursued local action plans and some have begun implementing changes in pursuit of Recognition and Rewards’ vision.

                As a nationally coordinated effort, Recognition and Rewards is one of the first of its kind (see also initiatives in Norway and Finland), providing a fascinating natural experiment on what happens when large-scale reforms of a research system are introduced. Being one of the first into unchartered territory though means the Dutch research system has some ‘first mover disadvantages’, as those investing in reforms lack existing stocks of knowledge and experience to inform their change efforts. Alongside bottom-up changes being implemented locally, the Recognition and Rewards programme is seeking to build shared infrastructure to guide and monitor individual changes and draw out common lessons. Events such as the annual festival are one such example of infrastructure, as they provide an important moment to pause and reflect on challenges and more generally to forge communities of practice that share knowledge on common challenges that cut across organizations.

                The Festival itself took place over a day, and consisted of roundtable discussions by senior stakeholders and parallel stream workshops put on by different research system actors. Our own team hosted a session on the challenges of implementing complex changes in organizations, using fictional vignettes of university leaders introducing narrative CVs and portfolio assessment tools. Clearly such interventions cannot ‘resolve’ complex issues around which different meanings and conflicts of interest emerge. Occasions such as online workshops, can though provide opportunities for common challenges to be surfaced, discussed, and acknowledged, thereby supporting learning and networking among different actors in the research system as they approach their respective change efforts.

                Broadening out, with its Recognition and Rewards programme of reforms, Dutch Universities have a unique opportunity not only to be at the forefront of assessment reforms, but also to cultivate communities of practice and build shared knowledge about implementing, scaling and sustaining reforms from which others can benefit. Building this knowledge is not easy, as it involves dedicating potentially scarce resources to evaluating and monitoring interventions and being open to sharing findings with one’s perceived competitors and opening oneself up to scrutiny from the wider world. But these are costs that should be worth bearing.

                Alongside the Dutch efforts, there are other signs of emerging cross-national knowledge infrastructure to inform and guide academic institutions pursuing assessment reforms. The Recognition and Reward Festival itself took place on the same day as the Paris Open Science European Conference (OSEC) 2022 focusing on research assessment reforms in the European Union. 160 organizations have signed up to declare interest in the European Commission’s action plan to implement research assessment reforms. CWTS, Leiden University, where the three of us work, is currently partnering with the San Francisco Declaration on Research Assessment (DORA) on three year project funded by Arcadia, a charitable fund of Lisbet Rausing and Peter Baldwin, to build community resources to support assessment reform practitioners internationally, including building a toolkit and an online dashboard to display and visualize information around novel assessment activities in the context of hiring, promotion and tenure decisions. The dashboard will complement an existing raft of resources that the DORA website has established in recent times, including case studies, blogs and tools to develop change management. Professional research management associations like International Network of Research Management Societies (INORMS) Research Evaluation Group (REG) have also been actively developing resources to guide organizational change, including the SCOPE Framework.

                Much is happening. Yet, two overlapping research communities that have been surprisingly quiet on research assessment reforms are the fields of sociology of science and the multi-disciplinary social science field of research evaluation. This is alarming, as a rigorous, theoretically informed academic knowledge base about novel assessment tools and practices is urgently needed. Participating in the Recognition and Rewards Festival it struck us these are just the kinds of collective engagements in which such a knowledge base should be playing a valuable role. Given quite dramatic changes are underway in core problem areas of their field – research assessment - our message to colleagues and peers in the sociology of science and research evaluation is clear: it’s time for us to step up.

                ]]>
                Alex RushforthMarta SienkiewiczSarah de Rijcke
                A first step in quantifying disagreement across sciencehttps://www.leidenmadtrics.nl/articles/a-first-step-in-quantifying-disagreement-across-science2022-01-19T10:30:00+01:002024-05-16T23:20:47+02:00Disagreement is ubiquitous in science and maybe even necessary for progress. We leverage recent advances in data to develop a method for quantifying disagreement, revealing the complexity of disagreement across science.Whether in publications, seminar Q&As, or on Twitter, scientists tend to disagree. Although many topics have broad consensus—human-caused climate change and the link between smoking and cancer being but two—even the most settled knowledge was at once the subject of debate. The history of science is littered with such examples. The Galileo Affair, Einstein and Bohr’s debates over quantum theory, and the uproar over Alfred Wegner’s theory of tectonic drift are but few examples of disagreements with great consequence. Even now, debates continue over topics ranging from the value of the hubble constant to the evolutionary origins and role of dance.

                When it comes to disagreement in science, one thing is obvious: it’s everywhere. Yet, the true extent of disagreement is still not well known. Countless theories posit the central role of disagreement to epistemic progress, yet empirical evidence is often limited to case studies, ethnographies, and historical examples, which while immensely valuable, can’t be generalized across all of science. For decades though, this was the only kind of data available. Fortunately, the increasing availability of scientific full-text has allowed newfound progress, making it possible to study disagreement quantitatively across all of science.

                A new approach to study disagreement

                In our study published in eLife, we develop a novel approach to identify disagreements from citation sentences. We define disagreement in two ways. The first is paper-level, the most clear-cut case of direct and explicit disagreement from one paper to another over any aspect of its findings, interpretations, or design. The second is community-level, such that a paper signals controversy and debate within the broader field. These two types of disagreement are exemplified in the following cases:

                • Paper-level: “We find that coffee does not cause cancer, contrary to the finding of <ref> that coffee does cause cancer.”
                • Community-level: “There remains controversy in the scientific literature over whether or not coffee is associated with an increased risk of cancer <refs>.”

                By considering both of these types, we are able to capture the full extent of scientific disagreement. Working from our definition, we develop a novel, cue-word based strategy for identifying citation sentences as cases of disagreement. For example, words like “challenged” and “conflict” can signal disagreement, especially when accompanied by words relating to objects of disagreement (e.g., results of methods). We devise 65 queries, and through extensive manual validation, select only the best to form a single disagreement indicator. This final indicator is precise, easy-to-scale (implemented in SQL), and wholly transparent.

                Fig1 d murray 2
                Figure 1: Rates of disagreement across disciplines

                A complex landscape of disagreement

                Using our indicator, we search for disagreements across the citation sentences of nearly 4 million articles indexed in Elsevier’s ScienceDirect database. What this immediately reveals is that disagreement is highest in the social sciences, and lowest in fields like physics and computer science (Figure 1). This almost exactly mirrors Auguste Comte’s “Hierarchy of Sciences”, a theoretical model for organizing disciplines. Fields at the bottom of the hierarchy, like physics, can postulate simple and general theories, a task that becomes increasingly difficult moving up the hierarchy towards the social sciences. Yet as we dig deeper at the level of sub-fields, a more complex picture emerges.

                Figure 2. Disagreement across over 800 sub-level fields, broken down by the high-level field and notable meso-fields highlighted with journals within them.

                Examining 817 sub-fields (Figure 2), we see how the “hierarchy of sciences” begins to break down. Within the Biomedical Sciences, disagreement is highest in fields studying the social aspects of healthcare. In the Life Sciences, Paleontologists end up disagreeing more akin to sociologists than to their natural science counterparts, reflecting the inherent challenges of geological records. An interactive tool published alongside our study allows anyone the opportunity to dig into our data and uncover the heterogeneity of disagreement.

                So while it’s true that disagreement is everywhere, we demonstrate that it is not uniformly distributed. Simplistic models, such as the hierarchy of sciences, cannot explain the complex landscape of disagreement observed in our study. Instead, the roots of disagreement are multi-faceted. Individual scientists disagree over differences in approach, interpretation, and background. Their likelihood to disagree is, in turn, the result of the kinds of evidence, methodology, and culture that varies across disciplines. Accounting for these many factors is essential for a better understanding of disagreement.

                Setting a path forward

                Our study offers a glimpse into where disagreement happens in science, but it also sets a stage for addressing questions such as what causes disagreements? and why do they matter? We make some progress on each, finding evidence of social factors at play (e.g., disagreement focused on recent, rather than past papers) and the implications towards impact (e.g., papers that disagree receive more citations). These results are preliminary, but they provide the foundation for addressing more and more consequential questions about scientific disagreement.

                One of the key questions is the normative one: is disagreement good for science? Existing theories argue that disagreement forces researchers to collect new evidence and reckon with differences in worldview, pushing knowledge forward. But disagreements can also erupt over simple miscommunications, causing progress to stall.

                Whether or not disagreement is necessary for advancement, it is clear that it’s ubiquitous, touching nearly every aspect of scientific activity. As scientometricians, it is necessary that we better understand disagreement, not only to build stronger theories of scientific progress, but also to inform policies and practices that take into account the role of disagreement in science.

                Ironically, a science of scientific disagreement requires consensus—clear definitions and methodologies are needed to make progress. Our study sets up a foundation, one that can be collectively built upon to address this challenge. The method we introduce is robust, transparent, and open to anyone to improve; to support further progress, our code and data have been published alongside our study. Of course, disagreements over our approach are welcome—they may even lead to stronger and more impactful science.

                ]]>
                Wout LamersKevin BoyackVincent LarivièreCassidy R. SugimotoNees Jan van Eckhttps://orcid.org/0000-0001-8448-4521Ludo WaltmanDakota Murray
                Priority-2030: the New Excellence Initiative from Russiahttps://www.leidenmadtrics.nl/articles/priority-2030-the-new-excellence-initiative-from-russia2022-01-17T10:55:00+01:002024-05-16T23:20:47+02:00Dmitry Kochetkov is PhD candidate at CWTS. In this post, he gives an update on Priority-2030, a new excellence initiative in the Russian higher education sector. He also makes some reflections on the role of this experience in the global context of higher education reform.Since the mid-1990s, excellence initiatives in higher education have become part of the world's political discourse. Many governments have spent billions of euros in an effort to transform national higher education systems and achieve the so-called "world class". The effectiveness of these programs is a subject of scientific and policy debate now.

                Russia launched several reform programs, the most famous of which is Project 5-100 (5top100), which lasted from 2013 to 2020. The goal of the program was to place five Russian universities in the top 100 world university rankings. Formally, the goal was not achieved, but many experts noted the positive effect of the project for Russian higher education (although, of course, there were also many critics). In May 2021, the Russian government announced the launch of the new excellence initiative Priority-2030. I think the Russian experience is interesting in the global context of higher education reform.

                The Priority 2030 program is a unified program not limited by territorial, sectoral, or other principles. The Program is aimed at involving a wide range of participants; therefore, it provides several tracks for entering. There are four groups of entry criteria:

                • The first group of criteria characterizes the scale of the university and thereby assesses the potential for its contribution to the socio-economic and scientific-technological development of the country or a specific region (quantitative criteria).
                • The second group of criteria takes into account the specifics of the universities with a creative focus and is developed specifically for such entities. For the first time, the program provides special conditions of entry for the universities specialized in arts.
                • In accordance with the third group of entry criteria, universities that meet two criteria from the first group (scale) can participate in the Priority 2030 program as candidates. To obtain candidate status, the university must commit to meeting the first group of entry criteria no later than two years after the selection. Besides, the government body of the region, on the territory of which the university is located, and (or) the federal executive body, and (or) the industrial organization must commit themselves during this period of time to provide additional financial support for the implementation of the university development program in the amount of not less than the minimum size of the basic part of the grant.
                • The fourth group of criteria is focused on increasing the potential of universities that meet at least two criteria from the first group through the merger with other universities and (or) scientific organizations.

                It should be emphasized that the listed requirements are minimal: they are necessary for the opportunity to participate in the selection, but the success depends on the ambitiousness of the goals, objectives, planned qualitative and quantitative commitments that the university undertakes as part of its development program, as well as on elaboration of the tools to achieve them. University development programs are based on strategic projects, usually of an interdisciplinary nature.

                The competitive procedure in 2021 was carried out in two stages. At the first stage, 106 universities were selected to receive the basic part of the grant (100 million rubles per year, or approximately 1.17 million euros). 54 universities continued to fight for the special part of the grant on two tracks: research leadership and territorial / industry leadership. As a result, 46 universities were selected to receive the special part of the grant. The beneficiaries were divided into three groups based on the Program Council's assessments. The winners of the first group, in addition to the base part of the grant, will receive 994.5 million rubles by the end of 2022 (11.6 million euros), the second 426.2 million rubles (5 million euros), the third 142.1 million rubles (1.7 million euros). There is a procedure for the rotation of universities; the next selection will take place in 2023.

                Priority 2030 is not just a continuation of the Project 5-100. The design of the program takes into account not only the best practices of previous initiatives but also their shortcomings. In particular, the program provides:

                • Rejection of global university rankings as a basis for evaluation
                • Engagement of as wide a range of participants as possible to avoid the Matthew effect on the national higher education system
                • Rotation of program participants to maintain a competitive environment

                So here we observe the same shift from university rankings to national and local relevance, and partnerships with the industry that we saw earlier in China.

                Taking into account the number of participants (106), the Program is the most massive in the history of Russian higher education reforms and is comparable only to the Chinese Plan 211 in the world. At the same time, there are those who believe that the project will negatively affect the universities that do not participate in the Program. Probably, such concerns will always accompany project initiatives.

                Another concern is that the amount of government funding will not be sufficient for the real transformation of universities. It is difficult to disagree with this. The Program can be successful only under the condition of maximum involvement of business and regions in the process of university development. Such involvement implies attracting extra-budgetary funding sources to finance development and transformation programs (I consider the lack of such sources to be the main problem of Russian higher education at the current stage). Only time will tell whether the participants of the Program will cope with this difficult task.


                This text is solely the personal position of the author and was prepared on the basis of materials in the public domain.


                Credit for header image: Priority-2030

                ]]>
                Dmitry Kochetkov
                Expanding the visualization toolbox: Lessons from a Tableau traininghttps://www.leidenmadtrics.nl/articles/expanding-the-toolkit-lessons-from-a-tableau-training2022-01-12T01:30:00+01:002024-05-16T23:20:47+02:00Visualizing results is a crucial part of our work at CWTS and essential for interacting with our audience. Consolidating and enriching our knowledge of the Tableau software in a two-day advanced course was one step in that direction. Here, we share some of the experiences and lessons learned.A large part of our daily work at CWTS consists of collecting, analyzing and presenting data - be it in our research, for institutional projects, or for our research agency. Over the years, CWTS has paid particular attention to developing conversational and participatory approaches to understand science and its dynamics. One way of doing so is to use tools that enable communication with stakeholders and that involve researchers, research managers, policy makers, funders, and other stakeholders in the dialogue about science. Pertinent examples may be the interface for the Leiden Ranking, or the VOSviewer software with a recent update that facilitates sharing network maps online - very much in step with calls for more interactive and accessible visualizations.

                As a consequence, our work revolves a lot around questions such as: How can I optimize the way I am sharing my work? How can I make best use of tools to provide more insights? And of course, we are aware that expanding one's toolkit can open up entirely new possibilities. When it became clear that the reporting of results was one aspect in which we could be more advanced, we took a closer look at Tableau.

                Using Tableau at CWTS

                You could think of Tableau as a very advanced form of Excel - but the comparison is not really accurate. As a “visual analytics platform”, Tableau focuses on making data more accessible to people, especially by means of visualization. This was what we were looking for - a solution that could facilitate interactive dashboards and dynamic, tailored reports.

                Two years ago, a team of colleagues from CWTS had followed a Tableau Fundamentals training to learn the basics of Tableau. We put this new knowledge into practice right away - for example in a project around the uptake of online media attention for Covid-19 publications. Recently, we wanted to improve our Tableau skills further, so we took an advanced course in Tableau. Besides the more technical aspects, taking the course was an opportunity to reflect on our work processes and on how we create visualizations more generally - but also on how we acquire such new skills.

                Consolidating our knowledge

                During the two days of training, we revisited fundamental Tableau concepts, including special calculations, the order of operations, and data modeling. (Apparently, getting those concepts right is crucial for a smooth workflow in Tableau. It’s worthwhile investing a bit in understanding them!) We were also acquainted with new practices using our own data models (e.g., building advanced visuals and validating calculations).

                When it came to thinking about visualizations in the course, one lesson hit home in particular: You have to consider the message that you want to communicate through the graphs produced in Tableau. Ultimately, this comes down to thinking visually, not so much from the perspective of a reading, but an exploring user.

                At the end of the second day of the training, we worked on an exercise in which we were asked to use a table (Table 1) that contains indicators that we commonly use at CWTS and redesign it by using pencil and paper and a splash of creativity. After drawing the visualization on a piece of paper, it was time to build this visual in Tableau. At the end of the practice, we shared our work and discussed some of our attempts (see Figures 1-3).

                Tableau figure1b
                Table 1. The input table with bibliometric indicators (left) and Figure 1. Some first ideas drawn on paper (right).
                Tableau figure2
                Figure 2. One attempt to create a steam graph: It turned out that these flowy shapes are not so easy to implement in Tableau unfortunately.
                Tableau figure3
                Figure 3. A suggestion from our trainer: Pareto Chart.

                On learning a new tool

                What is the best way to ‘learn’ a new tool? Of course, a thorough course is a good starting point. However, nothing beats “learning by doing”. You have to ‘struggle’ through the whole process yourself, repeatedly. Also, we noticed that in the time between the basic and the advanced course (1.5 years), the knowledge acquired got lost quite easily without continuous practice.

                The complexity of the data that we use (working with publication ids with different affiliations, different authors names, etc.) can be a challenge. A brilliant team at CWTS is dedicated to evaluate the data collected and aims to provide a consistent and transparent curation. So the preparation of the data is done in-house. However, creating relationships and using joins in Tableau can be rather tricky, especially when you are used to the transparency of scripts e.g., in SQL. After all, you don’t want to ‘lose’ any data!

                Related to that, we found that it requires some time to appreciate the benefits of Tableau when you have relied on other tools for a long time. This is part of the learning process itself and requires some reflection on your processes and workflows. In the end, you have to find out how and where to fit in Tableau.

                One attractive element is the possibility to publish the dashboards online via Tableau online or Tableau public and to allow the reader to become an active user. They can interact with the visualizations (e.g. choose a certain filter and/or dig into more detail). However, what is important to keep in mind is that we need to be very explicit in what we want to show and to label the titles, etc. adequately to make it comprehensive and intuitive for the readers.

                Conclusion

                Following this (online) training was quite intense but most certainly valuable for our organization. Learning new possibilities to visualize our data allows us to think critically about dashboards for our audience.

                However, having the many options offered by Tableau also makes you rethink your way of working - how you prepare data, how much time you spend on visualizing results, up to the delivery of results and visualizations. While previously, we relied a lot on reports delivered as Pdfs or Word documents, we may now as well share interactive dashboards. Here is where a good understanding of how visualizations work best comes in handy.

                Working with Tableau is not a solitary exercise and does not only involve the maker and the audience. It is a matter of teamwork as well: acquiring skills in the specific context of our work requires transferring and exchanging knowledge among colleagues. Other options are to work with templated solutions for recurring problems. This notion was captured very nicely by one colleague: “the most important asset of the training was to get together. It will lead to more synchronized approaches and visuals”.

                Photo credits header image:Agence Olloweb

                Disclaimer: This blog post reflects the authors' opinion only. It has not been sponsored in any way.

                ]]>
                Jonathan Dudekhttps://orcid.org/0000-0003-2031-4616Carole de Bordes
                To Count or not to Count: How to Deal with Funding Acknowledgementshttps://www.leidenmadtrics.nl/articles/to-count-or-not-to-count-how-to-deal-with-funding-acknowledgements2021-12-15T16:04:00+01:002024-05-16T23:20:47+02:00In this blog post we examine academic funding acknowledgements (FAs), and compare our FA database with that of Dimensions. Using a case study, we explore how FAs work, who they are for, and how we can improve FA practices.Funding data (and the funding database)

                Funding acknowledgements are a familiar component of scholarly publications. In most cases, authors use this segment of the publication to list any grants, programs or other forms of financial support that made the research possible. In some cases, authors also use this space to express gratitude for any personal support they have received.

                For the uninitiated, these snippets of text may seem innocuous, but in fact they reveal the behind-the-scenes workings of scholarly publishing. They are useful for funders who have a vested interest in accurately tracking the research output of their grants. They are also of interest to readers who are interested in which funding entities are responsible for what research.

                Within CWTS’ A-team, we have developed the structure of the so-called funding database, the aim of which is to create a taxonomy of funding organizations, while also enabling more research into this nascent field. This in-house database is based on Web of Science funding acknowledgment data, which itself is based on processing the acknowledgment text sections and extracting the relevant funder names and grants. After some CWTS preprocessing, these data can then be used to map the previously opaque support network which underlies the scholarly publishing space.

                The new player in town: Dimensions

                In addition to Web of Science, a new source of funding data has become available in recent years: Dimensions. Part of the ensemble of Digital Science products, Dimensions uses a comprehensive methodology to acquire funding data. According to its website, Dimensions employs a three-pronged approach to creating the connection between publications and grants:

                1. Mining and extracting the funding acknowledgement section
                2. Receiving information directly from funders
                3. Extracting connections from PubMed and CrossRef

                Furthermore, Dimensions identifies funding organizations using GRID, Digital Science’s immense global database of over 100,000 research-related organizations. The differing methodology combined with the huge scale of GRID make Dimensions a potentially interesting source of funding data, which could serve to complement or provide quality control on the already existing database.

                Case study: the NWO

                In order to compare the Dimensions funding data to our own, we examined the research output and related grant data of the largest funder in the Netherlands, NWO. As noted on the NWO website, the NWO-I (the institutes organization of the NWO) manages 9 national research institutes, and there are an additional 8 suborganizations under the NWO.

                To properly compare the two databases, we need to make sure that we are making a fair comparison. Web of Science only began collecting (or at least making public) funding data from 2008 onwards, and has collected pre-2008 acknowledgments only marginally. Dimensions on the other hand has no such cut-off point in their collection. The comparison can be seen in Figure 1.

                Count of funding acknowledgements in each database by year.

                Figure 1: Count of funding acknowledgements in each database by year.
                To make the comparison sensible, we limit our comparison to publications from 2008 and onwards. Additionally, we only include publications which are indexed in both databases, since many publications (and thus funding acknowledgements) are unique to each database, as shown in Figure 2. The databases are connected through stable identifiers, namely DOI and PubMedID.

                Comparison between Web of Science and Dimensions from 2008 onwards

                Figure 2. Comparison between Web of Science and Dimensions from 2008 onwards (*Unique number of funding acknowledgements from each database, from 2008 onwards)
                In general, when examining the funding database, one needs to take the level of granularity into consideration. In other words, a decision needs to be made beforehand about whether it is more interesting to know about the total publications of the NWO as a whole (Figure 3), or about the publications resulting from each suborganization (Figure 4). This decision depends on the aim of the research. For instance, the former case may be more useful when comparing the national research funders of different countries, while the latter may be more interesting when analyzing the funding outcomes of each individual suborganization.

                The parent-level allocation, where the funding acknowledgements are aggregated at the parent organization level. In this sample, the NWO is marked as having funded 3 publications.

                Figure 3: The parent-level allocation, where the funding acknowledgements are aggregated at the parent organization level. In this sample, the NWO is marked as having funded 3 publications.
                The parent allocation is possible due to the relations between organizations gathered on CWTS’ internal organization registry. These relations are maintained and updated by the A-Team.

                The child-level allocation, in which funding is analyzed under the lens of the individual sub organizations.  In this sample, both the CWI and NWO are marked as having funded 2 publications.

                Figure 4: The child-level allocation, in which funding is analyzed under the lens of the individual sub organizations. In this sample, both the CWI and NWO are marked as having funded 2 publications.
                The amount of funding acknowledgements attributed to each of the suborganizations in the different databases is shown in the table below. In the ‘Aggregate Count’ column, only the main parent organization is considered (as in Figure 3). In the 'Detail Count’ column, organizations are counted if they appear in the original acknowledgment (in other words, the child institutes are here counted individually as funders). As such, we can see that the funding acknowledgements are more distributed using the ‘Detail Count’. We can also note that there are more funding acknowledgements attributed to NWO in the CWTS database than in Dimensions.


                The discrepancies in total funding acknowledgements between the first two columns, CWTS’ two different counting systems, do beg the question: how should one attribute the credit for the funding: to the parent or the child institute? Additionally, how does one define the parent/child relationship? For instance, ZonMw (The Netherlands Organization for Health and Research and Development), and the NWO Domain Applied and Engineering Sciences do not contribute to the total count of the NWO because they are considered as independent funders in our database. This type of classification implies a different type of role and function for ZonMw compared to the other suborganizations of the NWO. This is an ontological issue, one which the A-Team deals with on a semi-regular basis. Ultimately, there is no definitive acknowledgment count; instead, the answer to the query depends on a case-by-case basis, based on what the researcher or funding agency is looking to find out. Our job is to make the database as capable as possible to deal with all such possible queries.

                For a more detailed examination, we now look at two of the publications attributed to suborganizations in the Detail Count, but not featured in either of the other counts.

                DOI

                Funding text

                10.1109/toh.2012.22

                This work was supported by Heemskerk Innovative Technology B.V., NL. Part of this work was supported by European Communities, carried out within the framework of EFDA (WP10-GOT RH) and financial support from FOM Institute DIFFER. The views and opinions expressed herein do not necessarily reflect those of the European Commission.

                10.1109/toh.2015.2406708

                V. M. Kodach and J. Kalkman are supported by the IOP Photonic Devices program (IPD067774) managed by the Technology Foundation STW and SenterNovem. D. J. Faber is funded by a personal grant in the Vernieuwingsimpuls program by the Netherlands Organization of Scientific Research (NWO) and the Technology Foundation STW (AGT07544)


                Here, the child institutes are directly attributed. In the first example, it would be impossible to attribute the publication to NWO funding without prior knowledge of the relationship between child and parent institute. Yet, should who gets credit really depend on the specific phrasings used in the acknowledgment section?

                How to move forward: efforts at standardisation

                Most likely, the difference in numbers above also stems from the databases’ different approaches in obtaining their data: one goes through the acknowledgment text while the other (also) gets its data directly from the funder itself. While we will continue to work hard to follow the funding streams and improve the accuracy of our data, funders, researchers and journals can also do their bit to improve the situation.

                One recent development in acknowledgment practices has been for funders to stipulate in more precise terms how researchers need to acknowledge their funding. The NWO, for instance, gives the following template:

                This publication is part of the project [name project] (with project number [insert project number] of the research programme [name research programme] which is (partly) financed by the Dutch Research Council (NWO).

                Such templates might serve to shift back control to funders on which of their grants are acknowledged on which level. In the above case, if NWO wants funding credit to go to a specific institute, it can change the template. Moreover, it also urges researchers to include more detailed information like project names and numbers, which can ultimately help databases to more accurately track funding streams.

                In order for such templates to work, researchers need to do their part by consistently following them. If a template does not exist, being accurate and complete goes a long way: include the official funder name and anything trackable like project and grant numbers.

                Journals too have started to aid the process by providing dedicated funding fields in their application forms of their submission systems, as for instance the PLoS journals do. This way, financial support gets clearly distinguished from acknowledgments of gratitude (for instance).

                These templates and alternative acknowledgement practices are steps towards answering the eternal question in funding acknowledgement research: to count or not to count.

                Part 1 of the series on Funding Acknowledgements in Academic Publishing

                ]]>
                Tobias NostenClara Calero-MedinaJeroen van Honk
                Make maps of research interactive, detailed and open!https://www.leidenmadtrics.nl/articles/make-maps-of-research-interactive-detailed-and-open2021-12-06T16:34:00+01:002024-05-16T23:20:47+02:00Network maps are essential tools in quantitative research studies. In this blog post I argue for interactive maps that show both overview as well as details, are openly accessible, and based on open data. Such maps add value by providing more information, enhanced transparency and interpretability.Bibliometric maps have been created for decades to provide overview of research and to make it possible for researchers to study different aspects of the research landscape, such as collaboration patterns, structure of research fields and citation relations. Several tools have been created that make it easy to create maps from bibliographic records imported from different data sources. Using these tools, maps can be created without any coding. The end result is often a static image showing some nodes and their relations. The maps are useful, because they simplify large amounts of data and highlight patterns in the data.

                Static maps must be reduced to a limited number of nodes and edges to be readable. If we deal with large publication sets, this means that data must be either heavily restricted or aggregated. A lot of detail is being lost in this process, leading to reduced transparency and decreased interpretability. A new version of VOSviewer has made it possible to create bibliometric maps and publish them online. Such maps offer more interactivity by zooming capabilities and information can be shown when clicking nodes or edges. This interactivity makes it possible to visualize more nodes and to provide more information.

                In a visualization of a classification of biomedical research literature, based on more than 3 million publications in PubMed, I go one step further. The visualization provides interactive features to navigate from broad disciplines down to narrow topics and retrieve the publications underlying the classification. Thereby, the visualization provides both overview of a vast amount of research literature as well as details down to individual publications.

                Figure 1. Map of biomedical research (2018-January 2021). View in separate tab. The map may take a while to load and may not display properly using smart phones or tablets.

                The visualization, which shows the recent three years period (2018-January 2021) is based on a classification of publications created by clustering publications in a citation network. The full classification currently contains about 18 million publications in PubMed from 1995 onwards and has been based on open data (PubMed and the NIH Open Citation Collection). All data are available in figshare.

                Three levels are visualized in the map: (1) broad disciplines shown as large nodes, (2) underlying specialties shown as a network of smaller nodes and (3) topics shown as lists when clicking a specialty. From the list of topics, a link takes the user to the underlying publications in PubMed. Details about the classification and visualizations are described in a recent preprint titled “Improving overlay maps of science: combining overview and detail”.

                Using the map, one can for example study research related to the ongoing pandemic caused by SARS-CoV-2. The underlying topics in the Covid-19 cluster shows research focusing on mathematical models of the outbreak, clinical treatment, psychological impact, testing methodologies and specific symptoms. By the possibility to retrieve the individual publications, the map can be used for exploration and information retrieval. Most maps of research do not provide this feature.

                Figure 2. Map of SARS-CoV-2/Covid-19 research. View in separate tab. The map may take a while to load and may not display properly using smart phones or tablets.

                Another application is the opportunities given by overlays. We may for example set node sizes or colors based on some variable, such as open access publishing, citation rates or growth rate. This makes comparisons of fields possible. For example, this map of open access publishing shows a high share of open access publishing in corona virus research, but a low rate in biophysics and biochemistry. The map provides both overview of the open access publishing as well as details down to narrow topics.

                Figure 3. Map of open access publishing in biomedicine 2018-2020. View in separate tab. The map may take a while to load and may not display properly using smart phones or tablets.

                Interactivity and detail facilitate interpretation. The user can use information about relations to other clusters, underlying topics and retrieve publications when interpreting the contents of clusters. Nevertheless, many challenges remain. Clustering methodologies can be improved by making the resulting classifications easier to interpret, also outside the field of quantitative science studies. Overlaps of fields may be integrated into the maps and there might be better ways to position the nodes in the maps. I think that visualizations of this kind make weaknesses more apparent and provide a good point of departure for further development.

                The results of the clustering methodologies are made transparent by providing interactive features and by making the maps and underlying data openly available. Anyone can navigate the map and get an impression of its validity, and anyone can download it and evaluate its strengths and weaknesses. My hope is that this transparency can contribute to improved clustering methodologies and more user-oriented maps of research. I think that bibliometric maps of other types should follow this example: (1) make the maps interactive, (2) provide as much detail as possible, and (3) make the underlying data openly available.

                ]]>
                Peter Sjögårde
                Multiple-affiliation researchers as bridgebuilders in research systemshttps://www.leidenmadtrics.nl/articles/multiple-affiliation-researchers-as-bridgebuilders-in-research-systems2021-11-09T11:10:00+01:002024-05-16T23:20:47+02:00Researchers holding part-time positions at different organisations may contribute to the efficiency of inter-organisational collaborations, but what are the drivers underlying these collaborations? We performed an empirical study to explore the role of geographic and institutional proximities.To tackle today’s societal challenges requires research collaboration across organizations and disciplines. Making research collaborations work is not always easy, especially when collaborations involve diverse organisations and stakeholders who do not necessarily share the same logics and objectives. We conducted a study on researchers holding part-time positions in different organisations, considering them as key ‘bridge persons’ connecting organisations in the research landscape, linking heterogeneous organisations fostering coordination and exchange of knowledge.

                More specifically, we analysed the drivers of researchers holding multiple appointments. To this end, we rely on the notion of proximity. We focussed on the effect of geographic and institutional proximity on the number of researchers holding part-time positions among any two organizations. The methodology we developed could also serve as a framework to benchmark national innovation systems of different countries. Such comparative exercise could reveal the relative importance of travel distance and institutional barriers in each country.

                The Netherlands as a case study

                In order to explore the role of geographic distance and institutional proximity for researchers holding multiple affiliations, we focused on a country whose research system we know quite well: The Netherlands. Using scientific publications retrieved from the Web of Science, we identified all authors who simultaneously indicated two or more institutional affiliations in the Netherlands (we excluded for this study authors whose multiple affiliations included foreign organisations). The selection process relied on an algorithm developed some years ago by colleagues at CWTS, which allows for the identification of all the publications produced by a given individual. As we wanted to focus on those researchers with a truly part-time position rather than researchers changing jobs, we selected only those researchers indicating the same multiple affiliations in 2016 and in 2018. Following this rather conservative criterion, we identified 2,828 researchers employed by 626 Dutch organisations. The resulting inter-organisational network included nearly two hundred thousand unique organisation pairs (195,625 pairs, to be precise). Obviously, the vast majority of organisations included in our study did not have any researcher linking them through her multiple institutional affiliations. Only slightly less than 1% of all these pairs of organisations were actually connected through one or several researchers with multiple affiliations. Figure 1 depicts the inter-organisational network, including only organisations with four or more co-affiliated researchers.

                We then tested whether the number of co-affiliated researchers to a pair of organizations depends on the geographic and institutional proximities between organizations using a gravity model, quite popular among geographers of innovation. We measured the geographic distance between two organizations by the time required to travel from the municipality of the one organization to the municipality of the other organization.

                Figure 1 ayegros nov21 tif
                Figure 1. Inter-organisational network derived from authors listing multiple affiliations. The sizes of the nodes represent the numbers of publications of the organisations (2016 and 2018) and thickness of the lines the number of researchers connecting them through multiple affiliations.

                Additionally, we considered institutional proximity when two organisations linked by a researcher with multiple affiliations belong to the same institutional sector. For this, we classified all the organisations in institutional sectors: University, Industry, Government, Public Research Organisation (PRO) and Healthcare organizations. Figure 2 shows the same network of organisations as Figure 1, but including colours to indicate the institutional sectors.

                Figure 2 ayegros nov21
                Figure 2. Institutional sectors in the Inter-organisational network derived from authors listing multiple affiliations.

                What does our analysis show?

                First (as we expected), travel time clearly decreases the chances of multiple affiliations. That is, the longer the geographic distance between two organisations, the less likely a researcher will be affiliated simultaneously to these two organisations. In other words, researchers with dual appointments tend to be affiliated with two organisations located nearby one another, indicating the relevance of commuting time. Regarding institutional proximity, our results indicate that researchers holding multiple affiliations do not prefer to work for organisations in the same institutional sector. Rather, they tend to cross institutional sectors, and in doing so they could indeed be acting as bridging persons who connect heterogeneous organisations. Thus, these researchers may contribute to creating bridges between these (sometimes very) different types of organisations, guided by different logics and objectives. In a further exploration of the role of institutional proximity, we found that mainly university researchers play the central role in connecting the entire national research system through co-affiliations with industry, government, healthcare and PROs, as well as among universities themselves.

                Implications

                We consider that individuals holding part-time positions in several organisations represent a very special actor in the research landscape, even more when the organisations they connect operate in different sectors. Individuals, rather than formal arrangements, may find it easier to cross institutional boundaries between university, industry, government, PROs, and healthcare organizations. While connections can also be made via alternative arrangements (e.g. public-private partnerships, contract research, participation in joint research projects, among others), having researchers with dual appointments may represent a very efficient and effective way in navigating potential conflicts when trying to connect very different organisations. At the same time, such individuals should be supported in their complex roles avoiding conflicts of interest at the personal level.

                If you would like to learn more about our study, you can find the full version here


                Photo credits header image: Alex Azabache

                ]]>
                Alfredo YegrosGiovanna CapponiKoen Frenken
                Making my peer review activity more usefulhttps://www.leidenmadtrics.nl/articles/making-my-peer-review-activity-more-useful2021-10-13T15:30:00+02:002024-05-16T23:20:47+02:00Ludo Waltman studies peer review in a project of the Research on Research Institute (RoRI). In this blog post he discusses how he wants to make his own peer review activity more useful.Peer review: Time well spent?

                Peer review is a time-consuming activity. In 2020 I received 73 invitations to review a new article submitted to a scientific journal. On average, reviewing an article, both the original version and possibly also subsequent revised versions, probably takes me about seven hours in total. I am in the fortunate situation of being able to invest a significant amount of time in peer review. Of the 73 invitations that I received in 2020, I accepted 24, resulting in an estimated time investment of 24 × 7 = 168 hours in peer review of journal articles.

                Is the time invested in peer review well spent? To some extent I believe it is. As a reviewer I think I usually manage to help authors improve their work. In most cases, I am probably also able to provide useful advice to the editors of a journal helping them decide whether to publish an article or not.

                Nevertheless, despite the value my reviews may have for authors and editors, I often do not feel satisfied with the way my reviews are used. A review is typically read by just a few people: one or more journal editors, the authors of the article under review, and perhaps also other reviewers of the article. Importantly, readers of an article typically do not have access to the reviews of the article, even though the reviews may give them a lot of valuable information. Reviews are likely to offer readers an insightful perspective on the strengths and weaknesses of an article, and on issues on which authors and reviewers may not agree.

                By making reviews available only to the small group of individuals directly involved in the peer review process of an article, readers of the article are denied the opportunity to benefit from the information provided by the reviews. Given the significant efforts made by many reviewers to provide detailed comments on the articles they review, this is a major waste of scientific labor. For me personally this is why I tend to feel dissatisfied with the way my reviews are used, making me question whether the time I invest in peer review is really well spent.

                Making peer review more useful

                An important step toward making peer review more useful is to publish reviews alongside accepted articles, either with or without revealing the identity of the reviewers. This form of transparent or open peer review was pioneered by publishers like BMJ, BMC, EMBO, and eLife. It is gradually being adopted more widely, for instance by some Wiley and Springer Nature journals, and also by Quantitative Science Studies, of which I am Editor-in-Chief. A recent study shows that the number of journals offering some form of transparent or open peer review has increased rapidly over the last few years (see Figure 1).

                Figure 1. Number of journals offering some form of transparent or open peer review (source: Wolfram et al., 2020).


                Ongoing developments in scholarly publishing offer additional opportunities to make better use of the efforts of reviewers. Nowadays many articles are already available online on a preprint server (or in an institutional repository) long before they appear in a journal. For these articles, peer review can be made more useful by publishing reviews as soon as they are available instead of postponing this until the article appears in a journal (which may take months or even years, or which may not happen at all). Immediate publication of reviews provides valuable information to readers of the preprint version of an article. Publishers could facilitate immediate publication of reviews, as is done by F1000, but reviewers can also take care of this themselves by posting their reviews online.

                Reconsidering my own approach to peer review

                To make my own peer review activity more useful, I have reconsidered my way of working as a reviewer, partly also by taking inspiration from others (see for instance the approach to peer review taken by James Fraser at UC San Francisco). From now on, when choosing which review invitations to accept and which ones to decline, I will give priority to journals that offer transparent peer review. In addition, when I finish a review of an article that is available as a preprint, I will immediately publish my review online, so that readers of the preprint can benefit from it. I will also prioritize reviewing such articles over reviewing articles that are not available as a preprint.

                In the last two months, I published my first two reviews online. They are available here and here. I used the PubPub platform for this, but various other platforms can be used as well. Importantly, PubPub facilitates registering a DOI for a review and making the metadata of the review available through Crossref. This metadata includes a link between the review and the preprint version of the article under review. This link enables preprint servers and discovery tools to inform their users about the availability of a review for a preprint.

                One of the articles that I reviewed had a preprint on Research Square. For this preprint I posted a brief comment on the preprint platform to draw attention to my review. The other article had a preprint on SSRN, which does not provide the possibility to post comments. Unfortunately, this means that many readers of the preprint probably will not be aware of my review.

                Toward a broader initiative

                Some of the above ideas to make peer review more useful were discussed in a session that I co-organized with Cooper Smout (founder of Free Our Knowledge) and James Fraser in ASAPbio’s recent #FeedbackASAP workshop. As a result of this session, we are preparing a broader initiative to campaign for publishing reviews. If you want to provide input or show your interest, do not hesitate to post a comment on GitHub or to contact me directly.

                Figure 2. #FeedbackASAP workshop organized by ASAPbio.


                More information about the peer review project of the Research on Research Institute (RoRI) can be found here.

                ]]>
                Ludo Waltman
                Studying Marine Social Science with Mixed Methodshttps://www.leidenmadtrics.nl/articles/studying-marine-social-science-with-mixed-methods2021-10-11T14:10:00+02:002024-05-16T23:20:47+02:00Marine social science studies multifaceted relationships between people and oceans, marine and coastal environments. But it is not yet well integrated into ocean science and policy. This blogpost asks how we can use mixed methods to study the way marine social scientists make their research visible.The Case of Marine Social Science

                The health of oceans and marine environments – key to both the climate and the global economy - is receiving growing societal attention. Science and policy related to ocean and marine health are, for example, promoted by the United Nation’s Decade of Ocean Science for Sustainable Development (2021-2030). Better understanding the impact of human practices on oceans, marine environments and coasts is key to protecting and sustainably using them. This provides momentum for the marine social sciences – a collection of interdisciplinary research which explores the multifaceted relationships between people and oceans, marine and coastal environments. However, marine social scientists argue that even though the importance of their field is increasingly recognised, marine social sciences are not yet well integrated into marine and ocean research and policy:

                As the quote suggests, marine social scientists are actively working on creating relations with each other, as well as scientists from diverse disciplines and practitioners to better integrate the marine social sciences into ocean science and policy.

                This blogpost documents our ongoing mixed methods research which combines science and technology studies (STS) and quantitative science studies (QSS) in the FluidKnowledge project. It conceptually reflects on how we combine STS and QSS to explore the way marine social scientists build relationships with scientists, policy makers and practitioners, in their attempt to better integrate marine social science into ocean research and policy.

                Capturing Relations with STS and QSS

                Building on STS, we approach science as a set of relational practices that scientists perform on a daily basis. For example, they develop research agendas in collaboration with fellow scientists and practitioners, in light of funding opportunities and (disciplinary) epistemic norms and values, mediated by the data infrastructures and methods they use. Focusing on such relations can help explore how the marine social sciences engage and are engaged by diverse actors, including fellow researchers (from diverse disciplines) and practitioners.

                Quantitative science studies - including scientometrics and altmetrics - can help trace the relations of marine social science publications and marine social science related digital traces (e.g. project websites, social media accounts) to scientific literature and societal discussions, for example, using network analysis. We plan to benefit from quantitative science studies methods’ affordance to depict diverse relations. For example, we may map online discussions of marine social science through social media traces and weblinks, marine social science literature’s position on the science landscape and study changes in marine social science key topics using term maps.

                However, compared to STS’ focus on multimodal relational practices that unfold on diverse time scales, quantitative network analysis may ‘flatten’ relations. In other words, they may obscure the multiple temporalities, values, materialities and subjectivities that relations entail. These, however, are essential to understanding marine social scientists’ relationship building efforts – the challenges they face and the values they hold dear, that inform the development of their research agendas. To elicit experiences of such relationship building, we plan to discuss data visualisations with marine social scientists. As we discuss below, we plan participatory engagement by creating a first version of data analyses and visualisations that provide partial perspectives on marine social sciences and speak to their diverse relationalities. These visualisations – which we might alter in dialogue with experts - also help us extend our knowledge about marine social science which helps explore opportunities afforded by mixed methods science studies.

                Multiple Entry Points: Partial Mappings of Marine Social Science

                Marine social sciences explore diverse human practices in relation to the oceans, seas and coasts, drawing on diverse disciplines, including anthropology, economics, geography, law, political science and sociology. Recently, marine social scientists developed attempts to coordinate these diverse epistemic communities to set a global marine social science research agenda. Similarly, it is challenging to scientometrically delineate marine social science. Relevant papers are published across diverse journals, including (but limited to) the Maritime Studies, Marine Policy, Progress in Human Geography, Journal of Environmental Economics and Management, and journals associated with fisheries and coastal research. Keywords that could help capture ‘all’ marine social science papers but differentiate them from the ‘rest of’ ocean science or social science are challenging to identify.

                To reflect the scatteredness and diversity of marine social science, as well as the partiality of scientometric and altmetric mappings, we do not try to map the ‘entirety’ of marine social science. We feel that depicting marine social science on one map – whilst strengthening the perception of the field’s unity – would obscure the work it takes to coordinate the diverse epistemic communities that comprise it, and their diverse and evolving relations to ocean science and ocean policy. Rather, we chose diverse entry points to the scientometric, altmetric and webometric traces marine social scientists leave. For example, we may study published literature and digital traces associated with specific disciplines that comprise marine social sciences, marine social science papers published in specialised journals or papers and digital traces associated with a specific research agenda.

                Next steps

                Next, in a mixed methods study design which combines methods and insights from QSS and STS, we plan to create multiple data visualisations and discuss them with marine social scientists. For example, to explore a specific disciplinary subset of marine social science, we may map marine social science research which builds on interpretative social scientific research tradition, such as anthropology and human geography. We may also map changes in the topics and connections of papers published in a key marine social science journal: the journal Maritime Studies. Finally, we may study the connections of papers which study a key ocean policy relevant topic: blue growth and its limits.

                For each partial delineation, we plan to create a set of data visualisations that depict marine social science’s internal connections (using, for example, term maps), as well as its relations to ocean research (using, for example, maps of science) and online discussions (using social media and webometric traces). We hope that discussing the diverse relations partial mappings of marine social sciences depict with experts will help elicit narratives about the way they negotiate values and research agendas with diverse actors and how research (e)valuation impacts their work.


                This project is funded by the European Research Council under the Call: ERC-2018-STG, Grant Number: 805550 and Acronym: FluidKnowledge.

                ]]>
                Judit Varga
                The Initiative for Open Abstracts: Celebrating our first anniversaryhttps://www.leidenmadtrics.nl/articles/the-initiative-for-open-abstracts-celebrating-our-first-anniversary2021-10-06T12:00:00+02:002024-05-16T23:20:47+02:00In this blog post, Ludo Waltman, Bianca Kramer, and David Shotton, co-founders of the Initiative for Open Abstracts, celebrate the first anniversary of the initiative.On September 24 last year, the Initiative for Open Abstracts (I4OA) was launched. We started the initiative together with a group of colleagues working in the publishing industry, for scholarly infrastructure organizations, at university libraries, and at science studies research centers. I4OA called on scholarly publishers to make the abstracts of their published works openly available in a suitable infrastructure, preferably by submitting them to Crossref, and it continues to make this call. Openness of abstracts makes scholarly outputs easier to discover, it enables new types of research analytics, and it supports science studies research.

                In this blog post, we celebrate the first anniversary of I4OA by summarizing the progress made so far and by discussing how I4OA fits into the broader landscape of many ongoing developments toward increased openness of the metadata of scholarly outputs.

                How much support for open abstracts do we have?

                When I4OA was launched one year ago, the initiative was supported by 40 publishers, including Hindawi, Royal Society, and SAGE, who are founding members of the initiative. Among the initial supporters of I4OA there were commercial publishers (e.g., F1000, Frontiers, Hindawi, MDPI, PeerJ, and SAGE), non-profit publishers (e.g., eLife and PLOS), society publishers (e.g., AAAS and Royal Society), and university presses (e.g., Cambridge University Press and MIT Press). Some of the initial supporters of I4OA are open access publishers, while others publish subscription-based journals.

                Over the past year, the number of publishers supporting I4OA has more than doubled. The initiative is currently supported by 86 publishers. Publishers that have joined I4OA over the past year include ACM, American Society for Microbiology, Emerald, Oxford University Press, and Thieme. I4OA has also been joined by a substantial number of national and regional publishers, for instance from countries in Latin America, Eastern Europe, and Asia.

                In addition to this, I4OA is supported by a large number of stakeholders in the research system, including many scholarly infrastructure providers.


                However, Elsevier, Springer Nature, Wiley, and Taylor & Francis, the four largest publishers in terms of the number of published works, have not yet joined I4OA. These publishers appear to monetize their abstracts by selling them to abstracting services, and they seem to fear that joining I4OA may cause them to lose these revenue streams. Elsevier might also perceive openness of abstracts as a competitive threat to its Scopus business. Elsevier, Wiley, and Taylor & Francis have not yet submitted any abstracts to Crossref, while Springer Nature has started to submit abstracts, but only for its open access content.

                How many open abstracts do we have?

                On September 1, 12.3% of the 89.4 million journal articles indexed by Crossref had an open abstract. Focusing on the so-called current content in Crossref (i.e., content from the last three years), the share of journal articles with an open abstract is substantially higher. Of the 12.1 million journal articles in the period 2019-2021, 30.1% had an open abstract.

                Figure 1 shows the increase over the past few years in the percentage of journal articles in Crossref that have an open abstract. For current content, this percentage increased from 14.9% in September 2019 to 30.1% in September 2021, clearly showing the effect of I4OA. For backfiles (i.e., content that is at least three years old), the increase is more modest, from 4.8% in September 2019 to 9.5% in September 2021. This increase reflects the efforts made by several publishers (including Hindawi, Royal Society, and SAGE, three founding members of I4OA) to make abstracts openly available not only for their new content but also for all their older content.

                20211005 1
                Figure 1. Increase in the percentage of journal articles in Crossref that have an open abstract.

                The above statistics are specifically about journal articles. Looking at all content types in Crossref, including proceedings articles, book chapters, and books, the share of open abstracts is somewhat lower. On September 1 this year, 24.8% of the current content and 7.3% of the backfiles had an open abstract.

                Figure 2 provides a breakdown by publisher of the percentage of journal articles in Crossref in the period 2019-2021 that have an open abstract (horizontal axis). The figure also shows the total number of journal articles of a publisher in the period 2019-2021 (vertical axis; logarithmic scale).

                Figure 2. Number of journal articles of a publisher in Crossref in the period 2019-2021 vs. percentage of journal articles that have an open abstract.


                Publishers that support I4OA, colored orange in Figure 2, tend to have a high percentage of journal articles with an open abstract. They typically do not reach 100%, because some of the content they publish does not have an abstract. There are a few publishers that only recently started to open their abstracts, so for these publishers the percentage of open abstracts is still relatively low. Publishers that have not yet expressed support for I4OA are colored blue in Figure 2. Most of them have a low percentage of open abstracts, and many do not have any open abstracts at all.

                The progress made by individual publishers in opening their abstracts can be clearly seen by comparing Figure 2 with a similar figure published in this blog post last year.

                What else happened over the past year?

                A very positive development in the past year are the accomplishments of the Initiative for Open Citations (I4OC), a sister initiative of I4OA that campaigns for publishers to make the references of their published works openly available in Crossref. In the first half of 2021, Elsevier, American Chemical Society, and Wolters Kluwer all opened their references. With the exception of IEEE, all major publishers now support I4OC. This development seems to show that most publishers recognize the importance of making the metadata of their published works openly available, suggesting that many of them may also want to join I4OA.

                A less positive development was the announcement made last May that Microsoft Academic will be discontinued at the end of the year. At the moment, Microsoft Academic is the most important data source for open abstracts. As shown in a recent presentation by two of the I4OA founders, more than half of the scholarly outputs indexed both by Microsoft Academic and by Crossref have an open abstract in Microsoft Academic. Only 10% of these outputs have an open abstract in Crossref. Hence, the discontinuation of Microsoft Academic will greatly reduce the availability of open abstracts, unless publishers take up their responsibility to submit abstracts to Crossref. OurResearch, which is building a replacement for Microsoft Academic, has already announced that it will only be able to make abstracts available if publishers submit them to Crossref (or PubMed).

                Another important development is the growing adoption of the Principles of Open Scholarly Infrastructure (POSI). These principles aim to ensure that scholarly infrastructures serve the interests of the scholarly community, and they reduce the risk of the scholarly community losing its key infrastructures (as is happening right now with Microsoft Academic). The POSI principles have been adopted by Crossref and OpenCitations, two founding members of I4OA. OurResearch, mentioned above, has also expressed a commitment to these principles. By adopting the POSI principles, these infrastructure organizations have made a clear commitment to serve the interests of the scholarly community and to ensure the long-term availability of scholarly metadata.

                Next steps

                In light of the closure of Microsoft Academic at the end of the year, it is more important than ever to get broad support for I4OA. This is further reinforced by the increasing dependence of research analytics on abstracts. While research analytics based on citations continue to play an important role in research assessments and research on research (e.g., topic mapping, analyzing emerging trends and research fronts), the need to broaden the analytical toolbox is widely recognized. Many providers of research analytics are introducing new indicators and tools. In particular, analytics for assessing the contribution of research to the UN sustainable development goals (SDGs) are attracting a lot of attention (e.g., in the Times Higher Education Impact Rankings). These analytics typically identify SDG-related research by searching for specific terms (e.g., ‘climate change’, ‘hunger’, ‘poverty’, and so on) in the titles and abstracts of scholarly outputs. Openness of abstracts is essential to develop a proper understanding of what these analytics do and do not tell us, and to make sure these analytics are used in a responsible way.

                Publishers carry the primary responsibility for making abstracts openly available. We therefore call on publishers that do not yet support I4OA to join the initiative and to open their abstracts. The I4OA team is available to answer questions about the initiative and to provide help to publishers that want to join. Do not hesitate to contact us.

                We also encourage other stakeholders in the research system to actively support openness of abstracts. As shown in Figure 3, in a recent Metadata 20/20 webinar, participants mentioned abstracts as the most important metadata element for which openness should be an essential requirement in negotiations with publishers. This highlights the crucial contribution that research institutions and research funders can make by mandating openness of abstracts in their agreements with publishers.


                Figure 3. Metadata elements to be negotiated with publishers, as discussed by participants in a recent Metadata 20/20 webinar.


                This blog post is published under a CC BY 4.0 license.


                ]]>
                Ludo WaltmanBianca KramerDavid Shotton
                Practicing what we preach: Our journey toward open sciencehttps://www.leidenmadtrics.nl/articles/practicing-what-we-preach-our-journey-toward-open-science2021-09-28T13:30:00+02:002024-05-16T23:20:47+02:00CWTS just published its open science policy. The development of this policy was coordinated by Thed van Leeuwen and Ludo Waltman. In this blog post, they reflect on the journey CWTS is making toward more open ways of working.Today CWTS published its open science policy on its website. This policy, which formally came into effect on September 1 this year, is the outcome of a co-creation process in which many CWTS colleagues participated in a period of one and a half years. In this blog post, we discuss the why, the how, and the what of the CWTS open science policy.

                Why did we develop an open science policy?

                Over the past decade, CWTS has been involved in a large number of activities in the area of open science, ranging from monitoring of open access publishing and studying of open data practices to the development of open infrastructures and contributions to policy making around open science. However, while open science had become an increasingly important object of study in our work, many of our own research practices were still fairly traditional and not necessarily in line with an open science way of working. This led to a recognition that we needed to reflect more actively on our own research practices: Did we actually practice what we were preaching? And how could we do better? In late 2018, this process resulted in the decision to develop a CWTS open science policy.

                How did we develop our open science policy?

                We started by inviting all CWTS colleagues to participate in meetings in which the basics of open science were discussed and in which colleagues were asked to choose the aspects of open science they considered to be most important for CWTS. Four topics were chosen: open access publishing, open research data, open source software, and the relationship between open science and the work of CWTS BV. A number of colleagues then volunteered to prepare a policy around these four aspects of open science. All CWTS colleagues were given the opportunity to provide feedback on the proposed policy.

                The open science policy was formally approved by the CWTS board in June 2020. We then went through a one-year transition period (September 2020-August 2021) in which everyone at CWTS had the opportunity to familiarize themselves with the policy and to start implementing the policy in their work. Several meetings were organized during this transition period to support colleagues in the implementation of the policy. In September 2021, the policy formally entered into force. All research at CWTS is now expected to be carried out in accordance with our open science policy.

                What does our open science policy say?


                Guiding principles
                As a starting point for the CWTS open science policy, we formulated five principles that provide general guidance for the CWTS approach to open science:

                1. As open as possible, as closed as necessary

                2. Openness is not always easy.

                3. Openness takes time.

                4. Openness is a joint responsibility.

                5. Openness should not become a straitjacket.

                The first principle recognizes that openness is not always possible or desirable and that there may be good reasons to keep something closed. We will get back to this below in the discussion of open data. The second principle acknowledges that openness may come at a cost, for instance in terms of additional efforts that need to be made. The third principle emphasizes that becoming more open requires a culture change that takes time and will not happen overnight. The fourth principle makes clear that openness needs to be done together. No one can be expected to carry this responsibility on their own. Supervisors for instance have a responsibility to support their PhD candidates in adopting open science practices. Finally, the fifth principle recognizes that openness may sometimes need to be balanced against other important values, which in some cases may justify making exceptions to the open science policy.

                Open access
                Our open science policy requires all journal articles published by CWTS researchers to be made openly accessible, either in a journal (gold or hybrid open access) or in a repository (green open access). Also, when an article is submitted to a journal, posting the article on a preprint server (e.g., arXiv or SocArXiv) is strongly encouraged. Our open science policy encourages publishing in journals that are owned by the scholarly community and that adopt responsible publishing practices, for instance journals that support openness of metadata by participating in initiatives such as I4OC and I4OA. To support publishing in gold open access journals, CWTS pays article processing charges (APCs) of at most EUR 1200 from its basic funding. For APCs paid from grant funding there is no maximum. The open science policy also encourages open access publishing of conference papers, book chapters, and books, but the policy currently does not mandate this.

                To help CWTS colleagues make their research openly accessible, a toolbox has been created that provides information on the journals most frequently used by CWTS researchers. The toolbox for instance offers information on licenses under which research can be made openly accessible, APCs for open access publishing, and transformative agreements between the Dutch universities and publishers that may cover the cost of open access publishing.

                Open data
                Regarding openness of research data, our open science policy states that data should be as open as possible and as closed as necessary. By default, data should be made openly available, but there can be several reasons to keep data closed. For instance, in ethnographic research, data may be co-owned by research participants that do not want the data to be opened. In scientometric research, data may be owned by companies that do not allow the data to be opened.

                CWTS also follows the data management regulations of Leiden University. These regulations specify how data should be managed before, during, and after a research project. Unlike our open science policy, the data management regulations do not indicate whether data should be open or closed. Regardless of whether data is open or closed, our open science policy encourages compliance of the data with the FAIR (i.e., findable, accessible, interoperable, and reusable) principles.

                Open source
                Our open science policy distinguishes between two types of software, referred to as type 1 and type 2 software. Type 1 software represents a significant scientific advancement, while type 2 software is instrumental to scientific research but does not itself represent a significant scientific advancement. For Type 1 software, our open science policy requires the source code to be made open. The open source license (e.g., MIT, GPL, LGPL) can be chosen on a case-by-case basis. Examples of type 1 software developed at CWTS are the Leiden algorithm for network clustering and the recently released VOSviewer Online tool for interactive network visualization. Another example is the igraph package for network analysis, for which CWTS is one of the contributors. An example of type 2 software is the software developed by CWTS for parsing data delivered to our center by data providers such as Clarivate (Web of Science), Digital Science (Dimensions), and Elsevier (Scopus). According to our open science policy, the source code of type 2 software may or may not be made open, depending on what seems best for the sustainability of the software.

                CWTS BV
                Open science also aims to make research results more accessible for societal stakeholders and to involve these stakeholders in research projects. For CWTS this aspect of open science is for instance reflected in the contributions we make to Horizon projects funded by the European Union and to projects of the Research on Research Institute (RoRI). In addition, CWTS BV, a business unit affiliated with our center, also plays an important role.

                CWTS BV provides services to clients based partly on insights resulting from the research of CWTS. The other way around, projects carried out by CWTS BV also offer important input for the research agenda of CWTS. As an independent legal entity, CWTS BV is not subject to the CWTS open science policy. While openness and transparency are important values in the work of CWTS BV, the confidentiality requested by many clients of CWTS BV often limits the level of openness that can be achieved. For instance, to guarantee confidentiality, many reports of CWTS BV cannot be made openly accessible.

                Next steps

                In the coming years, we expect further updates to be made to the CWTS open science policy, partly based on practical experiences in the implementation of the policy and partly based on developments in the broader open science landscape and in the ambitions we have at CWTS to make our research more open. In fact, some CWTS colleagues are already adopting open science practices that go beyond the current requirements of the CWTS open science policy. For instance, some colleagues are systematically posting all their research on preprint servers and some have started to experiment with more open forms of peer review (e.g., online posting of review reports).

                In parallel with these developments, CWTS is also actively exploring the use of open infrastructures for research information. In line with our efforts to promote openness of bibliographic metadata and of research information more generally, we are for instance working on the institute-wide adoption of ORCID profiles to keep track of our activities and outputs. Likewise, in our scientometric work, we are making significant efforts to reduce our dependence on proprietary data sources and to optimally benefit from the opportunities offered by open data sources.

                Several CWTS colleagues have also expressed a desire for more formal ways of recognizing the efforts everyone at CWTS is making to adopt open science practices. This issue is currently being addressed as part of an ongoing project aimed at revising the approach we take at CWTS to recognition and rewards.

                We realize that our journey toward more open ways of working has just begun. We look forward to the next steps!


                We thank all (current and former) colleagues who contributed to the development of the CWTS open science policy, in particular Josephine Bergmans, André Brasil, Tung Tung Chan, Mark Neijssel, Clifford Tatum, Vincent Traag, Nees Jan van Eck, and Jochem Zuijderwijk.

                ]]>
                Thed van LeeuwenLudo Waltman
                VOSviewer goes online! (Part 2)https://www.leidenmadtrics.nl/articles/vosviewer-goes-online-part-22021-07-22T15:21:00+02:002024-05-16T23:20:47+02:00Last week, CWTS colleagues Nees Jan van Eck and Ludo Waltman published a post in which they announced the launch of VOSviewer Online. Today, they discuss a new update of the regular stand-alone VOSviewer tool, offering additional possibilities for making VOSviewer visualizations available online.Toward integration of data, computing, and tools

                Bibliometrics is often equated with straightforward numerical indicators like publication and citation counts, journal impact factors, and h-indices. Without any doubt these are indeed the most often used items in the bibliometric toolbox.

                However, the bibliometric toolbox is expanding in a number of important directions. Bibliometric data sources are becoming more open and more comprehensive in terms of the scholarly outputs they cover. Cloud computing offers flexible ways to perform complex large-scale bibliometric analyses. And bibliometric tools increasingly run on the web, often with a direct connection to the underlying data sources.

                These developments are still in a relatively early stage, but they clearly show what is ahead of us. We are moving toward an increasingly integrated ecosystem of bibliometric data sources, computing platforms, and end-user tools, all operating in a fully online environment.

                The launch last week of VOSviewer Online, a web-based version of our VOSviewer tool for visualizing bibliometric networks, contributes to the above developments. Today we released version 1.6.17 of the regular stand-alone VOSviewer tool, which is another step in the same direction. The new version of VOSviewer makes use of the opportunities offered by VOSviewer Online to provide an easy way to share visualizations online. It also offers support for the Lens, a freely accessible bibliometric data source that is becoming increasingly popular. 

                Sharing VOSviewer visualizations online

                VOSviewer has a new share feature that allows interactive VOSviewer visualizations to be made available online. This feature can be used to upload the network visualized in VOSviewer to a cloud storage service. At the moment three services are supported: Google Drive, Microsoft OneDrive, and Dropbox. The network will be uploaded in a VOSviewer JSON file, a new file type supported by VOSviewer. Using the JSON file available in the cloud, the network will then be opened and visualized in VOSviewer Online, the new web-based version of VOSviewer that we released last week.

                A next step is to use the share feature in VOSviewer Online to obtain a link to the interactive network visualization in VOSviewer Online. This link can be used to share the visualization with others. In addition, as discussed in last week’s blog post, it is also possible to embed the visualization in a web page.

                Support for the Lens

                VOSviewer provides support for constructing bibliometric networks based on data from a broad range of open data sources, including Crossref, Europe PMC, Microsoft Academic, OpenCitations, and PubMed. Some of the other data sources supported by VOSviewer, such as Dimensions, offer free access to (parts of) their data, but they do impose restrictions on how the data can be used.

                VOSviewer version 1.6.17 offers support for constructing bibliometric networks based on data exported from the Lens. Data from the Lens is freely accessible for personal use with very few restrictions. Institutions need a subscription to use the institutional tools provided by the Lens or to use data from the Lens commercially. However, the Lens has an equitable access policy promising that “no one will ever be disadvantaged by lack of access to Lens.org institutional tools”. Importantly, the export feature in the web interface of the Lens is very generous. It enables users to export data for up to 50,000 records, which compares favorably with other data sources.

                Example

                Below we show a visualization of a co-authorship network of researchers at Leiden University and their external collaborators. This visualization illustrates the new features introduced in VOSviewer version 1.6.17. We used the new version of VOSviewer to construct the co-authorship network based on data from the Lens and to make the network available in the cloud by uploading it to Google Drive. VOSviewer Online is used to present an interactive visualization of the network. While this example is based on data from the Lens, any data source supported by VOSviewer can be used to create interactive online visualizations.


                More detailed information is provided in the video below.

                What is next?

                There is an increasing demand for new forms of bibliometrics that provide richer and more contextualized information than traditional one-dimensional bibliometric indicators. New forms of bibliometrics for instance play an important role in the development of more responsible approaches to research assessment. We see the trend toward an integrated ecosystem of bibliometric data sources, computing platforms, and end-user tools as a key enabling factor for these new forms of bibliometrics.

                Last week’s release of VOSviewer Online and today’s update of the regular VOSviewer tool represent two small steps within the broader trend toward integration of data, computing, and tools. One of the next steps that we are working on is the integration of VOSviewer visualizations in the Dimensions platform, as announced at the recent ISSI 2021 conference.

                In the longer term, we envision the emergence of online platforms in which bibliometric data sources, facilities for cloud storage and cloud computing, algorithms for large-scale data analysis, and a broad range of tools for end users will all be connected to each other. We see VOSviewer Online as a building block for such platforms. It seems likely that stand-alone tools such as the regular version of VOSviewer will become obsolete in the longer term.

                The integration of bibliometric data sources, computing platforms, and end-user tools is in an early stage of development. There is still a lot of work to do. We look forward to joining forces with colleagues and partners in the bibliometric community to take next steps on this exciting journey!

                ]]>
                Nees Jan van Eckhttps://orcid.org/0000-0001-8448-4521Ludo Waltman
                Responsible Research Culture: Practicing what we preach at CWTShttps://www.leidenmadtrics.nl/articles/responsible-research-culture-practicing-what-we-preach-at-cwts2021-07-20T14:47:00+02:002024-05-16T23:20:47+02:00CWTS prepares for a new phase in its organization. In our new strategy, we aim to put our values first. A value-based strategy is the cornerstone of a well-functioning, positive research culture. Through open dialogue sessions we started to further shape this culture.At CWTS, we have substantial expertise in research evaluation, including academic careers, institutional evaluation, journal evaluation, university rankings, responsibility and engagement, and open science. We regularly reach out to share our knowledge and foster good practice. But do we also ‘practice what we preach’? Are we doing enough to foster an appreciative working culture, to harbour a safe space, and to promote open dialogues? How about vitality in career perspectives, promoting wellbeing, and rewarding activities that improve the research environment and serve a wider societal context? Which building blocks for a responsible recognition and reward system are missing?

                Our internal working group on Recognition and Reward[1] recently asked organizational expert Freerk Wortelboer to host small-scale dialogue sessions with the entire CWTS staff. In small groups, colleagues shared their views and experiences with recognition and reward mechanisms within academia and at CWTS. Last month, the institute gathered online to discuss the harvest of these sessions and to brainstorm about ways forward.

                In preparing my introduction for that session, I went on a short trip down memory lane. I started to reminisce about when I came to CWTS ten years ago – straight out of a postdoc position in Amsterdam. I quite vividly remember what the institute looked like in terms of the type of research, the type of contract work, and the demographics of its staff. This composition had served the institute and company well, but there was also room for - and a need for - change. With Paul Wouters as director, CWTS developed a broader ambition in diversifying its approach and staff.

                At the time, I was part of a broader influx of new staff tasked with developing new research lines with existing staff. The institute grew and diversified by hosting more people with different cultural, methodological, and disciplinary backgrounds. Collaborations were extended to other areas of research and innovation. More people started to share the responsibility of leading the institute and mentoring early-career colleagues. Several thriving teams now work on sophisticated data curation, the LeidenMadtrics blog, and the Leiden ranking. Colleagues in the company part of CWTS developed a wider range of services – including qualitative approaches - for our consultancy fueled by the new research lines. We now cover a diverse range of topics through a host of different projects and activities and do so with a large group of local, national, and international colleagues.

                Although the efforts listed above show the intention to move towards a well-functioning research culture, some challenges are still here - as reflected by the outcomes of the dialogue sessions.

                Below you see a drawing that Freerk Wortelboer drew up and that summarizes the ‘prouds’ (in green) and ‘sorries’ (in blue) on recognition and reward that were shared in the dialogue sessions.

                Sd R blog


                To be honest, when we started the internal working group, I and the other group members had developed a rather analytical approach to internally assessing our own recognition and reward mechanisms. After our first institute-wide team meeting on this project, colleagues reminded us that the topic is also emotionally charged. We were asked to acknowledge this in our approach, and rightly so! After some consideration, our group opted for a form that reflects what we hope to do more of internally: to provide a psychologically safe space to speak up and share views directly with colleagues (rather than, e.g., only sharing confidentially in a one-to-one setting).

                When I look at the drawing I feel all kinds of things, including satisfaction, recognition, and sorrow. But most of all I am grateful that this feedback is now on the table - from the accolades and praise to the struggles and the pain. Not only is this very important input for the further development of our staff and our organisation, but I also think we can take some pride in being able to do this together. I believe the willingness to engage also supports our initial idea for the new Knowledge Agenda that CWTS will develop in the run-up to 2023. As directors of CWTS, Ed Noyons, Ludo Waltman and I hope that this strategy will not solely be driven by content or by performance. We also want this to be a strategy driven by values. In a values-driven Knowledge Agenda, CWTS does not only commit to certain topics and themes, but also to culture-related policies and practices – as we started to do with e.g., our Open Science policy. In the spirit of these and other initiatives, these research culture-related policies and practices should be community sourced.

                To me, this is what we have started to do at scale in the dialogue sessions. And this is what we should continue to pursue tomorrow, this week, this year, and beyond. Because this dialogue process is not, and should not be, a one-off, but something we should continuously spend time on. The budding experience with the dialogue sessions suggests that there is a basis to further strengthen an appreciative research culture: by meeting and discussing ideas, but increasingly also by fostering a safe space to share struggles, make mistakes, talk about things that need to change, and be transparent about things that cannot be changed too. This means that we should consider

                • creating a shared vision on the key elements of a value-based strategy (including open science, appreciative culture); recognizing all capabilities and contributions
                • developing a community-sourced strategy that we feel proud of; acknowledging and rewarding diversity and equality
                • exchanging ideas, listening, and understanding what the obstacles for change are; working together and building a community in which everyone is heard
                • monitoring and regularly evaluating how we are doing; scrutinizing the strategy as well as how people are doing

                An important target is that in time, most - if not all - of our staff members feel supported in their development, both within the Centre and beyond. Not only as employees, but as human beings.


                I would like to thank Carole de Bordes, Nees Jan van Eck, Tjitske Holtrop, Ingeborg Meijer, Mark Neijssel, Ed Noijons, Vincent Traag, and Ludo Waltman for valuable feedback on an earlier version of this blogpost.


                [1] Members: Carole de Bordes, Tjitske Holtrop, Hungwah Lam, Ingeborg Meijer, Sarah de Rijcke, Vincent Traag

                ]]>
                Sarah de Rijcke
                VOSviewer goes online! (Part 1)https://www.leidenmadtrics.nl/articles/vosviewer-goes-online-part-12021-07-16T12:20:00+02:002024-05-16T23:20:47+02:00Today, the new VOSviewer Online software was released by CWTS colleagues Nees Jan van Eck and Ludo Waltman. In this post, they discuss the possibilities offered by the software.The value of bibliometric visualizations

                Bibliometric visualizations are often presented as powerful tools for identifying the key patterns in large bibliometric data sets. However, not everyone is convinced of their value. Some skeptics suggest that these visualizations are “just nice to look at but not useful or helpful”.

                Based on almost 15 years of experience in working with bibliometric visualizations, we have seen many examples of the successful use of these visualizations, but we have seen equally many examples of poor ways of using bibliometric visualizations, often leading to questionable conclusions.

                In our experience, a carefully designed bibliometric visualization may offer a wealth of valuable information. However, to access this information, being able to interactively explore the visualization is quite essential. A static visualization without any possibility for interaction has much less value, and may be more likely to be misinterpreted.

                From static to interactive visualizations

                Our VOSviewer software enables visualizations of bibliometric networks to be explored interactively. Nevertheless, VOSviewer visualizations often end up as static images in blog posts, research articles, policy reports, and PowerPoint presentations. In this way the visualizations lose a lot of their value, and in the end they may indeed be “just nice to look at but not useful or helpful”.

                To address this problem, we have developed VOSviewer Online, a web-based version of VOSviewer released today. Using VOSviewer Online, visualizations of bibliometric networks can be explored interactively in a web browser. This makes it much easier to share interactive visualizations, and it reduces the need to show static images.

                VOSviewer Online can also be used to embed interactive visualizations in a web page. As an example, below we use VOSviewer Online to present an interactive visualization of a co-authorship network of authors of articles published in Quantitative Science Studies and Scientometrics in 2020 and 2021. The network was constructed based on Dimensions data.

                VOSviewer and VOSviewer Online

                VOSviewer Online can be opened at https://app.vosviewer.com. The tool aims to replicate as much as possible the user experience of the regular stand-alone VOSviewer software. Visualizations are presented in the same way in the two versions of VOSviewer. The user interface is also similar, although we have made some simplifications in VOSviewer Online, hopefully making the software even more intuitive to use.

                Importantly, unlike the stand-alone VOSviewer software, VOSviewer Online currently does not provide any built-in functionality for constructing bibliometric networks based on data from bibliographic data sources such as Web of Science, Scopus, Dimensions, Crossref, and others. The stand-alone software still needs to be used for this. VOSviewer Online can instead be used to make interactive visualizations of bibliometric networks available online and to easily share these visualizations.

                In part 2 of this blog post, to be published soon, we will discuss in more detail how the two versions of VOSviewer can be used together.

                Embedding interactive visualizations in online platforms

                An exciting feature of VOSviewer Online is the possibility to embed interactive visualizations in online platforms. The above visualization of a co-authorship network offers an example of this feature. The embedding functionality of VOSviewer Online has already been tested in other blog posts, like this one, and it has been used in news articles in Nature Index, for instance this one.

                In addition, in the OPERA project in Denmark, interactive VOSviewer visualizations have been embedded in the VIVO system. As announced last Monday at the ISSI 2021 conference, we are also working together with Digital Science to embed VOSviewer visualizations in their Dimensions platform. Likewise, VOSviewer visualizations are also going to be embedded in the AI Research Navigator platform created by Zeta Alpha.

                VOSviewer Online can be freely integrated in other platforms as well. Although you don’t need our help for this, we are happy to discuss the possibilities.

                VOSviewer Dimensions screenshot

                Try it yourself

                Go to https://app.vosviewer.com to try out VOSviewer Online. Below we present a short video in which one of us (NJvE) explains how to get started. More detailed information about VOSviewer Online is available in VOSviewer Online Docs.

                VOSviewer Online is open source. It has been developed in JavaScript. We welcome contributions to the further development of the software. Don’t hesitate to get in touch!

                ]]>
                Nees Jan van Eckhttps://orcid.org/0000-0001-8448-4521Ludo Waltman
                Tracing science-technology-linkages through patent in-text referenceshttps://www.leidenmadtrics.nl/articles/tracing-science-technology-linkages-through-patent-in-text-references2021-06-24T10:30:00+02:002024-05-16T23:20:47+02:00The contribution of science to technological innovation is subject of ongoing debate. In a recent study, our authors investigated how the value of patents depends on the scientific articles referenced and what role aspects such as basicness, novelty, and interdisciplinarity play in this.The relationship between science and technology

                There is a recurrent debate about how useful science is for technological innovation. However, science is heterogenous, and some types of scientific outputs may contribute disproportionately to technology. We lack empirical evidence to assess whether more applied and interdisciplinary research is more directly useful for technology, characteristics which are also believed to be key features of research that is useful for society. We also do not know whether science’s autonomous pursuit of novelty and peer recognition might be at odds with the policy goal of making science more useful for the economy and society. Therefore, we studied how basicness, interdisciplinarity, novelty, and scientific citations are associated with patent value.

                How to trace science-technology-linkages?

                To answer our research question, we first need to trace science-technology-linkages. References in patents to science provide a paper trail of knowledge flow, and scholars have long exploited these references for science and technology studies. However, the state-of-the-art practice uses almost exclusively patent front-page references but ignores patent in-text references. Patent front-page references are listed on the front page of the patent document, reporting prior documents that are relevant for assessing the patentability of the invention. Patent in-text references are embedded in the full text of the patent, very similar to references in academic papers (see Figure 1). Recent studies have suggested that patent in-text reference is a better indication of knowledge flow than front-page references.

                Jian wang figure1
                Figure 1. Patent front-page (left) and in-text references (right).

                However, extracting patent in-text references is a formidable task, as they are embedded in the running text without structural cues. We approach this problem as a sequence labeling task. We train BERT-based models to automatically classify each word as (B) beginning of a reference, (I) inside a reference, or (O) outside a reference. These labels then enable us to extract reference strings from the patent text. Subsequently, we match the extracted references to individual Web of Science (WoS) journal articles using regular expressions and pattern matching. We apply this method to 33,337 USPTO biotech utility patents granted between 2006 and 2010 and extracted their 860,879 in-text and 637,570 front-page references to WoS articles.

                Jian wang Figure2
                Figure 2. Overlap between in-text and front-page references.

                One first observation is the remarkably low overlap between patent front-page and in-text references. In total, 173,281 references appear both in the text and on the front page of the same patent, which accounts for only 20% of all in-text references and 27% of all front-page references (Figure 2). This low overlap suggests that in-text and front-page references embody different types of information. Accordingly, using different types of references to study science-technology-linkages may lead to very different conclusions.

                How does patents’ value depend on the characteristics of their referenced scientific articles?

                We answer this question using the dataset of 33,337 USPTO biotech utility patents and their 860,879 in-text references to WoS articles. We measure patent value by the number of times that a patent is cited by future patents. Combining Negative Binomial regressions and non-parametric visualizations, we first observe that patents citing more scientific articles also receive more patent citations than patents citing fewer or no scientific articles in the same issuing year and technology class (Figure 3A). Using a basicness measure based on PubMed MeSH terms (basicness = 3 if a paper has only cell- or animal-related MeSH terms, 2 if both cell-/animal-related and human-related MeSH terms, and 1 if only human-related MeSH terms), we also find an inverted U-shaped effect of basicness on patent citations, when comparing patents with the same number of science references and in the same issuing year and technology class (Figure 3B). In addition, we identify novel publications as the ones that make unprecedented journal combinations in its references. We found that novelty displays a discontinuous and nonlinear effect, suggesting a structural change between patents building on novel science and those which do not (Figure 3C). We do not find clear effects of interdisciplinarity or scientific citations.

                Jian wang figure3 2
                Figure 3. What kinds of science lead to more valuable patents? This figure plots the estimated value of patent citations for an average patent at different levels of science measures. For Plot A, we first sort patents by their number of science references and then classify them into 10 ordered and evenly sized levels. Then we run Negative Binomial regression using patent citations as the dependent variable, 10 levels of No. science references as the independent variables, and patent issuing year and technology class as control variables. Then we plot the estimated patent citations for an average patent (i.e., issuing year is 2010, IPC is C12N) for each level. For Plot B we sort patents by their average basicness instead, and repeat the process, additionally controlling for the ln number of science references, which is also set to the mean value for specifying the average patent. Plot C follows the same procedure as Plot B but focuses on average novelty.

                What are the implications?

                Regarding science policy, our result partly supports recent advocating for application-oriented research. On the other hand, it warns that completely dismissing basic research is detrimental as the association between basicness and patent value is not a simple negative relation. Our results do not provide evidence that interdisciplinary research is the key for making science more useful for technological innovation. With respect to novelty, our results do not provide a clear message as to whether science policy should support novel or non-novel research, as the association between novelty and patent value is rather complex. Our results do suggest that novelty plays a special role for technological innovation and warns about potential disruptions and uncertainties that sourcing novel science can bring about. In terms of scientific citations, we do not observe a positive, but neither a negative association between them and patent citations. This means that although the quality standard or taste might be different between science and technology, they are not at war with each other.

                For studies using patent references, the low overlap between patent front-page and in-text references, and more importantly the fact that they produce different analytical results, warns about a potential threat to validity due to data source. This means that we need to better understand how references are being generated in patents before we can determine which type of references to use in different research contexts.

                Our full study, available as a preprint, goes into more detail and provides further analyses on the topics covered. If you are interested in this, please feel free to find out more.

                ]]>
                Jian WangSuzan Verberne
                Vaccine development in contexthttps://www.leidenmadtrics.nl/articles/vaccine-development-in-context2021-06-01T10:45:00+02:002024-05-16T23:20:47+02:00CWTS' Leonie van Drooge has received the Moderna vaccine. She is not an army enthusiast, yet she is grateful to the US Dept. of Defense. Its agency DARPA funded Moderna in 2013 to further develop the then-novel mRNA technology. This blog looks into how DARPA does or doesn't solve challenges.DARPA is one of many examples of how the entrepreneurial state makes high-risk investments and creates markets. DARPA is often referred to when it comes to funding for missions. It is unique and differs in many ways from traditional research agencies. This blog post illuminates some of its particularities; some inspiring, others just interesting, and again others not so pretty.

                The Open Access bookThe DARPA Model for Transformative Technologies: Perspectives on the U.S. Defense Advanced Research Projects Agency as well as the website of DARPA are used for this blog. Before I joined CWTS I worked at Rathenau Instituut. One of the final projects I worked on was dedicated to mission-oriented innovation policies and I did a case study on DARPA. I expect the final report to be published soon.

                With a “D” for Defense

                The Defense Advanced Research Projects Agency (DARPA) makes, according to its website, pivotal investments in breakthrough technologies for national security.

                The mission to ensure national security as well as the relationship with the US army are crucial characteristics. This relationship goes back to the origin of DARPA, the Sputnik shock. In 1957 the Soviet Union is the first to successfully launch a rocket and satellite, named Sputnik, into space. This comes to many as a surprise, not least in the US. In 1958 the US establishes what we now know as DARPA. Its mission is national security, by ensuring the US is the initiator of strategic technological surprises; not the victim.

                Replica of the Sputnik 1 satellite

                The US army is the client of DARPA. Its programs are based on challenges the army faces and developments the army foresees. DARPA program managers and (office) directors meet with, reach out to and collaborate with army representatives all the time. DARPA will not develop quick fixes nor incremental adaptations; it aims beyond the horizon. Think precision weapons, stealth technology, automated voice recognition, global positioning system (GPS), the Internet.

                And mRNA vaccination.

                Since a decade or so the human body has been identified as one of the most vulnerable aspects of the US army. The army encounters bioterrorism, sees increasingly serious (brain) injury, operates with smaller units without medics, operates under extreme conditions. And troops encounter infectious diseases.

                The client of DARPA

                The army is the intended user or buyer of the final product or technology. The importance of this close relationship between agency and user becomes apparent in the case of the Advanced Research Projects Agency-Energy (ARPA-E). ARPA-E is very much based on DARPA, but there are differences. ARPA-E advances high-potential, high-impact energy technologies. It aims for no less than economic prosperity, national security and environmental wellbeing. However, the Department of Energy is not the main client for the technologies ARPA-E develops. It is certain industries, such as aviation in case of innovative electric motors, or homeowners in case of transformative generators. And in many cases energy companies play a key role, either as manufacturer or user.

                Industry

                This difference between DARPA and ARPA-E sheds light on another key aspect: the industrial landscape, and the willingness and ability of companies to further develop novel technologies. This is not always the case, certainly not in the long-established and traditional energy sector. Existing companies tend to protect their interests. Plus they are not keen to embrace novel technologies.

                This is initially the case with mRNA technology as well. In 2012 big and traditional pharmaceutical companies, such as Novartis, Pfizer, AstraZeneca and Sanofi Pasteur, receive funding from DARPA to develop mRNA technology. The results are good, yet the companies lose interest. The novelty of the mRNA technology implies uncertain regulatory pathways. A risk they are unwilling to take.

                Enter Moderna, a young start-up founded with venture capital. In 2013 Moderna receives up to 25 Million USD from DARPA.

                DARPA often collaborates with young and innovative companies, especially in the fields of information-, communication- and biotechnology and often founded with venture capital. A very different industry landscape from the energy sector.

                Begin at the end

                If we look closer at DARPA and ARPA-E, it becomes even clearer that they are not your regular research funding agency. One aspect is very prominent, i.e. beginning with the end. It is about the result, a specific solution, that contributes to the mission. The agencies don’t fund research for research’s sake. They invest in technologies that they believe will contribute to national security / economic prosperity / environmental wellbeing. And so the starting point is the potential of a novel technology. DARPA is very much about exploring, challenging and pushing novel technologies; it is not about basic science.

                The intervention logic is not the common fund-research-and-breakthroughs-might-happen. It is more like: in order to get to a certain solution and to ensure national security, technological boundaries need to be pushed above and beyond the unimaginable, and by all means necessary. It’s the DARPA program manager that leads the way. Or in case of ARPA-E the program director. Because at ARPA-E they don’t just manage programs, they are in the lead and thus direct.

                Vision and religion

                The “vision” of the DARPA program manager and the “religion” of the ARPA-E program director serve as a beacon. It is a combination of ideas, knowledge, expertise, networks and insight into the potential of a novel technology. And how combining all that can result into a completely novel solution. The program manager has far more responsibilities and possibilities than any officer at a regular research council.

                A program manager is expected to develop programs and do so by engaging with DARPA (office) directors, the army, researchers at universities and government labs and private companies. It can take up to a year to develop a program, during which the program manager gains even more insight, establishes contacts and networks, engages with potential performers, and develops metrics. It is the responsibility of the program manager to select projects, and this might be with, or without, the help of others. The program manager decides on the program portfolio: one big project; a collection of projects; projects that are very much alike and that compete with each other, or rather projects that are complementary. And the program manager actively engages with the projects, pays visits, calls for meetings, arranges encounters and establishes networks. The program manager is not a bureaucrat to which one has to report on a yearly basis, on the contrary.

                Contracts, performers and challenges

                DARPA doesn’t provide grants; DARPA works with contracts. And DARPA calls its contractors performers. And perform, they should. DARPA can require changes at any time. And it can cancel contracts on short notice and for whatever reason.

                More recently, DARPA has introduced the format of a challenge. Here the conditions are even more uncertain. DARPA calls for teams to embark on a challenge, usually lasting weeks or even months. Only some of the finalists get a prize. Challenges have included a cyber grand challenge with a final online capture-the-flag competition live and on stage during DEF CON in Las Vegas.

                And the chikungunya virus (CHIKV) Challenge.

                In 2015 DARPA organises a challenge to develop accurate forecasts of where and when the chikungunya virus occurs. Almost forty teams participate in this half-year challenge. They develop and adapt their models and predictions, using real time data of actual infections. It is very exciting, according to the program manager, that teams build their models at the speed of an epidemic. And even more exciting that the challenge will lead to tools that work faster than the speed of an epidemic.

                Eleven winners shared 500,000 dollar of prize money, leaving the majority of teams empty handed.

                Accounting for money

                Talking about money, the annual budget of DARPA is 3.5 billion USD, almost 3 billion Euro. To compare, the total government spending for research and development in the Netherlands is 5 billion Euro annually, less than double the DARPA budget. The seven year European framework program Horizon 2020 allocated nearly 60 billion Euro over 7 years. It was initially estimated to cost some 80 billion Euro total. Anyway, some 10 billion Euro per year. The budget of DARPA is substantial. It is very high risk, very high gain. Or high loss.

                DARPA reports directly to US congress. In his March 2019 statement, claiming the 2020 budget, the then director of DARPA presents a number of highlights. The very first he mentions?

                Stopping pandemics in 60 days or less.

                To DARPA, or not to DARPA

                So you might think that I am an DARPA-advocate. No, I am not, on the contrary.

                Let’s have a look at the current global pandemic outbreak. We have seen presidents and other authorities deny the seriousness of the Covid-19 pandemic. The World Health Organisation concludes that vaccines are very unevenly distributed across the globe, leading to a health risk for all, and calls it vaccine apartheid. Then there is vaccine hesitancy. To name but few of the many problems and challenges. What they have in common is that they do not require (just) a technological solution, on the contrary. It is about trust, social justice, equity. About taking into account societal, moral, legal and ethical aspects. Overcoming vaccine hesitancy requires collaboration between public health officials and local, especially marginalized, communities. And honest communication about scientific limitations and uncertainties. It calls for the inclusion of citizens in vaccine advisory committees. And specific attention to social media and news outlets, so as to reduce misinformation and disinformation.

                Talking about the Internet, another technology brought to you by DARPA.

                What should be an inspiration is the very, let’s say, engaging nature of DARPA and its program managers. Often research councils, medical charities, the European Commission and the like are at a distance from those they fund. Even in case of a thematic program that aims to contribute to a societal issue. Also, there is little contact between the projects in such a program. And so after four years the result is a number of PhD theses and articles, but not the contribution that required collaboration across projects and with next users, stakeholders, government agencies, private companies and the like. The hoped for and promised improvement, the novel guidelines, the new design approach. The way DARPA anticipates, summons, directs and connects is incomparable and is one way to effectively enter and conquer unchartered territories.

                However, the scope of DARPA is limited and restricted to technology and national security only. It intervenes in our lives with unthought of devices and technologies, while neglecting almost everything that makes us, and our society, social, just, human.

                Moreover, we know that technological solutions alone do not suffice to tackle societal challenges, such as the current pandemic. Other options than research might be the answer and we need to take far more aspects into account.

                Dutch government registration card for corona vaccination

                Yes, I am grateful for my vaccination. Also I am very happy to learn that Moderna is effective against new variants, but that is the same technological solution, again. More even access to vaccines, tests and treatments worldwide would reduce the development of new variants. That would be my preferred treatment.

                Photo by Henry Be on Unsplash

                ]]>
                Leonie van Drooge
                Halt the h-indexhttps://www.leidenmadtrics.nl/articles/halt-the-h-index2021-05-19T10:30:00+02:002024-05-16T23:20:47+02:00Using the h-index in research evaluation? Rather not. But why not, actually? Why is using this indicator so problematic? And what are the alternatives anyway? Our authors walk you through an infographic that addresses these questions and aims to highlight some key issues in this discussion.Sometimes, bringing home a message requires a more visual approach. That’s why recently, we teamed up with a graphic designer to create an infographic on the h-index – or rather, on the reasons why not to use the h-index.
                In our experience with stakeholders in research evaluation, debates about the usefulness of the h-index keep popping up. This happens even in contexts that are more welcoming towards responsible research assessment. Of course, the h-index is well-known, as are its downsides. Still, the various issues around it do not yet seem to be common knowledge. At the same time, current developments in research evaluation propose more holistic approaches. Examples include the evaluative inquiry developed at our own centre as well as approaches to evaluate academic institutions in context. Scrutinizing the creation of indicators itself, better contextualization has been called for, demanding to derive them out “in the wild” and not in isolation.
                Moving towards more comprehensive research assessment approaches that consider research in all its variants is supported by the larger community of research evaluators as well, making a compelling case to move away from single-indicator thinking.
                Still, there is opposition to reconsidering the use of metrics. When first introducing the infographic on Twitter, this evoked responses questioning misuse of the h-index in practice, disparaging more qualitative assessments, or simply shrugging off responsibility for taking action due to a perceived lack of alternatives. This shows there is indeed a need for taking another look at the h-index.

                The h-index and researcher careers

                To begin with, the h-index only increases as time passes. This time-dependence means that the h-index favors more senior researchers over their younger colleagues. This becomes clearly apparent in the following (fictitious) case, which compares a researcher at a more advanced career stage to an early-career researcher. As can be seen in Figure 1, the researcher at the more advanced career stage has already published a substantial number of publications.

                Figure 1. Publications of a researcher at a more advanced career stage. Publications can be seen on the x-axis and are represented on the right as well.

                Over time, the publications depicted attract more and more citations (see the y-axis in Figure 2).

                Figure 2. Citations for publications of a researcher at a more advanced career stage. On the right: colored representations of citations received as they occur in other publications.

                When ordering a researcher’s list of publications by the (decreasing) number of citations received by each of them, you will get a distribution as in Figure 3. The value of the h-index equals the number of publications (N) that have received N or more citations. In our example, this results in an h-index of five.

                Figure 3. Calculating the h-index for a researcher at a more advanced career stage

                The situation is less favorable for the early-career researcher. This is because the h-index does not account for academic age: researchers who have been around for a shorter amount of time fare worse with this metric. Hence, while the h-index provides an indication of a researcher’s career stage, it does not enable fair comparisons of researchers that are at different career stages.

                Figure 4. Calculating the h-index for an early-career researcher.

                The h-Index and field differences

                Another problem of the h-index is that it does not account for differences in publication and citation practices between and even within fields. A closer look at another hypothetical case may exemplify this issue. We are taking a look at two different fields of science: One with a low (Figure 5) and another one with a high publication and citation density (Figure 6). The researcher in the field with a low publication and citation density has an h-index of two, while the h-index equals five for the researcher in the field with a high publication and citation density. The difference in the h-indices of the two researchers does not reflect a difference in scientific performance. Instead, it simply results from differences in publication and citation practices between the fields in which the two researchers are active.

                Figure 5. Calculating the h-index for a researcher active in a field with a low publication and citation density.

                Figure 6. Calculating the h-index for a researcher active in a field with a high publication and citation density.

                Three problems of the h-index

                The application of the h-index in research evaluation requires a critical assessment as well. Three problematic cases can be identified in particular (Figure 7). The first one, in which the h-index facilitates unfair comparisons of researchers, has already been discussed.

                Figure 7. Three problems of the h-index

                The h-index favors researchers who have been active for a longer period of time. It also favors researchers from fields with a higher publication and citation density (Figure 8).

                Figure 8. Problem 1: Unfair comparisons.

                Another problem of the h-index is that merely publishing a lot becomes a ‘virtue’ in its own right. This means that researchers benefit from placing their name on as many publications as possible. This may lead to undesirable authorship behavior (Figure 9). Likewise, the strong emphasis of the h-index on citations may cause questionable citation practices.

                Figure 9. Problem 2: Bad publishing and referencing behavior.

                There is yet another issue. By placing so much emphasis on publication output, the h-index narrows research evaluation down to just one type of academic activity. This runs counter to efforts towards a more responsible evaluation system that accounts for other types of academic activity as well: Leadership, vision, collaboration, teaching, clinical skills, or contributions to a research group or an institution (Figure 10).

                Figure 10. Problem 3: Invisibility of other academic activities.

                Relying on just a single indicator is shortsighted and is likely to have considerable narrowing effects. Topical diversity may suffer since, as shown above, some fields of science are favored over others. Moreover, a healthy research system requires diverse types of talents and leaders, which means that researchers need to be evaluated in a way that does justice to the broad diversity in academic activities, rather than only on the basis of measures of publication output and citation impact.

                Halt the h-index and apply alternative approaches for evaluating researchers

                How then do we “halt the h-index”? We would like to emphasize a threefold approach when it comes to evaluating academics (Figure 11). The starting point is a qualitative assessment by one’s peers and colleagues. Adding to that, indicators applied in the assessment should be both transparent and flexible. Transparency means that the calculation of an indicator is clearly documented and that the data underlying an indicator are disclosed and made accessible. Thus, “black box” indicators are not acceptable. Regarding flexibility, the assessment should not apply a ‘one-size-fits-all’ approach. Instead, it should adapt to the type of work done by a researcher and the specific context of the organization or the scientific field in which the researcher is active. Lastly, we believe that written justifications, e.g. narratives or personal statements, should become an important component in evaluations, including in the context of promotions or applications for grants. Such statements could for instance highlight the main accomplishments of researchers and their future plans.

                Figure 11. Evaluating academics in a responsible way.

                In conclusion, evaluation of individual researchers should be seen as a qualitative process carried out by peers and colleagues. This process can be supported by quantitative indicators and qualitative forms of information, which together cover the various activities and roles of researchers. The use of a single unrepresentative, and in many cases even unfair, indicator based on publication and citation counts is not acceptable.

                This conclusion very much aligns with calls for broader approaches towards recognition and rewards in academia, and was also specified in the Leiden Manifesto:

                “Reading and judging a researcher's work is much more appropriate than relying on one number. Even when comparing large numbers of researchers, an approach that considers more information about an individual's expertise, experience, activities and influence is best.” (Principle 7 in the Leiden Manifesto)

                What remains to be done? Take a look at the infographic and feel free to share and use it! All the visuals used in this blog post combined in one infographic, ready for download and shared under a CC-BY license, can be found on Zenodo.

                Acknowledgements

                We would like to thank Robert van Sluis, the designer who produced the images shown in this blog post and the final infographic.

                Many thanks also to Jonathan Dudek and Zohreh Zahedi for all their help in preparing this blog post.

                Photo by Nick Wright on Unsplash

                ]]>
                Sarah de RijckeLudo WaltmanThed van Leeuwen
                Research evaluation in context 4: the practice of research evaluationhttps://www.leidenmadtrics.nl/articles/research-evaluation-in-context-4-the-practice-of-research-evaluation2021-05-12T10:45:00+02:002024-05-16T23:20:47+02:00The Strategy Evaluation Protocol describes a forward-looking evaluation for which research organisations are responsible. Context, aims and strategy of units are key. Very timely and relevant, yet it is easier said than done.Previous posts on the Strategy Evaluation Protocol 2021-2027 describe the criteria and aspects and the process and responsibilities. Asking to judge research units on their own merits and putting the responsibility for the evaluation with the research organisations proves quite a challenge. Evaluation might not always happen according to protocol, yet the process itself offers opportunities to reflect and define. And as such it has value.

                This blogpost is based on my long-term involvement with the SEP as a member of the working group SEP; on information shared during formal committee meetings; inputs from participants at workshops and briefing sessions; discussions with representatives of units preparing an evaluation; unpublished as well as published reviews of the SEP; as well as self-evaluation and assessment reports available online. Plus, it is informed by the evaluation of my own research units (past and current). Also, the new SEP 2021-2027 has become effective this year, so there is not much practice yet. However, most of what is addressed in this post has been part of previous protocols.

                Aims and strategy

                Evaluation takes place in light of the aims and strategy of the unit. This is nothing new, it has been part of the protocol for almost 20 years now. The current protocol puts even more emphasis on it, with its changed name (from Standard to Strategy) and a separate appendix that explains “aims” and “strategy”.

                The issue is the assumption that units have a clear strategy. This is often not the case. Even when it has one, it is not always shared and known, nor does it guide decisions and choices. Some units, such as my own, organise internal meetings to prepare for the evaluation. We jointly develop an understanding of the past and uncover, or maybe recover, our strategy. Other units reportedly use the moment not so much to look back, but to develop a joint vision for the future.

                Having said that, in the past units described broad, common and vague goals, such as excellent, interdisciplinary, or international, or more recently “improve internationalisation, innovation and rigour in research” and “strengthen societal relevance, integrity, and diversity.”

                Indicator? What indicator?!

                The 2015 and 2021 protocols only describe categories of evidence and mention exemplary indicators for each category. A unit should present and explain its own selection of indicators, that fit the unit’s context and strategy.

                Some perceive the indicators as a given and mention they are unaware that those are just samples. This, although it is mentioned explicitly and repeatedly, for instance, six times in the table with categories of evidence in the 2015 protocol (Figure 1). On the other hand, this misperception might not come as a surprise, given the strict requirements of so many other evaluations.

                SEP 4 Figure1
                Figure 1. Table D1 output indicators from the previous SEP 2015-2021.

                Also, it is a huge challenge to define proper indicators for research quality and societal impact. At CWTS, we are quite aware of this. But most researchers are not experts in meaningful metrics; their expertise is Caribbean archeology, political economy or chemical biology. And yet they are asked to develop their own indicators. The nationwide initiative Quality and Relevance in the Humanities (QRIH) has taken action and developed sample indicators for SEP evaluations. It has identified indicators for all categories. Some are authorized by a panel; others have been used in a self-evaluation report.

                Novel aspects

                Over the years novel aspects that reflect developments and debates have become part of the protocol. They include research integrity, diversity and Open Science.

                The necessity to address these issues is not always clear to the unit, nor to the committee. To illustrate this, one committee remarked that integrity is less a problem in the humanities than in the natural sciences, and even less so in their discipline, since research “seems inseparable from the individuality of whoever is doing it.” However, the 2015 protocol that was in use back then, specifically mentions “self-reflection on actions (including in the supervision of PhD candidates)” and “any dilemmas […] that have arisen and how the unit has dealt with them.” I don’t understand how that doesn’t apply.

                Other times the protocol asks for more than a unit is allowed to provide. It is unlawful to register an employee’s ethnic or cultural background in the Netherlands, yet the protocol includes these dimensions in its definition of diversity. And while many are aware of the lack of ethnical and cultural diversity, there is discomfort addressing this, if only because of legal issues.

                The relevance of societal relevance

                Societal relevance, a subject that I have studied for some time now, proves challenging for units and committees. Sometimes the assessment focuses on structures and collaborations, i.e., on strategy; sometimes on products and results without any explanation for this emphasis; sometimes on societal issues that could benefit from the research, and sometimes on the inherent and potential relevance: “[the] research themes/specializations […] are explicitly relevant to society and the co-creation of public value.”

                Nowadays the necessity of a separate criterion for societal relevance isn’t questioned anymore, yet the seemingly relative importance is. Which is odd, given that the three criteria (the other two are research quality and viability) are not weighed against each other. Societal relevance might be a substantive element of the mission of some units and it might be hardly of importance for others.

                The quality of research quality

                The protocols describe research quality only briefly. This leaves room for interpretation. Browsing through assessment reports, it is striking to see the many references to publications and publication strategies as a proxy for research quality and strategy. One committee observes a trend across an entire discipline “towards valuing quality over quantity” and that “researchers are no longer encouraged to publish as many articles as possible”. Yet the shift still relates to publications, since researchers “are stimulated to submit primarily top-quality papers in high impact journals.” Followed by a discussion of citation rates and interdisciplinary research.

                National evaluation in context

                There is a tension between a joint evaluation across a discipline and the intention to evaluate in context. The initial VSNU protocols of the 1990s1 prescribed a joint evaluation. One goal, abandoned since 2003, was to ascertain the scientific potential of a discipline. Yet the practice of joint evaluations still exists. It is partly rooted in the law that requires assessment “in collaboration as far as possible with other institutions.”

                A joint evaluation requires representatives of a discipline, involving anywhere between 2-9 universities, to jointly take action, discuss and decide. Although unintended, this results in an extra practice of negotiating quality and relevance. It also requires one assessment committee only. One reason to abandon the mandatory joint evaluation was that it is hardly possible for one committee to do justice to each and every unit. And with the increased focus on the context of the unit, its mission, goals and strategy, this is even more so the case.

                Between intention and practice

                For this blogpost, I have browsed through reports and used my own involvement with the SEP. The result is a very sketchy picture of examples and instances that indicate a difference between intention and practice. It certainly is not a thorough analysis. And yes, there are evaluations where issues are addressed according to the protocol, with ample attention for argumentation and strategy. Also, I don’t want to condemn any practice, on the contrary. Rather I want to nuance the enthusiasm of some.

                And we shouldn’t neglect what happens during an evaluation. It has repeatedly been reported that units use an evaluation to re-define and re-adjust their mission, goals and strategy. And even when an evaluation isn’t fully done according to protocol, those involved go through the motions, encounter obstacles, end up in discussions and ultimately negotiate and establish notions of quality and relevance. The execution and result of that process might not always be excellent, but we shouldn’t neglect the benefit of those efforts.

                A new protocol will not change a community overnight. However, it urges boards, units and committees to address novel aspects and practices. More on that in the next blogpost.

                1 VSNU (1993). Quality Assessment of Research – protocol 1993. Utrecht: VSNU.                  VSNU (1994). Quality Assessment of Research – protocol 1994. Utrecht: VSNU.                      VSNU (1998). “Protocol 1998”. In: Series Assessment of Research Quality. Utrecht: VSNU.


                Header image by Ricardo Viana on Unsplash

                ]]>
                Leonie van Drooge
                On my way to studying collaboration in PhD training networkshttps://www.leidenmadtrics.nl/articles/on-my-way-to-studying-collaboration-in-phd-networks2021-05-04T09:00:00+02:002024-05-16T23:20:47+02:00Scientific collaboration is an important part of conducting research. In this blog post, I would like to introduce my PhD topic as part of the Train2Wind ITN (Innovative Training Network) at the University of Copenhagen.Personal motivation and information on Train2Wind

                Completing a PhD as member of the Train2Wind ITN (Innovative Training Network) combines several of my interests, as it allows me to study scientific collaboration in an applied research setting as part of an international research consortium that trains PhD graduates funded by a Marie Skłodowska-Curie Action. I graduated with an Erasmus Mundus Joint Master Degree from the Master in Research and Innovation in Higher Education (MARIHE), which is coordinated by an international consortium. Although the focus is more on research, I believe that there are some similarities between ITNs and Erasmus Mundus; for example, there is mobility within various organisations in several countries, with various researchers and lecturers serving as part of one student cohort. An overview of Train2Wind is available on this conference poster by the consortium members.

                Train2Wind includes six higher education institutions and four industry partners in Denmark, Germany, Norway, Sweden, Switzerland, and the US. The consortium is coordinated by the Technical University of Denmark (DTU) and includes the University of Bergen, University of Copenhagen (UCPH), the Swiss Federal Institute of Technology Lausanne, and the University of Tübingen. The partner organisations are Johns Hopkins University and wind industry partners Equinor, Innogy, SeaTwirl AB, and Vattenfall AB. The work packages at UCPH’s Department of Communication are coordinated by the IBID research group (Information Behavior and Interaction Design) by Morten Hertzum and Haakon Lund. My supervisors are Haakon Lund and Frans van der Sluis.

                Context and purpose of my PhD

                Scientific collaboration is an important part of conducting research, especially for research consortia, because the consortium members depend on each other to achieve the project’s goals. My PhD work centers on expectations and experiences regarding scientific collaboration in PhD training networks in the research area of wind energy. I will study the collaboration readiness of these members — that is, what experiences and expectations they have when collaborating.

                "Puzzle of complexity" by PictureWendy is licensed under CC BY-NC 2.0

                The study sample is made up of these network members, namely early-stage researchers, senior researchers, and business representatives. By being a member of one of these networks, Train2Wind, I have the advantage of data access, but this also provides some challenges. My goal is to find out how the network members value scientific collaboration, which is based on their experiences prior to joining the network and their expectations towards the network’s activities.

                Current status and outlook

                Currently, I am preparing for data collection, which has luckily not yet been affected by the pandemic. I aim to collect data through qualitative interviews, quantitative surveys, participatory observations, usability tests of a collaboration website, bibliometric databases, and online social networks. The first step will be to carry out qualitative interviews with ITN project members. This will be followed by the launch of an online survey in the coming months, which will have separate questionnaires taking into account different levels of experience by the survey respondents.

                I will present an overview of my PhD project at the Wind Energy Science Conference (WES) 2021, organized virtually at Leibniz University Hannover between 25–28 May 2021. I am looking forward to this PhD research journey and to being part of an international consortium.

                ]]>
                Grischa Fraumann
                Doing science in times of crisis: Science studies perspectives on COVID-19 (1st & 2nd edition)https://www.leidenmadtrics.nl/articles/doing-science-in-times-of-crisis-science-studies-perspectives-on-covid-19-1st-2nd-edition2021-03-30T10:40:00+02:002024-05-16T23:20:47+02:00The webinar series "Doing science in times of crisis: Science studies perspectives on COVID-19" started on 20 May 2020 during the early stages of the pandemic. The goal of this event is to connect and showcase COVID-19 science studies research from institutions around the world.This article is an updated version of the webinar report in the ISSI Newsletter (#63, volume 16, number 3).

                Introduction

                In this post, we summarize the webinar series “Doing science in times of crisis: Science studies perspectives on COVID-19” and introduce the speakers and presentations. The webinar is embedded into a broaderresearch line on COVID-19 atCWTS. More information on the relation between the research line and the webinar series is available in an interview by Rodrigo Costas at the InSySPo São Paulo Excellence Chair. An example of this research can be seen in Figure 1, which shows a visualization of clustered COVID-19 terms.

                The 1st edition (20 May 2020)

                The1st edition of the webinar was organized byLudo Waltman andGiovanni Colavizza at CWTS, while the speakers were affiliated with other institutions. The webinar was attended by almost 200 participants. The webinar was organized into the following three panels with a moderated discussion at the end of each panel.

                Panel 1 “Debates on social media” included presentations on “COVID-19 publications: Citation indexes and altmetrics” by Mike Thelwall (University of Wolverhampton); “Media coverage of COVID-19 research” by Mike Taylor (Digital Science), and “Assessing the risks of "infodemics" in response to COVID-19 epidemics” by Riccardo Gallotti (Bruno Kessler Foundation – FBK, Trento).

                Panel 2 „Societal questions“ provided a rich perspective through the following presentations. “How scientific research reacts to international public health emergencies: a global analysis of response patterns” by Lin Zhang (Wuhan University); “Early signals of a widening gender gap in publication frequency during the COVID-19 pandemic” by Jens Peter Andersen (Aarhus University), and "Consolidation in a crisis: patterns of international collaboration in COVID-19 research" by Caroline Wagner (Ohio State University).

                Finally, Panel 3, entitled “Mapping COVID-19 research“ focused on the following talks. “The COVID-19 Open Research Dataset” was described by Lucy Wang and Kyle Lo (Semantic Scholar, Allen Institute for AI); “Tracking the growth of COVID-19 preprints” was presented by Nicholas Fraser (ZBW Leibniz Information Centre for Economics), and Simon Porter (Digital Science) dived deeper into “COVID-19 and preprint publishing culture”.

                Based on the positive feedback on the first edition, we started a2nd edition, which was a coordinated effort by CWTS and TIB Leibniz Information Centre for Science and Technology. This edition was organized by Ludo Waltman, Zohreh Zahedi, Grischa Fraumann, and Giovanni Colavizza.

                Figure 1: Example visualization on clustered COVID-19 terms created with the VOSviewer software

                The 2nd edition (8 September 2020)

                The feedback from the 1st edition was taken into account to develop the webinar series further, for example, an additional focus was set on knowledge graphs, and we invited two speakers for that purpose. The 2nd edition was again structured into three panels with a moderated discussion at the end of each panel.

                The speaker line up for Panel 1 “Pandemic effect“ was as follows. Milad Haghani (University of Sydney) presented on “Covid-19 pandemic and the unprecedented mobilisation of scholarly efforts prompted by a health crisis: Scientometric comparisons across SARS, MERS and 2019-nCov literature”; Wei Yang Tham (Harvard University) focused on “Quantifying the Immediate Effects of the COVID-19 Pandemic on Scientists”, and Serge Horbach (Aarhus University) reported on “Pandemic Publishing: Medical journals strongly speed up their publication process for Covid-19. Stefano Canali and Simon Lohse (Leibniz University Hannover) presented together on “Epistemological aspects of evidence-based health policy: the case of Covid-19”, and finally Goran Murić (University of Southern California) talked about “COVID-19 amplifies gender disparities in research”.

                Panel 2 “Social media“ included the following two presentations. “COVID-19 research and social media” was introduced by Rodrigo Costas (Leiden University), and Anders Blok (University of Copenhagen) talked about “How We Tweet About Coronavirus, and Why: A Computational Anthropological Mapping of Political Attention on Danish Twitter during the COVID-19 Pandemic”.

                The final session, Panel 3 “Open science/open research” focused on a call for open science, and the above-mentioned knowledge graphs. For that, Jan Homolak (University of Zagreb) presented on ”Preliminary analysis of COVID-19 academic information patterns: a call for open science in the times of closed borders”; Jennifer D'Souza (TIB Leibniz Information Centre for Science and Technology) introduced “Covid-19 Bioassays in the Open Research Knowledge Graph”, and finally Maria-Esther Vidal (TIB Leibniz Information Centre for Science and Technology) described “How Do Knowledge Graphs Contribute to Understanding COVID-19 Related Treatments?”.

                Connecting the community

                The webinar included diverse speakers and an audience from the science studies community and beyond. As in all current events, participation from around the world is possible due to the virtual format. We believe that the webinar provided an opportunity to connect COVID-19 science studies research and that the participants could benefit from the presentations and discussions. A 3 hours event structured into three panels seems to be an appropriate format for this purpose, although the different time zones of the organizers and participants are sometimes challenging.

                Finally, some presentation videos of the 2nd edition were edited by TIB Conference Recording Service and published at the TIB AV-Portal, a platform for scientific videos and events. We would like to thank especially the engaged speakers who swiftly accepted our invitation to present at the webinars.

                Header image: Austin Distel

                ]]>
                Grischa FraumannGiovanni ColavizzaLudo WaltmanZohreh Zahedi
                Utrecht lunch walks: an initiative to cope with remote workinghttps://www.leidenmadtrics.nl/articles/utrecht-lunch-walks-an-initiative-to-cope-with-remote-working2021-03-16T10:55:00+01:002024-05-16T23:20:47+02:00Working from home can be a lonely experience. Sometimes, you just wish to have a ‘real’ chat with a colleague. Therefore, the CWTS-colleagues from the city of Utrecht started experimenting with socially distant lunch walks. It turns out – this is going pretty well!This blogpost is a follow-up of the post by Ed Noyons Going back to normal?, published almost a year ago. Back then, he discussed the impact of COVID-19 on work conditions and proposed the idea of rethinking all the commuting we were doing in ‘normal' times.

                So, what is happening one year later?

                As COVID-19 turned our world into a more physically distant one, many people maintain social, educational, and workplace contact via online meetings and conferencing. On the one hand, we are able to deal with the current situation, having appropriate facilities for almost all of us to stay and work in our homes. However, in the long term, the virus's growing impact on people’s well-being is noticeable and a little change in daily routine can make the difference in our personal life as well as in our professional life and work performance. For many people, working from home can be a lonely enterprise in this era of social distancing and one thing still remains: the desire to have a ‘real’ chat with a colleague. Therefore, among the many initiatives at CWTS, there is one I like in particular: the lunch walks.

                What is it all about?

                A previous study in the Journal of Occupational Health Psychology found that taking a short walk during a lunch break might allow employees a rest from the cognitive process required during the workday, which becomes even more relevant in a home-working situation. Our colleague Inge van der Weijden put this idea into action and suggested a weekly schedule for all CWTS staff living in Utrecht and willing to participate. But that was no issue at all, everyone was very enthusiastic about this initiative!

                From February on, the first schedule was drafted for the coming four weeks in which everyone was paired up with someone else once a week. The Utrecht team was also formed: Bram, Carole, Ed, Inge, Leonie, Rinze, and Sonia (and Tim, who joined us later in March). We decided to call ourselves the ‘Utrecht Squadron’.

                How did we experience it?

                Bram and Ed met for the first time in real life for a lunch walk in Lunetten, Utrecht. This was an excellent way to get to know each other, but as to be expected, there is so much more to discuss that they are already looking forward to the next session.

                The same week, Leonie and I also had a nice walk along the Singel. Unavoidably, our discussion turned to the question of how to make sense of all those informal activities as well when it comes to evaluating research organizations. After all, you would think that they can be quite important! Only how do you account for them?

                The week after, in a park in between their homes, Inge and Ed met for a short walk during lunch and a coffee to go. Such a nice way to get things off your chest and to look for opportunities in the future! On the most beautiful day of the year, Ed and I walked along the Singel in Utrecht. A wonderful track around the city centre, where we discussed extensively the new challenges raised by managing projects and our lives.

                Leonie Utrecht
                Leonie and an anonymous snowman in Utrecht.

                A socially distant walk due to slippery conditions, Inge and Leonie decided not to meet in person. Instead, they had an hour-long phone conversation, while walking in Leidsche Rijn (Inge) and Oost (Leonie). The huge snowman around the corner from where Leonie lives served as a stand-in for Inge. So now the research question is: did both of them walk 4.4 km? Inge did, according to her ‘Stappenteller app’. Did Leonie as well?

                The week after, Rinze and Leonie had a non-scheduled walk. They talked about the practice of the Strategy Evaluation Protocol, about societal impact and recognition and rewards. Well, anyone who knows them could have guessed that…

                The same week, Bram and Inge had a sunny walk in Lombok and Oog in Al while one week later, Bram and Leonie had a very pleasant and sunny walk in Amelisweerd. They talked about the controversial A27 project in the beautiful surroundings of Amelisweerd, and about being new at CWTS and starting a new job in times of Corona. Sonia and Ed explored the city centre together and enjoyed a pumpkin and onion soup while talking about Sonia’s current and future projects at CWTS. The last week of February, Inge and I had a walk at the ‘Muntgebouw’ in Utrecht where we discussed the progress of institute projects we are working on together.

                Ed inge utrecht
                Inge and Ed posing for a selfie during a lunchwalk.

                Exchanging with colleagues in real-life settings

                Thank you, Inge, for taking the lead in organizing these lunch walks! Breaking the working day with an outdoor activity such as walking is a great way to cope with the strange circumstances that we are all in. Not to forget about the health aspects, of course. It might be for a reason that Leiden University invited its members for a walking competition as part of its health week in early March. Emphasizing more the aspect of exchange, the University of Amsterdam also introduced a walking activity for its students only recently. For me, the lunch walks are a great opportunity to keep each other informed on our daily activities and current research projects. And I think - with these obvious benefits, the impact of those informal exchanges cannot be valued high enough. But as long as we don’t step up our selfie-game, it will likely be impossible to keep track of all of that. Some things are just difficult to measure…

                Header image: Tania Morán Luengo

                ]]>
                Carole de Bordes
                Visualising quantitative data with VOSviewer will widen your research projectshttps://www.leidenmadtrics.nl/articles/visualising-quantitative-data-with-vosviewer-will-widen-your-research-projects2021-03-08T14:14:00+01:002024-05-16T23:20:47+02:00VOSviewer is a well-known and widely used software tool visualising quantitative data. Learning to use all VOSviewer’s features through guided instruction was an exceptional and new experience for us. In this post, we share some of our recent experiences in mastering our science mapping skills.The course “Visualising Science Using VOSviewer”

                VOSviewer was developed to construct various networks based on scientific literature. One type of maps is co-occurrence networks of essential terms. They provide an overview of the topics in the publications. Other networks are bibliometric; they are based on co-authorship or citations. Such maps represent connections between researchers, their institutions, countries, or journals and individual papers. Researchers worldwide use VOSviewer to create, visualise, and explore networks based on textual and bibliographical data.

                To be sure, it is easy enough to start using VOSviewer and learn how to employ all the available features independently. The VOSviewer website contains a comprehensive manual and advice on getting started. It also provides numerous examples and links to additional relevant sources.

                However, the tool’s developers—CWTS bibliometrics researchers Ludo Waltman and Nees Jan van Eck—also hold an annual course to help researchers familiarise themselves with VOSviewer. What could be better than a course run by the developers of the tool you want to use efficiently? For us, it was an excellent opportunity which took only four afternoons, but our proficiency improved considerably.

                Fostering the learning progress

                Before the world was forced to move online, it seemed impossible to many of us to learn new things effectively via online classes. But for Visualising Science Using VOSviewer, the online format posed few problems and had some unique benefits.

                For one thing, holding the course online made it possible for participants to communicate with others from all over the world. When we got some time for introductions and informal chats, we found out that it was an early morning for the Americans and almost night time for the South Koreans. Besides sharing our interests in VOSviewer, we talked about snowy weather, music and hobbies (“Are these guitars behind you real?”), and so forth.

                Even though the lecturers advised us to use the datasets most relevant to our investigations, they also prepared some that we could use in our practice sessions. They offered a well-structured package of comprehensive course material.

                The course itself took place via Microsoft Teams, and when somebody was struggling to comment in Teams, Ludo and Nees created a Slack channel. It was convenient for participants to have an additional communication channel with lecturers for questions and answers. Even after the course ended, activities in the Slack group have continued so far.

                Participants varied in their research backgrounds and in their ability to move from one unknown feature to another. Even so, this course has a very pleasant balance. We comfortably moved from listening to theoretical knowledge all together to doing practical assignments in smaller groups. When problems arose, anyone could share their screens and seek immediate, expert help and attention from Ludo or Nees. In this way, we not only efficiently solved our own issues but also learned from others. Finally, over the course, we gained more ideas on how to further explore our datasets.

                Moreover, those who elaborated on advanced projects or just needed more time for clarifications were able to set up individual consultations with Ludo or Nees, who devoted time so that everyone had all their enquiries answered. This option benefited participants significantly.

                Coming feature of VOSviewer: online presence

                At the last session, we had the fantastic opportunity to create our maps using a beta version of VOSviewer Online. This allowed us to share our discoverable networks with anyone curious to examine them further. Below you can find the maps we created over the course in VOSviewer Online.

                Eleonora was curious about looking at the national accomplishments of her home country, Lithuania. She created traditional co-authorship networks of countries collaborating with Lithuania, based on bibliographical data downloaded from the Web of Science Core Collection:

                This course gave her greater confidence in her mapping skills, so she shared her networks with Lithuanian readers.

                Qianqian likes an overlay visualisation, another VOSviewer network functionality. The overlay map can, for example, clearly show the changing pattern of terms over time. This is useful as it reflects the development of a particular research area. Such visualisations are vital for studying the evolutionary trend, trajectory, and research front of a given field.

                Qianqian wanted to look at research on “cardiovascular disease” at a glance, so she downloaded data on “cardiovascular disease” between 2018 to 2020 from the Web of Science Core Collection. Below, you can see the term overlay visualisation map that resulted from this data:

                The overlay map created by Qianqian presents the development of cardiovascular disease research over three years. It shows that an initial focus on obesity research shifted to infections. The colour scale reflects average publication dates for each term (in our case it is between 2018 and 2020), and endpoints were set automatically by VOSviewer. Thus, some terms in yellow have an average date considerably later in the dataset, and some terms in dark blue have an earlier average date.

                Learning to use all VOSviewer’s features through guided instruction was an exceptional and new experience for both of us. Through this course, we systematically mastered science mapping skills that will enhance our research projects. VOSviewer is a magnificent and freely downloadable tool that could expand your own analysis. You can learn how to use it individually or with a group by participating in the VOSviewer course, Visualising Science Using VOSviewer.

                ]]>
                Eleonora Dagienehttps://orcid.org/0000-0003-0043-3837Qianqian Xie
                Research evaluation in context 3: The board, the research unit and the assessment committeehttps://www.leidenmadtrics.nl/articles/research-evaluation-in-context-3-the-board-the-research-unit-and-the-assessment-committee2021-03-04T10:30:00+01:002024-05-16T23:20:47+02:00What is the procedure for the evaluation of academic research? What are the roles and responsibilities of those involved? This is the 3rd post in a series on research evaluation in the Netherlands and is dedicated to the Strategy Evaluation Protocol 2021-2027.In a previous post the SEP 2021-2027 was introduced. As a reminder: the Association of Universities in the Netherlands (VSNU), the Netherlands Organisation for Scientific Research (NWO) and the Royal Netherlands Academy of Arts and Sciences (KNAW) share the responsibility for the evaluation of all academic research units. According to the SEP 2021-2027, research units are evaluated in the light of their context, aims and strategy. Also, an evaluation should be understood as integral part of ongoing quality assurance. Evaluation is intended to reflect and learn, it is of formative nature.

                The board is responsible and commissions the evaluation,…

                The board of an academic research performing organisation is responsible for the evaluation. This includes ensuring that all its research units are evaluated once every six years. It also includes commissioning the evaluation, determining the Terms of Reference (ToR) for the evaluation, appointing an assessment committee and ensuring follow-up.

                The board develops the ToR for each evaluation, specifying the aims, criteria, procedure and schedule of the evaluation. Most of it is laid down in the protocol, but the board can add extra aspects or evaluation questions. These might relate to everything and anything: a recent reorganisation of the unit; the upcoming retirement of key staff; novel, maybe potentially disruptive, research opportunities; external funding, etc. The board also appoints the assessment committee, after consultation with the unit.

                … the research unit provides evidence in the form of a self-evaluation report…

                Given the attention for context, aims and strategy, the research unit has considerable influence in the evaluation process. And that is intentionally. After all, the evaluation takes place in light of the aims, strategy and context of the unit.

                The unit is asked to write a so-called self-evaluation report. It is, in fact, more a concise report in which the unit presents itself. The aims and strategy of the unit are central. With the aims and strategy as a reference, the unit describes the achievements of the past six years and it presents future plans. All this in 20 pages or less, and written as a coherent and narrative argument.

                … - with indicators of choice - ….

                That’s not all. The unit is asked to identify and present forms of evidence that underpin its argument in a robust way. In other words: the unit itself chooses indicators that best fit its context, aims and strategy. It should present the indicators in the report, explain the choice for the indicators and explain how these indicators relate to the unit’s aims and strategy.

                The protocol doesn’t prescribe the use of certain indicators, on the contrary; it leaves room for plurality. It merely presents potential indicators. However, the protocol mentions six categories for which the unit is expected to present evidence: Research products for peers (1) and for societal target groups (2); Demonstrable use of products by peers (3) and by societal target groups (4); Marks of recognition from peers (5) and by societal target groups (6).

                There is but one restriction: it is not allowed to use the Journal Impact Factor. And there is a firm warning against the use of the H-index. The protocol refers to the DORA declaration and presents arguments for these choice.

                … with a number of annexes…..

                The annexes to the self-evaluation report contains basic information, such as number of staff, funding and PhD candidates. It also contains the evidence to the self-chosen indicators.

                Moreover, the annex should contain a number of case studies. These cases can relate to anything specific that the unit considers important, such as particular projects or programmes, how the unit has organized its interaction between research activities and society or between research and the PhD programmes. Note that these cases don’t need to relate to societal impact per se. Yet the protocol mentions that the case studies are pre-eminently suited to indicate the connection between the academic and the societal. A connection, the protocol explains, that is seen as essential in many academic domains and disciplines.

                A final annex, that comes closest to a self-evaluation, is a “SWOT” analysis. The unit is asked to analyze its own strengths and weaknesses, and to identify external opportunities and threats. The SWOT analysis should be used to inform the strategy for the years to come.

                … and an independent assessment committee,…

                For each evaluation, a dedicated and independent assessment committee is appointed. The unit is expected to propose members. After all, the unit is evaluated in light of its own context, aims and strategy. However the board decides, can remove an add members, and formally appoints the committee.

                The committee as a whole (not every member separately) should be able to assess the unit, all criteria and every aspect. It should be diverse, in terms of gender and cultural, national and disciplinary background. It is advised to include a non-academic expert, but this is not required. There are only two strict requirements: at least one PhD candidate and one early-/mid-career researcher have to be part of the assessment committee.

                The committee is supported by an independent secretary. The secretary should have experience with assessment processes within the context of scientific research in the Netherlands. Moreover, the secretary should be independent of the board and the research unit.

                … based on the self-evaluation and a site-visit,…

                The committee is expected to come to its assessment based on the documentation and a site-visit. The documentation includes the self-evaluation report with annexes, as well as the previous assessment report.

                During the site-visit the committee members meet with representatives of the research unit (management and researchers, including research leaders; tenured and temp staff; PhD candidates), as well as with representatives of the research organisation and external partners. This allows to verify and supplement the information provided in the self-evaluation.

                In some cases the visit takes place on neutral grounds, for instance when a number of universities collaborate in a nationwide evaluation. And in recent months, because of the restrictions due to the pandemic, the site-visits took place virtually, online. However, the idea is that a site-visit allows the committee to take the situation on site, including the infrastructure, into account.

                … formulates its assessment…

                The committee presents its assessment in a written report. It should be a sharp, discerning and clear assessment. It should describe positive issues and – very distinctly, but constructively – weaknesses and suggest improvements. The text should give a clear assessment regarding all criteria and aspects. In case extra aspects were addressed in the self-evaluation report or the ToR, the committee is expected to address these in the assessment report as well.

                … upon which the board formulates a position and ensures follow-up.

                The committee submits the report to the board, upon which the board formulates a position. The board is expected to reflect on the assessment and to state how it will follow up on the assessment. The SEP 2021-2027 positions evaluation as part of ongoing quality assurance in the research performing organisation, even more so than before. It urges the board to discuss the assessment outcome and potential actions with the unit, and to use the report as a reference in the years to come.

                The board needs to follow-up on the evaluation in a different way as well. For public accountability reasons, the board is required to publish the evaluation portfolio on in its website. This includes a summary of the self-evaluation report, the case studies, the assessment report and the position document of the board.

                And what about the follow-up of this series?

                This and the previous post describe the formal procedure, goals and criteria of an evaluation, as described in the current Strategy Evaluation Protocol 2021-2027. The text of the SEP 2021-2027 has been a major source for both blog posts. But there is more to understanding research evaluation in context / in the Netherlands. So a future blog post will be dedicated to the practice - or should one say the challenges? - of research evaluation in context. And another one to the practice of designing a protocol, that is responsive to developments and concerns in research (policy).

                ]]>
                Leonie van Drooge
                Bona Fide Journals - Creating a predatory-free academic publishing environmenthttps://www.leidenmadtrics.nl/articles/bona-fide-journals-creating-a-predatory-free-academic-publishing-environment2021-03-02T10:30:00+01:002024-05-16T23:20:47+02:00Predatory journals pose a significant problem to academic publishing. In the past, a number of attempts have been made to identify them. This blog post presents a novel approach towards a predatory-free academic publishing landscape: Bona Fide Journals.A recent item in Nature News reports “Hundreds of ‘predatory’ journals indexed on leading scholarly database”, sub-headed “[…] the analysis highlights how poor-quality science is infiltrating literature.”

                A year before, a group of leading scholars and publishers already warned in a comment in Nature, "So far, disparate attempts to address predatory publishing have been unable to control this ever-multiplying problem. The need will be greater as authors adjust to Plan S and other similar mandates, which will require researchers to publish their work in open-access journals or platforms if they are funded by most European agencies, the World Health Organization, the Bill & Melinda Gates Foundation and others."

                Given the significance of the problem of predatory publishing, QOAM (Quality Open Access Market), in cooperation with CWTS, has started a new initiative to create a predatory-free academic publishing environment: Bona Fide Journals.

                The harm

                The fine of $50 million imposed by a U.S. federal judge to OMICS reflects the material damage this publisher caused over the years 2011 to 2017. Given the long list of predatory publishers, it seems only a modest guess to multiply this $7 million per year by 3 to have an indication of the harm caused by all of them together, making it roughly $20 million annually. This figure might be growing under the current publication pressure, while, at the same time, predatory journals simply pass the compliance test of the newly launched Plan S Journal Checker Tool.

                On top of that is the immaterial, hard to quantify damage to the reputation of misled authors and falsely advertised editors and reviewers. This affects the authority of the whole fabric of science. “Publications using such practices may call into question the credibility of the research they report,according to the US National Institutes of Health (NIH). Predatory journals contaminate the scientific and scholarly domain with fake news in a period in which the integrity of science may be more important than ever.

                Also, niche journals outside the mainstream of the highly branded portfolios of the big publishing houses are at risk. Jan Erik Frantsvåg conducted a thorough analysis of journals removed from the Directory of Open Access Journals (DOAJ) in their 2016 grand cleansing operation. His resonating conclusion is that “there is nothing […] that indicates that the journals that were removed were of inferior scholarly quality compared to those remaining.” In such a banished mix the good suffer from the evil and a differentiating service is urgently needed. Till today, this problem continues. See here and here and here.

                The remedy

                Figure 1. Schematic overview of the selection process for
                Bona Fide Journals. Colours in the flowchart mark the level
                of trustworthiness: blue sufficient, light blue partial, grey no.

                Setting up a list of predatory journals has proven problematic (see here and here). Conversely, creating a list of trustworthy journals outcasts honest journals that did not make it to the list. Other attempts concern lists of criteria for ‘predatory-ness’, leaving it to individual researchers to check a specific journal (see here (paywalled) and here).

                Recently, QOAM in cooperation with CWTS, launched a new initiative: Bona Fide Journals. Starting with all 42,000 journals in QOAM, the idea is to indicate the journals in the list which are deemed non-predatory, either because they are no-fee journals or because they are approved by library professionals. Examples of the second category are journals in DOAJ and journals included in institutional deals.

                However, this still leaves thousands of journals unaddressed. Bona Fide Journals will enable institutional libraries to express their trust in these journals. The expectation is that most libraries are familiar with a number of niche journals from institutions, societies or charities in their own discipline, region, or language.

                The only thing libraries have to ascertain is that a journal is not mala fide. In case of doubt, the Compass to Publish may offer practical guidance. If a journal has gained expressions of trust from three different libraries, it will be included in the list of trustworthy journals. Thus, libraries may resume their role as quality guardians of the academic publishing domain.

                Next to DOAJ, other sources may be included in the second diamond of the flowchart (see Figure 1), such as high-profile indexing services or recognized platforms like Redalyc, SciELO, OpenEdition, or African Journals Online.

                What is available now?

                Today, Bona Fide Journals is operational as a minimal viable product, soliciting user comments to guide further development. Potential current use cases are:

                • A (spammed) researcher checking the trustworthiness of a journal which solicits their article.
                • A library suggesting a specific collection of trustworthy journals for a project or an institute.
                • An open access publishing service using the list of Bona Fide Journals to filter out predatory journals that may have infiltrated into their journal base.

                What is next?

                Bona Fide Journals offers basic evidence of the honesty of journals, but journals may still differ a lot when it comes to peer review, editing, data transparency, speed of publication, author evaluation, or publication fee. There are several websites that provide useful information on these aspects, but authors who wish to select a journal in which to publish their article may easily get lost when trying to find the most relevant information. Therefore, a next step that we hope to take is to develop an infrastructure that brings together the diversity of such services in a more systematic way. Instead of reducing the selection of a journal to a simplistic dichotomy (mainstream vs. unfamiliar) or a questionable one-dimensional ranking (journal impact factor), such an infrastructure offers researchers an informative variety of publishing options and enables the scientific community to optimally benefit from these options.

                ]]>
                Leo WaaijersLudo WaltmanSaskia de VriesThed van LeeuwenNees Jan van Eckhttps://orcid.org/0000-0001-8448-4521
                Attention for science in step with policy? The case of school closures during COVID-19https://www.leidenmadtrics.nl/articles/attention-for-science-in-step-with-policy-the-case-of-school-closures-during-covid-192021-02-25T11:30:00+01:002024-05-16T23:20:47+02:00The closing and opening of schools during the COVID-19 pandemic caused much debate. How was scientific evidence used in the ensuing public discussion? Our authors searched for evidence in the news and on Twitter and looked at three countries in particular: the Netherlands, Spain, and South Africa.One of the many puzzles of the COVID-19 pandemic has been the extent to which children are vulnerable to and spreaders of the virus. Fewer infection rates have been reported in children compared with adults, as have milder symptoms. But the infection rate in children is biased, given the testing policies in many countries. Schools received distinct attention early on in the pandemic – closing schools was among the first measures taken worldwide to reduce the spread of the virus. By March 31, 2020, schools in 193 countries were closed. Likewise, reopening schools has been part of the first steps in the easing of lockdown restrictions. With no definite scientific consensus regarding children’s role in the transmission of the virus, decisions on the reopening of schools could not be deferred.

                Given the uncertainty, we were curious about how scientific information was used in the public debates around the closing and opening of schools. In a recent case study, we looked at Spain, South Africa, and the Netherlands, each of which introduced different measures. (At the time of the writing of our study in early December 2020, the school closings in winter 2020/2021 still had to happen.)

                Our point of departure was the COVID-19 Open Research Dataset (CORD-19) and the World Health Organization (WHO) COVID-19 Global literature on coronavirus disease database as of October 15, 2020. In this set, we identified 5,713 publications that were related to the key-terms ‘children’ and ‘schools’. In data provided by Altmetric.com, we found news media items and tweets from the three countries that included a mention of any of these publications (Table 1).


                SpainSouth AfricaNetherlands
                News articles18874133
                Scientific publications mentioned in news articles746976
                Tweets15,6039921,277
                Publications mentioned in tweets852272214

                Table 1. Country-based mentions of publications in the news and on Twitter
                (February 1, 2020 – September 30, 2020).

                We then connected the attention paid to the topics covered in both news and on Twitter with the policy responses in the three countries. The patterns of the measures taken differed. In the Netherlands, after an initial lockdown, schools reopened in May 2020, at quite an early stage of the first wave of the outbreak. In South Africa, the outbreak took place in March and schools reopened early in June, just to close again a month later due to the rise of infections, and reopen again in August. In Spain, schools did not open until after the summer holidays.

                Spain

                Figure 1 depicts the announced and implemented measures in Spain as well as the distribution of the news items and tweets originating from Spain. There is a small peak of tweets around the time of the announcements in March, and shortly before and after the schools’ reopening in September. Further activity was registered during the schools’ closure, with peaks around the end of April, when the government announced a plan for easing lockdown restrictions, and also in July and August, when no announcements were made.

                Figure 1. Timeline of announcements and implementation of school closure and reopening in Spain, along with the distribution of tweets (on the left y-axis) and news items (on the right y-axis) mentioning scientific articles.

                The highest number of tweets in early July revolves around a nationwide, population-based seroepidemiological study on the prevalence of SARS-CoV-2 in Spain. A total of 1,906 tweets followed soon after the article was published in the Lancet. The second-highest tweeted article (739 tweets) reports on the paediatric severe acute respiratory syndrome and received distinct attention before the school reopening, as well as again in September. Similarly, attention was paid before the school reopening to the safety of reopening (primary) schools (see here and here).

                There are almost no news mentions in March, with sustained but low activity between April and July, and recurrent peaks on specific days at the beginning of May, June, and July. This is followed by more constant activity in the media at the end of August, prior to the reopening of schools. The single-most mentioned article (20 news mentions) received most attention in April. It presents findings on the potential impact of the summer season on slowing the pandemic, weighed against an alternative hypothesis that school closures account for such slowing. The two next most mentioned papers have 17 mentions each. One of them discusses the results of a nationwide screening undertaken in Spain between April and May and concludes that at the time of the survey, there was a seroprevalence of around 5% with lower figures for children (<3.1%) and a third of the positive cases being asymptomatic. The other one focuses on children tested positive.

                South Africa

                In South Africa, there was a notable difference in the reopening of secondary (high) schools and primary schools in July and August (see Figure 2) – primary schools reopened later than secondary schools. Of the 74 news articles originating from South Africa, 33 were published during the first school closure and only 18 in September. The most mentioned studies in the news are again the one on paediatric severe acute respiratory syndrome, and one on large-scale anti-contagion policies. Regarding Twitter, we observe activity around the announcement of school closure in March, and immediately after the first confirmed death, which registers the highest Twitter activity. The highest number of tweets (92 tweets) was sent for a study concerned with the wearing of face masks. The second peak of Twitter activity registered in May around the announcement of a phased reopening of schools reveals discussions gravitating around the Kawasaki-like disease and transmission of the virus by children. Similarly, the discussions from the end of June and beginning of July coincide with the first Europe-wide study of children which suggests mild disease in children and rare fatalities. Second comes the aforementioned seroepidemiological study from Spain (39 tweets).

                Figure 2. Timeline of announcements and implementation of school closure and reopening in South Africa, along with the distribution of tweets and news items mentioning scientific articles.

                The Netherlands

                Like Spain and South Africa, the government in the Netherlands decided to close schools in the middle of March. Primary schools were reopened first, at half capacity, whereas secondary schools reopened three weeks later, also at half capacity. The partial opening was short (until June 8 and 15, respectively), after which they were fully open. The second school closure coincided with the summer holidays in the Netherlands (see Figure 3.)

                Most news media attention occurred in the period during the school closure and the partial reopening in April and May. Fewer mentions were observed during the summer months, and only 21 were found in September. One study with a relatively high number of mentions to a scientific article (13 news items) reports on the protection through face masks. This is remarkable, as wearing face masks in indoor public spaces was not mandatory until December 2020. In the case of Spain and South Africa, mask wearing was made mandatory earlier, but the news covered this study with only two and one mention, respectively.

                Like South Africa, the Netherlands registers relatively modest Twitter activity. The first sustained discussion on Twitter was stirred up by the announcement on March 12th that schools would remain open. The tweets debated the official stance that children are less susceptible to become infected. The highest tweeting activity (96 tweets) was generated by the study reporting on the efficacy of face masks. The second-most tweeted article (79 tweets) mentioned paediatric SARS-CoV-2, while the third-most tweeted one (71 tweets) is a news piece in Nature, discussing scientific support for the wearing of face masks. In mid-May, a systematic review of the literature on SARS-CoV-2 clusters linked to indoor activities caught the attention of Dutch tweeters. The discussion revolved around the need for outdoor sports (for children).

                Figure 3. Timeline of announcements and implementation of school closure and reopening in the Netherlands, along with the distribution of tweets and news items mentioning scientific articles.

                Conclusions

                Our findings suggest national differences regarding the research that was prominently discussed in the news and on social media. This suggests diverging priorities in the public discussion, even during a pandemic, and underlines the importance of considering national contexts when analysing the communication of science.

                We also identified a disconnection between the timelines of measures and the intensity of communication of science in the channels observed. The reaction to policy moments was not necessarily accompanied by interest in related scientific output. Attention on Twitter – except for some weak evidence from the Netherlands – was in most cases triggered by the publication of a scientific article, and not a policy event. It is conceivable that this mirrors the interests of the tweeting population – such as researchers or health professionals.

                This might also be a reason for the moderate activity on Twitter, with, for example, no particular social movements advocating for a certain position and using scientific information accordingly (as can be observed in the case of the anti-vaccination movement). Also, no highly active Twitter accounts could be found. There were only two accounts (both from Spain) which tweeted more than 100 times during the eight-month period observed (one of them belonging to a paediatrician, the other one to the Spanish Society for Paediatric Infectious Diseases). It seems that Twitter was not (mis-)used as a communication platform to amplify ideologically driven messaging, at least in this context. In the case of the news media analysed, we identified several cases of miscommunication of scientific information, which illustrate that the intricacies of scientific studies are not always accurately communicated in the media.

                In conclusion, these findings point to the need for further research into the communication of science in specific (national) contexts and across multiple communication platforms during a pandemic. If you are interested in finding out more about our work, please read our recent preprint. It includes, among other details, visualizations of the terms extracted from the articles in our study and a more in-depth exploration of the patterns of news attention and Twitter activity.

                The work presented in this blog post has received funding from the TU Delft Covid-19 response fund. Also, we would like to thank Altmetric for providing access to data on news and Twitter mentions.

                ]]>
                Jonathan Dudekhttps://orcid.org/0000-0003-2031-4616François van SchalkwykRodrigo Costashttps://orcid.org/0000-0002-7465-6462Daniel Torres-SalinasNicolás Robinson-GarcíaTina Nane
                The X factor of eXcellent scientists in the Netherlands: relationships between motivation, utilisation and impacthttps://www.leidenmadtrics.nl/articles/the-x-factor-of-excellent-scientists-in-the-netherlands-relationships-between-motivation-utilisation-and-impact2021-02-19T10:00:00+01:002024-05-16T23:20:47+02:00Can excellent science be connected with successful research commercialisation? Top scientists winning prestigious Spinoza and Stevin prizes share some insights. Their ‘X factor’ achievements suggest that institutionalised research commercialisation can benefit from more personalised pathways.Excellent science

                Achieving scientific success depends on several factors: inspiration, creativity, hard work, access to the most advance instruments, et cetera. In the scholarly literature, excellent output of scientists has been described as a resultant of several factors with complex and often unpredictable interactions between personal characteristics such as education, personality, motivation, ambition with a mix of environmental factors [see 1, 2, 3, 4 ].

                But chance is also one of these determinants. Only a small minority of ‘lucky’ scientists discover something really new and worthwhile, with exciting insights and prospects for their fellow researchers to further unravel. An even smaller number of researchers produce ‘once in a lifetime’ scientific breakthroughs that generate major impacts on contemporary science, societies and economies. Think ‘Albert Einstein’ or, perhaps more appropriate at these special times, the developers of the radically new production platforms for Covid-19 vaccines.

                Science celebrates its top scientists. And funders will keep supporting such excellence, as long as the general public, politicians and governments are convinced that scientific research is also a worthwhile effort for all of us. But during the last two decades stakeholders have become increasingly concerned and pose some fundamental questions: is science doing enough to tackle and solve the numerous societal, environmental and economic problems that affect mankind? Think for example about global climate change, human and animal health and welfare, poverty reduction, emigration… and again the Covid-19 pandemic. Pressure seems to be mounting to provide scientific results, especially of academic research, more useful for societal applications and the economy.

                Research commercialisation and knowledge transfer

                The Netherlands has been one of many countries in the European Union to adopt policies to move universities out of their ‘Ivory Towers’ and commercialise scientific research results faster and more effective. In 2004 research commercialisation officially became the third mission of universities in the Netherlands (along with education and scientific research). In the year 2000 the Dutch government also implemented three funding instruments (BioPartner, TechnoPartner, Programma Valorisatie) to also optimise ‘technology transfer’ between universities and industry. Gradually, since the 1980s, most universities in the Netherlands have established specialised units – either within the organisation or decentralised – for knowledge transfer and research commercialisation. Here, we will refer to these organisational units as ‘Knowledge and Transfer Offices’ (KTOs). The organisational set-up and goals of these units vary across universities.

                These policy shifts had a major impact on the scientific work force. During the last two decades individual researchers and engineers in the Netherlands have increasingly been stimulated by government policies and other incentives to develop scientific and technological breakthroughs that can contribute to solve societal problems or create economic benefits [see 7, 8, 9]. One of the prime incentives is the Stevin prize, issued annually since 2018 by the Netherlands Council for Scientific Research (NWO). The award, a whopping 2.5 million euro, should be spent on research or other activities aimed at knowledge utilisation. The Stevin prize has been awarded to 32 scientists since 1998. Knowledge exploitation and utilisation, including venturing spin-off companies, is a criterion for Stevin prize nominees since 2001. Recently, concerns have been raised in the Netherlands that striving for research excellence may actually reduce the capacity of researchers to engage with societal issues.

                Survey and respondents

                Our survey aimed to gather information from these award-winning scientists on the relationships between excellent science, research commercialisation and knowledge utilisation (none of the respondents was informed that we had invited them due to their status as top scientist). We were particularly interested in their motives to engage in utilisation, and their views on how their research achievements were able to create such an external impact. This survey builds on our earlier study that also dealt with motivational factors underpinning research commercialisation activities but framed in the context of intellectual property regimes.

                We applied a mixed-methods approach with a questionnaire and a series of follow-up interviews. The questionnaire collected information on the disciplinary background of the respondents, their main motivation to conduct research, and information on how they used results of their research efforts to create societal impacts. Follow-up interviews were conducted with a subsample of the respondents. Information gathering took place between September 2019 and March 2020.

                The questionnaire was not only sent to all 32 Stevin prize winners but also to those who were awarded the Spinoza prize (the Dutch equivalent of the Nobel Prize), currently worth 2.5 million euros. Between 1995 and 2020 the Spinoza prize has been awarded to 99 scientists for excellent and breakthrough scientific research in their discipline. Our study involved a subgroup of 25 who agreed to participate; 17 Spinoza laureates and 8 Stevin laureates. These Spinoza prize winners worked in natural science (29%), engineering sciences (29%), life and medical sciences (24%), or social and human sciences (18%). Most of those who won a Stevin prize work(ed) in engineering sciences (75%); the remainder in the life and medical sciences (12%) or social and human sciences (12%).

                Motives for doing research

                Figure 1a shows the percentage of Spinoza laureate respondents who are mainly motivated to do ‘basic research’ (i.e. ‘discovery oriented’ research without any intention to seek immediate applications) as opposed to those who are also driven by the wish to apply their research results and perhaps commercialize it. Next to their scientific motivations, the majority of Spinoza respondents fully agree that ‘to obtain scientific insight on topics in their discipline’ is the most important personal motivation to do research, followed by ‘looking for applications of my research results’ and ‘recognition for my scientific achievements’. The vast majority of Spinoza prize respondents (82%) are of the opinion that research commercialisation policies should not be the guiding principle for scientists in general. Interestingly, 94% of these Spinoza laureates has nonetheless been actively engaged with some degree of research commercialisation. A fair share of them have been involved in creating spin-off companies, patent licensing, clinical trials, or dissemination of research data via websites or personal twitter accounts (together 33%). Others have been involved in business consultancy for companies (19%), training (16%), presentation for a general public (16%), or joint research or contract research with companies (13%). Almost half of all these respondents (47%) used the services offered by the KTO at their university or university medical centre.

                (a) Spinoza prize laureates

                (b) Stevin prize laureates


                Figure 1. Main motivation for basic research (% of respondent answers)

                The Stevin prize winners present a markedly different profile. As figure 1b shows, none of them are motivated to conduct basic research without some notion of immediate applications in mind. However, 62% still acknowledge that ‘to obtain scientific insight on topics in their discipline’ is the most important personal motive to do research, followed by ‘looking for applications of my research results’ and ‘recognition for my scientific achievements’. More than a third of these respondents (38%) indicate that ‘research commercialisation policies should be the guiding principle for scientists in their research, 25% found that ‘research commercialisation policies should at least partially guide scientists in their research’. The majority of all Stevin respondents (88%) has been actively engaged in several pathways to commercialise research findings - mostly through joint research or contract research with industry (35%) and/or business consultancy (20%). All of the Stevin respondents acknowledged their use of KTO services.

                Knowledge utilisation and impact profiles

                The scientific results of Spinoza prize winners were disseminated and utilised through a wide range of channels: published research papers (25%), through work of PhD students (22%), but also as contributions to public private partnerships with industry (14%), education (10%), scientific books (10%), patents (8%), or patient care (5%). Stevin prize laureates show a fairly similar distribution: published research papers (19%), PhD students (16%), public private partnerships with industry (16%), for education (12%), patents (12%), spin-off companies (9%), scientific books (6%), other innovations in education and research (6%), or patient care (3%).

                Both groups show slightly different impact profiles. Queried about the channels in which their research really made a significant external impact, the category ‘new technologies’ is by far the most important channel of utilisation within the group of Spinoza prize winners (figure 2a). As confirmed by the data in last paragraph, KTOs play a key role in this channel featuring very prominently among the Stevin prize laureates (figure 2b).But, interestingly, both the Spinoza and Stevin laureates mention several other non-KTO channels, such as research publications, PhD students, and data dissemination.

                (a) Spinoza prize laureates

                (b) Stevin prize laureates


                Figure 2. External impact channels (% of total responses)

                Final reflections

                This exploratory study captures experiences and personal views of 25 prize-winning scientists in the Netherlands. The information from our survey indicates that their personal motives and drive to conduct breakthrough science (summarised here as their ‘X factor’) can be an important factor for researchers to engage with research commercialisation and knowledge utilisation – in some cases perhaps even more relevant than government policies or institutional facilities such as university KTOs. Obviously, more information has to be collected, across a larger group of top scientists, before robust conclusions can be drawn. Nevertheless, our first findings suggest that if current policies and incentives were to be reviewed, it could be beneficial to incorporate views of prize-winning scientists with a track record in research commercialisation and knowledge transfer. Their input to our survey highlights that more personalised approaches may offer supplementary incentives, in addition to KTO services and other institutionalised pathways in the Netherlands, to excel in the societal or economic utilisation of research.

                ]]>
                Peter van DongenRobert Tijssen
                Research evaluation in context 2: One joint protocol, three criteria and four aspectshttps://www.leidenmadtrics.nl/articles/research-evaluation-in-context-2-one-joint-protocol-three-criteria-and-four-aspects2021-02-17T10:30:00+01:002024-05-16T23:20:47+02:00This is the 2nd in a series of blog posts on research evaluation in the Netherlands. This post is dedicated to the Strategy Evaluation Protocol 2021-2027, the evaluation goals and the criteria and aspects that need to be addressed in an evaluation.A joint protocol…

                Ever since 2003, the Association of Universities in the Netherlands (VSNU), the Netherlands Organisation for Scientific Research (NWO) and the Royal Netherlands Academy of Arts and Sciences (KNAW) share the responsibility for the evaluation of all academic research units. They ensure that there is an evaluation protocol that is regularly updated. And they ensure that all academic research is evaluated once every six years, the duration of a protocol.

                VSNU represents 14 large, research-intensive universities. Four smaller publicly funded universities use the SEP as well. NWO and KNAW both govern a number of academic research institutes. The universities of applied sciences have a different protocol, yet the system is more or less similar.

                The current Strategy Evaluation Protocol 2021-2027 (SEP 2021-2027) is the fourth since the introduction of the joint protocols in 2003. The text of this protocol is a major source for this post.

                … for the formative evaluation…

                An evaluation addresses both past developments, strategies and achievements, as well as future plans. The latter aspect is rather crucial. The idea is that the evaluation contributes to maintaining and, when necessary, improving the quality and relevance of the research.

                The current protocol presents the evaluation as integral part of an ongoing quality assurance cycle. Evaluation should facilitate the continuous dialogue between the unit and the board. The evaluation committee is asked to reflect on positive issues and – constructively – on weaknesses, and to suggest where and how improvements are envisaged. These recommendations serve as input in the quality assurance cycle.

                … of academic research units….

                The evaluation takes place on the level of a research unit. The protocol characterizes a unit as an entity that is known in its own right, within and outside of the institution, and that is sufficiently large. The SEP indicates at least ten research FTEs among its permanent academic staff.

                An evaluation shouldn’t relate to a random collection of researchers that happen to work on the same floor, but to a clearly identifiable entity. Moreover, the evaluation does not relate to a collection of research outputs, but to the strategy of the unit.

                … in light of their own context, aims and strategy.

                One major change, compared to the previous protocol, is its name. Until 2021, the protocol was named Standard Evaluation Protocol. Since 2021, it is the Strategy Evaluation Protocol. The protocol stresses, even more so than before, that the goal is to evaluate a research unit in light of its own aims and strategy. An evaluation is not so much focused on the research itself, as it is on the strategy of the unit with regards to research.

                The context in which a unit operates should be taken into account as well. The influence of the organization, with its policies and strategies, and the discipline, with its practices and quality standards, shouldn’t be ignored.

                In order to take these specific aspects into account, the protocol leaves room for plurality with respect to the application and interpretation of the different elements.

                The evaluation criteria are research quality,

                Research quality is one of three evaluation criteria. Central is the contribution to the body of academic knowledge, the quality and scientific relevance of the research and the academic reputation and leadership within the field. Research quality is not further specified. The protocol invites the unit to propose indicators for research quality that fit the context and strategy of the unit and to explain what the indicators actually indicate. The protocol doesn’t provide benchmarks, nor does it prescribe to use benchmarks. The protocol doesn’t provide lists of indicators either. In other words: how research quality is operationalized, is partly up to the unit itself.

                … societal relevance,

                Societal relevance is another of three evaluation criteria. The protocol suggests how societal can be understood: economic, social, cultural, educational or any other terms that may be relevant. It also suggests an interpretation of relevance: impact, public engagement and uptake. Again, the protocol invites units to choose indicators, including case studies, that suit the nature, context and strategy of the unit.

                … and viability…

                The final criterion is viability of the unit. Here the focus shifts from a retrospective view towards a forward-looking view. The unit is asked to provide information on future goals, plans and strategy. Viability relates to the extent to which the unit’s future goals are relevant and to whether its strategy fits these goals.

                … plus, four additional aspects.

                Over the years, specific and diverse elements have been introduced to the protocol. They are now characterized as aspects that need to be addressed during the evaluation. They are 1) Open Science, 2) PhD Policy and Training, 3) Academic Culture and 4) Human Resources Policy.

                For Open Science, the protocol explains that this relates to the involvement of stakeholders in research, FAIR data practices, Open Access publishing, etc. It also refers to the Dutch National Programme on Open Science, especially for the definition of Open Science and Open Science practices. This was done because the definition of Open Science is still developing, the protocol has been written in 2019 and early 2020, and will be used until 2027. By then, Open Science will most certainly have a different connotation than in the late 2010’s.

                PhD policy and training covers the supervision and instruction of PhD candidates. Here the context of the Netherlands is important. In the vast majority of cases, PhD candidates are not registered as students. Usually, PhD candidates are employed by the university as (temporary) scientific staff, with the task to do research. There is also a substantive amount of external PhD candidates. These are employed elsewhere and do their PhD research supervised by scientific staff of the unit. The implication is that PhD policy and training is not being assessed in a regular teaching assessment.

                Academic culture is defined as openness, (social) safety and inclusivity of the research environment. It includes multiplicity of perspectives and identities. Academic culture also covers research integrity and ethics.

                The final aspect, one that partly relates to the previous, is Human Resources Policy. This includes diversity of staff in terms of gender; age; ethnic and cultural background; disciplinary background. It also covers talent management. There is a strong link with current developments in Dutch academia regarding recognition and rewards of academic staff. More on that in a future blog post.

                But first: the evaluation procedure and the role and responsibilities of the board, unit and committee. That is the subject of the next blog post.

                ]]>
                Leonie van Drooge
                Research evaluation in context 1: Introducing research evaluation in the Netherlandshttps://www.leidenmadtrics.nl/articles/research-evaluation-in-context-1-introducing-research-evaluation-in-the-netherlands2021-02-16T10:30:00+01:002024-05-16T23:20:47+02:00How is research being evaluated in the Netherlands? Why in that way? Why would the Dutch want to evaluate research anyway when it is done like that? What is an evaluation really about? No, but really? And how do you compare between….? You don’t? And consequences? Not??Any conversation about research evaluation in the Netherlands has the risk of developing along this line. The Dutch way of evaluating academic research might not be unique, but it is certainly not common, nor fully understood.

                As a member of the working group for the monitoring and further development of the evaluation protocol – and as an employee of CWTS – let me provide insight and context. In a series of blog posts I will focus on the evaluation procedure and the evaluation goals as described in the current protocol for the evaluation of research units. Furthermore, I will focus on the bigger picture and pay attention to the context in which the evaluation protocols have been developed and function.

                A brief summary and outlook to upcoming blog posts

                One way to summarize the core of the Dutch approach is “evaluation in context.” The Strategy Evaluation Protocol 2021-2027 (SEP 2021-2027) describes the process, methods and aims for the evaluation of academic research units. It stresses that research units are evaluated in light of their own aims and strategy. It also mentions that institutional policies and disciplinary practices are relevant and need to be taken into account. Research units are thus being evaluated in context.

                The larger context, in which the protocol has been developed and is used, should be taken into account as well when trying to understand research evaluation in the Netherlands. An evaluation of a research unit is not a stand-alone exercise; the protocol positions the evaluation in the context of ongoing research quality assurance in the research organisation. Changes in the four SEP protocols so far can be understood in the context of trends and developments in academia and research policy. Insight into the landscape and governance of public research organisations in the Netherlands provides context and helps to understand why there are several protocols for the evaluation of public research organisations. Apart from the SEP, there is a protocol (in Dutch) for the universities of applied sciences; another one for some non-academic public research organisations; and ad-hoc protocols for other public research organisations. And why we evaluate research units at all, should be understood in the context of the Higher Education and Research Act. It is the law.

                In previous blog posts, colleagues introduced Evaluative Inquiry (I, II, III, and IV). The Evaluative Inquiry method has been put to practice in a number of projects, supporting research units preparing for a SEP evaluation. These blog posts have already provided some insight into this Dutch approach of contextual evaluation. One of these blogposts was named “Evaluating research in context”; very similar to the title of this series.

                Evaluating Research in Context

                The title of this series is “research evaluation in context.” This is not coincidental. It is a reference to Evaluating Research in Context (ERiC), a project that ran a decade ago in the Netherlands. It was a collaboration between a number of organisations, including the Association of Universities in the Netherlands (VSNU), the Association of Universities of Applied Sciences (currently: Vereniging Hogescholen), the Netherlands Organisation for Scientific Research (NWO), the Royal Netherlands Academy of Arts and Sciences (KNAW) and my previous employer, the Rathenau Instituut.

                ERiC was specifically dedicated to the evaluation of societal relevance. The project was positioned in the context of evaluation protocols for academic research (the Standard Evaluation Protocol 2009-2015) and for research at the universities of applied sciences (the Brancheprotocol Kwaliteitszorg 2009-2015). Along the line of these protocols, ERiC stressed that research should be assessed in context. The context in which research units operate differs from one area of research, discipline, or organisation to another. Another context is provided by the mission of the unit; and this will differ as well between units, even if they operate in the same area of research, discipline, or organisation. As mentioned in a study (in Dutch) that informed the development of the first Standard Evaluation Protocol 2003-2009, comparing seemingly similar research units is like comparing “coal with eggs.” Apples and oranges apparently didn’t cover the difference well enough. The consequence of this evaluating research in context is that a standard set of indicators wouldn’t do justice. ERiC, again in line with the protocols, advises units to choose indicators that provide evidence and does justice to the research unit and its context.

                Next up: 1 protocol, 3 criteria, 4 aspects

                This is a very brief outlook and introduction to research evaluation in context. The next blog post will introduce the current protocol for the evaluation of academic research units, the Strategy Evaluation Protocol 2021-2027. It will present the evaluation criteria and describe four extra aspects that need to be addressed during an evaluation.

                ]]>
                Leonie van Drooge
                A glimpse into the projects at CWTShttps://www.leidenmadtrics.nl/articles/a-glimpse-into-the-projects-at-cwts2021-01-15T11:30:00+01:002024-05-16T23:20:47+02:00In my last days as a project coordinator at CWTS, I'm reflecting on the so-called institute projects we all do at CWTS. In this blog post I would like to share with you my experience as a project coordinator, but first and foremost give you an impression of the variety of projects we do.Institute projects at CWTS are projects that are acquired through different funding sources, such as Horizon2020, tenders set out by the European Commission, but also national funding, such as NWO in the Netherlands. Usually, we work on the institute projects within a consortium of multiple organisations, such as universities, public institutions, or sometimes companies. Projects generally are focused on themes such as research integrity, Responsible Research and Innovation (RRI), Open Science, researcher mobility, and academic careers. This can be either by means of quantitative research or qualitative research, or a combination of both. In this blog post I will give you some examples of several types of projects.

                Research integrity

                A project relating to research integrity is the Standard Operating Procedures for Research Integrity, or in short: SOPs4RI, because we like to work with acronyms. In the SOPs4RI project CWTS has conducted focus group interviews with researchers from several disciplines and other relevant stakeholders from the same areas of research who could provide information on Standard Operating Procedures and guidelines relating to research integrity. Most of the focus groups were conducted in the beginning of 2020 just before travelling restrictions were introduced because of COVID-19. However, some of the focus groups had to be held online, which was a challenge at first, and currently more qualitative research is taking place online.

                Responsible Research and Innovation (RRI)

                Projects that are currently running at CWTS and that relate to Responsible Research and Innovation (RRI) are Excellence in science and innovation for Europe by adopting the concept of RRI (NewHoRRIzon), Scientific Understanding and Provision of an Enhanced and Robust Monitoring System (SUPER_MoRRI) and Constructing Healthcare Environments through RRI and Entrepreneurship Strategies (CHERRIES). In February 2021 a new RRI-related project will start which is called RRI Policy Experimentations for Energy Transition (RIPEET). While NewHoRRIzon is working out the conceptual and operational basis to integrate RRI into European and national R&I practice and funding on a more general level, SUPER_MoRRI departs from the previous Monitoring the Evolution and Benefits of RRI (MoRRI) project to develop a monitoring system for RRI. CHERRIES and RIPEET are both looking at RRI in different themes (healthcare and energy respectively) at the regional level.

                Open Science

                Open Science is an important theme for CWTS as well. One of the projects that were performed in the past is the Open Science Monitor. In this project different methods, such as bibliometric analyses and interviews for case studies, were combined to track trends in open access and collaborative and transparent research across countries and disciplines.

                Variety of themes

                Of course, we also work on projects in which different themes are combined with multiple forms of research. An example of such a project is RISIS2 for which the A-team unifies organisations in a database. Furthermore, a RISIS Core Facility is being developed to provide an infrastructure for Science, Technology and Innovation studies. It will facilitate the collection of new data around the themes of public sector research, corporate innovation capabilities, R&I outputs and projects, policy learning, and academic careers.

                With the variety of projects CWTS is active in, it has always been very interesting for me to work at CWTS. The variety of themes and the different forms of research make every project distinct. Integrating the variety of themes and research methods in some of the projects can sometimes be a challenge because everyone has its own expertise. However, I think the expertise we have available at CWTS is very relevant and is even more relevant when we combine the variety of internal expertise we have when collaborating with external partners. Hopefully, CWTS keeps on enjoying working in the so-called institute projects. If you are interested in collaborating in a project with CWTS or in writing a research proposal together, feel free to reach out to us.

                ]]>
                Josephine Bergmans
                Skill gaps of PhD graduateshttps://www.leidenmadtrics.nl/articles/skill-gaps-of-phd-graduates2021-01-08T10:22:00+01:002024-05-16T23:20:47+02:00Based on our research, we discuss which gaps exist between the skills PhD graduates developed during their PhD and the skills that are required and valued in their current job. Which relevant skills do graduates bring to future jobs and which skills were underdeveloped during their PhD trajectory?Increasing numbers of doctoral graduates work outside academia. However, a PhD degree has been often regarded as the gateway to an academic career, which is also considered as the ‘default’ career for PhD graduates. In the same vein, careers outside academia are seen as ‘alternative careers’. Still, in many countries, more PhD graduates work outside academia than within academia. Therefore, you could argue that ‘alternative careers’ should not be called as such and that academic careers should be considered the alternative career option instead.

                As seen below, academia is still often seen as the default career path for PhD graduates by many academics and by PhD candidates themselves. This leads to PhD candidates being insufficiently prepared for a job search outside academia after obtaining their doctoral degree. This issue is recognized by various organizations within the university sector, for example by the League of European Research Universities (LERU).

                The schism between academia being seen as the default career for PhD graduates and the reality that many PhD graduates will work outside academia raises the question to what extent PhD trajectories offer the skills that are required for jobs outside academia. To study this, we surveyed 2,193 recently graduated PhDs from Dutch universities (who finished their PhD trajectories two to six years ago). The results of this study can be found in this pre-print.

                Skill gaps: largest gap in management and social skills

                We asked recently graduated PhD candidates to which extent they developed certain skills during their PhD trajectories and to which extent they need these in their current jobs. From this, we estimated the gaps there are between the acquired skills during one’s PhD and the skills in the current job. The figure below plots thirteen skills in terms of skill’s development during one’s doctoral education (averages on Y-axis) and requirements in one’s current job (averages on X-axis). A factor analysis indicated that skills could be clustered in three categories: scientific skills, independence skills, and management and social skills.

                Figure 1 Skill gaps adj

                Looking at the Y-axis, it can be seen that PhD graduates developed scientific knowledge, analytical thinking, and writing skills to the largest extent. Least developed skills were teamwork, social skills, and project management skills.

                The further away skills are located from the diagonal, the larger the skill gap becomes. A positive skill gap applies to skills above the diagonal, which means that those skills were developed to a larger extent than they are actually required in the current job. Below the diagonal are the skills that were developed to a smaller extent than they are required in the current job. The skill gap is rather small in scientific knowledge, analytical thinking, independence, learning ability, presentation skills, writing skills, and language acquisition skills. The largest skill gaps are found in teamwork, social skills, and project management skills. These were all underdeveloped compared to the skills needed in the current job.

                Skill gaps by sector: greatest outside academia but management and social skills also underdeveloped for academic jobs

                Next, we investigated whether skill gaps differ by sector of employment, as one may expect the different sectors where PhD graduates work to have different skill requirements. A similar plot was made for the three skill categories; this time by sector of employment: academia, non-academic R&D, and non-R&D. A technical explanation of the grouping of PhD graduates into the sectors can be found in an earlier paper (the link will take you to the relevant section in the paper).

                Figure 2 Skill gaps adj

                PhD graduates reported management and social skills to be particularly underdeveloped compared to the requirements of their current jobs. A comparison between the sectors of employment shows that this skill gap is larger in non-academic R&D than in academia. Still, what is interesting here is that the PhD trajectory also insufficiently prepared PhD graduates for working in academia in this respect. Therefore, (project) management and social skills remain insufficiently developed during PhDs.

                Independence skills were less underdeveloped in the non-R&D sector compared to both the non-academic R&D sector and academia sector. Finally, the largest ‘overdevelopment’ of skills concerned scientific skills development for PhD graduates working in non-R&D. This makes sense, as you would expect PhD graduates who are not involved in research or development in their current job to need their developed scientific skills less.

                What does this mean for PhD trajectories?

                Our findings corroborate other studies that show that skills such as teamwork and project management are vital in many jobs, both inside and outside academia. However, such skills are not sufficiently developed during doctoral education in the Netherlands.

                To improve employability of PhDs, PhD programs in the Netherlands should more explicitly highlight the multitude of skills possibly developed during PhDs and enable a broader career development. Another recommendation is to integrate a broader societal focus into PhD programs from the earliest stages; for example by organizing visits to companies working in relevant fields or by offering joint research projects in which PhD students work together with business and industry.

                Courses on transferable skills, for example the ones offered by Leiden University itself or those offered at other universities, may also help. Current PhD candidates may also enlist the help of professional career counselling, such as the counselling offered by their own universities, or other professionals tailoring their services to PhD candidates. In the Netherlands, these include (but are not limited to) Claartje van Sijl, Samula Mescher, Louter Promoveren, PhD Power and CDr Coaching*.

                International inspiration can be found on the blogs and Twitter profiles of From PhD to Life, Beyond the Professoriate, and Exploring Research Careers.

                Our study shows that a skill gap exists between doctoral education and the labour market in the Netherlands. While this gap is small for PhD graduates working in academia, it is more prominent for PhD graduates working outside academia. As this is the sector in which most PhD graduates will eventually work, there is a need to better align the training during PhD trajectories with the demands from the labour market.

                * The authors are not affiliated with any of the services mentioned in the blog post.

                ]]>
                Cathelijn WaaijerJulia HeuritschInge van der Weijden
                The changing logics of scientific publishinghttps://www.leidenmadtrics.nl/articles/the-changing-logics-of-scientific-publishing2021-01-04T14:12:00+01:002024-05-16T23:20:47+02:00The subscription model is taken over by the open-access model in scientific publishing industry, which may favor quantity over quality. While we should be aware of predatory practices by any journal, labeling journals as predatory may reinforce established hierarchies in the scientific community.With the advent of online publishing in the 2000s, the cost structure of scientific publishing changed drastically. Now, printing and distribution costs have become very low. This has not only lowered the entry cost of new publishers, but it also lifted the natural restriction on the number of papers per issue which provided a strong rationale for gate-keeping by legacy journals. At the same time, several repositories became available on the Internet with published papers and pre-prints, making these accessible to readers without subscription. Partly due to this, the subscription model is now slowly substituted by the open access model, often with author processing charges.

                In this turbulent context, many new journals have been introduced, both by incumbent publishers and new entrants. Some of these journals are considered predatory by one part of the academic community, pointing to high volumes of papers, low review standards and misleading soliciting. Indeed, as revenues of such journals rely solely on article processing charges, they may be tempted to follow a market logic of quantity over the professional logic of quality. Another part welcomes the many new open-access journals as it provides more opportunities for scholars in less-favored, peripheral positions as well as for new topics that are less readily accepted in other journals. What is more, the fast turn-around of papers helps the quick diffusion of results and insights, while their relatively low article processing charges promote inclusiveness.

                In this light, labeling particular journals as predatory assumes a binary world of 'good' and 'bad'. An alternative view is to acknowledge that there is a large 'grey area' of journals whose practices can be questioned, if only because most journals show little transparency about peer reviews, editorial policies and accept/reject decisions anyway. To illustrate this point, Siler analyzed 11,450 journals on the Cabells Journal Blacklist in terms of the varying degrees of predatory activity ranging from fake metrics and false addresses to sloppy copy-editing and poor webpages. The results show a clear continuum rather than a bi-modal distribution, questioning the binary opposition used by those who label (or some would say, stigmatize) journals as predatory.

                A further analysis of the economics underlying article processing charges shows that the authors fees are closely and positively related to quality indicators of journals. An analysis by Siler and Frenken of 12,127 Open Access journals showed that journals with status endowments (JIF, DOAJ Seal), articles written in English and published in wealthier regions are also relatively costlier. The recent announcement of Nature to charge 9,500 euro for open access is illustrative in this respect. This suggests that while open access journals have opened up the publishing system allowing many more papers to be published, the hierarchy of journals will most likely remain intact, as high-status journals can sustain their high rejection rates with high open access fees, further boosting the extreme profit margins of incumbent publishers.

                In all, one can conclude that the logics of scientific publishing are changing in complex ways, with economic logics becoming stronger and the types of journals becoming more diverse. Binary classifications of journals in ‘good’ and ‘bad’ may hide the heterogeneity of journal practices and complex author motives, and may also reinforce established hierarchies in the scientific community. At the same time, we should be aware of various forms of predatory practices, by new and incumbent publishers alike, and continue to foster a critical debate among us.

                ]]>
                Koen Frenken
                2020's last blog post... and a Christmas surprise!https://www.leidenmadtrics.nl/articles/2020s-last-blog-post-and-a-christmas-surprise2020-12-24T10:30:00+01:002024-05-16T23:20:47+02:00It's holiday time for Leiden Madtrics as well. We wish you all restful days off and are looking forward to seeing you again in the new year. In the meantime, have fun reading this blog post written by Ed Noyons about a very unique Christmas surprise taking place in the city of Utrecht.Ed utrecht car
                Greenwheels Red Christmas sleigh

                On the last Friday before Christmas of this ridiculous year 2020, I thought it would be a good idea to deliver the Christmas box personally to all CWTS staff living in the Utrecht area. Primarily to show our appreciation for their support for and contribution to CWTS during the year but also to satisfy my own need to meet my colleagues, however short, in person. So, there I was, on a Friday evening and Saturday morning, driving 75 kilometers, together with my wife Susanne in our Greenwheels Red Christmas sleigh from Nees to Inge to Tim to Bram to Sonia to Carole to Rinze to Guus to Gaston. It was great fun to do and nice to see (almost) all of them again.

                Collage final

                Happy holidays!

                ]]>
                Ed Noyons
                Q&A about Elsevier's decision to open its citationshttps://www.leidenmadtrics.nl/articles/q-a-about-elseviers-decision-to-open-its-citation2020-12-22T15:00:00+01:002024-05-16T23:20:47+02:00Last week Elsevier announced that it has signed the San Francisco Declaration on Research Assessment (DORA) and that it is going to make the reference lists of articles openly available in Crossref. In this Q&A, Ludo Waltman shares his perspective on Elsevier’s decision to open its citations.Why is it important that Elsevier is going to open its citations?

                Both DORA and the Initiative for Open Citations (I4OC) have called on publishers to make the reference lists of their articles openly available. In response to this, almost all large and medium-sized publishers have made their citations openly available in Crossref. Elsevier was one of the very few major publishers that have not yet opened their citations. With Elsevier’s decision to open its citations, hundreds of millions of citations will become openly available, closing a large gap in the openly available citation data in Crossref.

                Citation-based indicators play a prominent role in research evaluations. Responsible use of these indicators requires openness of the underlying citation data, so that the indicators are fully transparent and so that anyone can question the indicators and can even construct alternative ones. Elsevier’s decision to open its citations therefore represents a significant step toward more responsible use of citation-based indicators in research evaluations.

                Citation data is also highly valuable to support the discovery of scientific literature. Elsevier’s decision to open its citations can be expected to stimulate the development of innovative new discovery tools. Elsevier itself will also benefit from this, since the articles it publishes will be easier to find and as a result will attract more readers.

                Why has it taken so long for Elsevier to open its citations?

                The most important reason seems to be that Elsevier considered open citations to be a threat to its Scopus business. By keeping its citations closed, Elsevier used its strong position as a publisher to protect its Scopus business. The increasing pressure on Elsevier to support initiatives focused on promoting responsible research assessment (e.g., DORA) and open science (e.g., I4OC) has led to a change in its policy. While opening citations may indeed result in more competition for Scopus, it may also help Elsevier to shift its focus from monetizing data to providing value-added services, which in the longer term may be expected to be commercially more attractive.

                Have all citations now been opened?

                In January 2021, when Elsevier’s citations will be opened, the percentage of citations in Crossref that are open will increase from 60% to probably more than 90%. With Elsevier opening its citations, almost all large and medium-sized publishers that work with Crossref will have opened their citations. However, there are still a few exceptions. The largest one is IEEE, followed by the American Chemical Society (ACS) and the University of Chicago Press. Hopefully these publishers will now also change their policy and open their citations.

                What is the significance of Elsevier’s decision to open its citations in Crossref, given that Microsoft Academic already makes Elsevier citations openly available?

                By making large amounts of bibliographic metadata openly available, Microsoft Academic provides a great service to the scientific community. A platform such as the Lens, which relies strongly on data from Microsoft Academic, shows the value of this data. However, open availability of citations and other bibliographic metadata in Crossref has at least two additional advantages. First, Crossref has made a commitment to follow the Principles of Open Scholarly Infrastructure, which helps to ensure the long-term sustainability of its activities. Second, Microsoft Academic makes data available under an ODC-BY license, which requires Microsoft Academic to be acknowledged when the data is used. In contrast, Crossref considers the data it makes available to be facts and does not attach a license to it. Compared with data from Microsoft Academic, data from Crossref is therefore easier to reuse and easier to combine with data from other sources.

                How does Elsevier’s decision to open its citations affect commercial platforms such as Web of Science, Scopus, and Dimensions?

                The core data provided by these commercial platforms will increasingly also be openly available, making it more challenging for these platforms to monetize their data. However, at the moment these platforms still provide a significant amount of data that cannot easily be obtained from an open data source such as Crossref. Web of Science and Scopus for instance make data available for journals that do not work with Crossref. They also provide enriched data, for instance by disambiguating authors and institutions. In the longer term, the business models of Web of Science and Scopus can be expected to shift from providing data to offering value-added services on top of the data. There is still a lot of room for innovation in this area.

                The situation for Dimensions is similar, with one important difference. Dimensions combines Crossref data with data obtained from publishers. While the increasing open availability of data in Crossref may decrease the value of the data provided by Dimensions, it will also reduce Dimensions’ dependence on publishers, which may make it easier for Dimensions to maintain and expand its platform.

                What about open abstracts?

                By opening its citations, Elsevier supports the Initiative for Open Citations (I4OC). It does not yet support the Initiative for Open Abstracts (I4OA), which was launched earlier this year and which calls on publishers to make abstracts openly available in Crossref. Many publishers have already joined I4OA, including AAAS, BMJ, Cambridge University Press, F1000, Frontiers, Hindawi, MDPI, Oxford University Press, PLOS, PNAS, Royal Society, and SAGE. Elsevier still needs to take this step. Like citation data, abstracts play an important role in research evaluations, for instance to delineate the literature on specific research topics or in specific research areas (e.g., the sustainable development goals). A full commitment to promoting responsible research assessment therefore requires not just openness of citations but also of abstracts and other bibliographic metadata.

                Ludo Waltman is one of the founders of the Initiative for Open Abstracts (I4OA). In 2019 he resigned as Editor-in-Chief of Elsevier’s Journal of Informetrics, protesting against Elsevier’s unwillingness to open its citations.

                ]]>
                Ludo Waltman
                The causal intricacies of studying gender bias in sciencehttps://www.leidenmadtrics.nl/articles/the-causal-intricacies-of-studying-gender-bias-in-science2020-12-10T13:00:00+01:002024-05-16T23:20:47+02:00A recently published paper on the role of gender in mentorship in science has triggered a lot of debate. In this blog post, Vincent Traag and Ludo Waltman contribute to this debate by emphasizing the importance of understanding the underlying causal mechanisms.Science thrives on an open exchange of arguments and a plurality of perspectives. Scientific discussions should be open, frank and blind: only arguments should matter, not who presents them. Different viewpoints strengthen the scientific debate, and the inclusion of women and minorities in science will only contribute to this. Understanding the role of gender in science is crucial for improving the representation of women.

                A recent paper about the role of gender in mentorship finds that protégés with female mentors show a lower citation impact than protégés with male mentors. This paper, which we refer to as the mentorship paper in this blog post, has been received quite critically. There have even been calls to retract the paper, which in turn have been criticised as well, both on Twitter and elsewhere. Critics of the paper have raised a number of concerns, for example about the data and the operationalisation of the idea of mentorship. In this blog post, we discuss a different aspect of the paper, namely the challenge of identifying causal effects of gender. This is a major challenge not only for this specific paper, but also for many other studies on the role of gender in science.

                Inequality, disparity and bias

                Although many papers use the term “gender bias”, its meaning is not always clear. Instead of “gender bias”, some studies use the term “gender disparity”, while others employ “gender inequality”, “gender difference” or occasionally "gender gap". The different terms sometimes seem to be used interchangeably, making it unclear what researchers try to communicate with each term. To facilitate a clear discussion, we propose a more precise terminology. Such an improved terminology may contribute to a better understanding of the policy implications of a study. This is also relevant in the context of the above-mentioned mentorship paper.

                We propose to define a “gender inequality” or a “gender difference” simply as any observed difference between people with a different gender.

                Our proposal is to use the term “gender disparity” to refer to any difference between people with a different gender that is causally affected by their gender. This means that if a woman had been a man (or vice-versa), the outcome of interest would have been different.

                The strongest term is “gender bias”, which we propose to define as any difference between people with a different gender that is directly causally affected by their gender. Similar to a gender disparity, this means that if a woman had been a man, the outcome of interest would have been different. However, whereas a gender disparity may be the result of an indirect causal pathway from someone’s gender to a particular outcome, a gender bias is a direct causal effect.

                Figure 1. Example causal model. Gender causally affects the study programme, which causally affects acceptance. There is a gender bias in study choice, and a gender disparity in acceptance. If there is a direct causal effect of gender on acceptance (represented by the dashed line) there is a gender bias in acceptance.

                To clarify the distinction between a gender disparity and a gender bias, consider the example of being accepted at a prestigious university. Suppose that the acceptance rates for men and women are equal for each study programme, but that some study programmes have lower acceptance rates than others. If women apply more often for study programmes with lower acceptance rates, this results in a lower overall acceptance rate for women. In this case, there is a gender disparity in the overall acceptance rate. However, because the causal effect is mediated by study choice, this gender disparity should not be called a gender bias (see Figure 1). You may recognise this as an example of the famous Simpson’s Paradox, which actually took place in Berkeley in 1973. In contrast, suppose that a change in someone’s gender on an application form affects the acceptance decision. In that case, gender does have a direct effect on acceptance, which means there is a gender bias in acceptance rates.

                The distinction between gender inequalities, gender disparities and gender biases is important in discussions about interventions that aim to improve participation of women in science. In the case of a gender disparity or gender bias, there is a causal effect of gender on a particular outcome. This provides a clear rationale for considering to intervene somewhere in the system. The distinction between gender disparities and gender biases helps to determine where in the system an intervention seems more appropriate. To illustrate this, let us revisit the above example of being accepted at a prestigious university. If the effect of gender on acceptance rates is mediated by study choice, there is a gender bias in the choice of study programme, not in acceptance rates. Therefore, an intervention targeted at study choice (e.g., making certain study programmes more attractive for women) seems more reasonable than an intervention targeted directly at acceptance rates (e.g., imposing a minimum acceptance rate for women). Whether an intervention is desirable can still be debated, but the distinction between gender disparities and gender biases helps to clarify where in the system an intervention might best be considered.

                All gender disparities are also gender inequalities, but the opposite does not hold: not all gender inequalities are gender disparities. This complicates matters greatly in many studies, including the above-mentioned mentorship paper. The reason is a problem known as collider fallacy.

                Figure 2. Simplified causal model of the role of gender in science. Each arrow represents a direct causal effect of one factor on another. For example, talent has a direct effect on staying in academia in this model.

                Collider fallacy

                To illustrate the problem of collider fallacy, we consider a simple causal model describing mechanisms relevant to interpreting the above-mentioned mentorship paper (see Figure 2). In our model, someone’s research talent affects both the citations they receive and the likelihood of staying in academia. Independently of this, someone’s gender and the gender of their mentor also affects the likelihood of staying in academia. More specifically, we assume that having a female rather than a male mentor makes it more likely for a female protégé to stay in academia. In this causal model, there are multiple factors that affect the factor “staying in academia”, making it a collider for those factors.

                If we condition on the factor “staying in academia”, for example by controlling for it in a regression model, we introduce a correlation between the gender of the mentor and the research talent of the protégé. In our causal model, female protégés with male mentors are less likely to stay in academia, which means that those who do stay in academia can be expected to be more talented, on average, than their colleagues with female mentors. As a result, having female mentors is correlated with a lower research talent of protégés who stay in academia. Their lower research talent then in turn leads to fewer citations for those protégés. Importantly, however, this correlation does not reflect a causal effect. Instead, it is the result of conditioning on a collider. This example illustrates the problem of conditioning on colliders when studying causal effects. It leads to wrong conclusions.

                The problem, unfortunately, is even more daunting. When we collect data, we often use a variable to select the data to be collected. This effectively means that we control for this variable. If the variable acts as a collider, this leads to a collider fallacy. In the mentorship paper, the authors make a selection of the protégés included in the data collection: “we consider protégés who remain scientifically active after the completion of their mentorship period” (p. 2). In our causal model introduced above (see Figure 2), this selection of protégés results in a collider fallacy, leading to the observation that protégés with female mentors receive fewer citations. Depending on the extent to which our causal model captures the relevant causal mechanisms, the main result of the paper may be due to this collider fallacy.

                From observations to recommendations

                The possibility of a collider fallacy calls into question the policy recommendations made in the mentorship paper. The authors suggest that women should be paired with a male mentor because this has a positive effect on their citation impact. If the above causal model holds true, this suggestion is not correct. In this model, pairing a female protégé with a male mentor reduces the likelihood that the protégé stays in academia, which means that those protégés who do persevere in academia are likely to be more talented and to receive more citations. In our terminology: the difference between male and female mentors in the citations received by their protégés may be only a gender inequality, not a gender disparity and certainly not a gender bias. Without additional evidence or assumptions, the observed gender inequality does not support the policy recommendations made in the mentorship paper. In fact, given our conjectured causal model, it can be argued that one should do the opposite of what is suggested in the paper: to increase female participation in science, female protégés should be paired with female mentors.

                Although many eyes are now on the mentorship paper, the state of affairs in many other papers on gender differences in science is not necessarily better. In an excellent and comprehensive review of the literature on gender differences in science funding, the lack of causal knowledge was identified as a sore point. The literature regularly discusses gender inequalities, disparities and biases without having a clear causal framework, possibly leading to ill-conceived policy recommendations, which in some cases may actually hurt progress towards a better gender balance. We hope that our proposed definitions of gender inequality, gender disparity and gender bias contribute to an improved appreciation of the causal intricacies in studying the role of gender in science.

                As already mentioned, some calls have been made to retract the mentorship paper. We do not support such calls. The policy recommendations made in the paper may be incorrect and may even be harmful to the representation of women in science. However, discussions about the correct interpretation of analyses like the one reported in the mentorship paper are highly complex and usually do not lead to a clear-cut answer. Papers should be retracted in the case of factual mistakes or scientific misbehaviour. Retracting a paper because of disagreements about the interpretation of the findings would be deeply problematic. We should exchange arguments and discuss their merits in an open and honest debate. If we lose this, we are fighting a lost cause.

                ]]>
                Vincent TraagLudo Waltman
                Responsible Research & Innovation or Open Science - does the label matter?https://www.leidenmadtrics.nl/articles/responsible-research-innovation-or-open-science-does-the-label-matter2020-12-08T16:30:00+01:002024-05-16T23:20:47+02:00Here, we assert that Responsible Research and Innovation (RRI) and Open Science (OS) can be meaningfully compared as transformative change agendas for R&I. We propose looking for differences in terms of what motivates a transformative agenda, i.e. why do we need to open up the R&I system?RRI & OS: two co-existing sets of ambitions

                Responsible Research and Innovation (RRI) and Open Science (OS) are two co-existing sets of ambitions concerning systemic change in the research and innovation (R&I) system. Initially, RRI and OS may appear to align well. RRI aims to facilitate solutions to the grand challenges faced by society by bringing together a range of societal actors in an interactive, transparent, and responsive process. OS emphasises the role of information technology in enabling collaboration across disciplines and sectors needed to solve grand challenges. However, it is unclear whether RRI and OS are mutually supportive of the same ends. This has become a pressing issue for us as scholars engaged in RRI and OS projects. What does the co-existence of RRI and OS initiatives mean for those of us who study, offer advice on, and aim to be a key part of science-society dynamics? This is a difficult question to address. Both RRI and OS take different forms (e.g. research topics, policy frameworks, visions), implying that their precise meaning and rationales differ. However, we assert that RRI and OS can be meaningfully compared as transformative change agendas for R&I. We propose looking for differences in terms of what motivates a transformative agenda, i.e. why do we need to open up the R&I system?

                Two storylines

                In order to explore this question, we offer two storylines that account for the specific contexts and dynamics of RRI and OS. RRI emerged as a policy concept in 2011 with firm roots in various traditions that seek to enhance the integration of science and society, e.g. Technology Assessment, Ethical, Legal and Societal Aspects (ELSA), and anticipatory governance. RRI became an important innovation policy issue for a variety of R&I actors for myriad reasons: the need to orient new technologies toward societal challenges; the need to prevent adverse effects; and to establish public trust and confidence in the governance of R&I. RRI can be seen as a movement that emphasises normative aspects of the R&I system. OS is gaining increasing prominence at national and supranational levels, as seen, for example in the three strategic research priorities underlying current European Union R&I policy, namely Open Innovation, Open Science, and Open to the World (‘the 3 Os’). Open inquiry has long been at the heart of the scientific endeavour. Open Science calls for a further ‘opening up’ of the research process by extending the principle of openness to all aspects of the research process. OS is concerned with epistemic deficiencies and aims to develop new ICT platforms to ensure scientific capacity for societal needs.

                Comparing prescriptive actions for transformation

                At first glance, the transformative agendas of RRI and OS align in key areas, as seen, for instance in the emphasis on responsible conduct of research. RRI concerns opening up R&I processes to various stakeholders in transparent, open, and responsive dialogue about trajectories and priorities of development. OS can strengthen research integrity by diffusing knowledge at an earlier stage of the research process. Both RRI and OS have relevance for grand challenges also, although there are differences in emphasis. For RRI, the alignment with grand challenges is far more integral to its core logic and claims to relevance. OS, on the other hand, demonstrates relevance in its more general efforts to improve capacities in scientific activity.

                Engagement with publics and stakeholders

                Differences in prescriptions for ‘opening up’ become especially clear when examined in relation to topics that are of central importance to both. For instance, as regards engagement with publics and stakeholders, the emphasis in Open Science is on doability and the internal processes and structures of doing R&I. OS is researcher-driven, with the peer community the most important audience. OS is also driven by a more outward-looking focus, which can be expressed as an ambition to democratise research. RRI’s approach to opening up is broader, extending an invitation to publics to co-produce the aims and means of technical processes for greater alignment with public values. RRI reflects a view of societal voices and citizens as legitimate partners and beneficiaries of technology and knowledge, while one sees less of a symmetrical relationship between technical and experts and societal voices in OS. Thus, we see normative and pragmatic motivations for RRI and OS, respectively.

                Approaches to interdisciplinarity

                There are also differences with respect to approaches to interdisciplinarity prescribed by RRI and OS. RRI emphasises explorative methods and the inclusion of value judgements alongside epistemic and technical issues. In addition, the inclusion of non-experts is underpinned by normative justifications. Different Social Sciences and Humanities (SSH) disciplines and societal stakeholders are invited into the research process for different reasons. Thus, there is a clearly articulated role for SSH grounded in their specific areas of expertise. OS, on the other hand, promotes an agenda of digital research infrastructure that implies a call for a fundamental transformation of existing R&I systems. The focus here is on pragmatic questions regarding the construction of functional infrastructure. The emphasis is on reducing incommensurability between disciplines and data sets – in this sense, SSH’s critical capacities and explorative methodologies do not fit. Here again, we see a distinction between normative and pragmatic motivations, or desirability and doability.

                Where to next?

                Our comparison suggests that publics will, to a lesser degree, be invited to reflect systematically on the structural and long-term implications of R&I, under an OS focused research policy regime. Future efforts in OS, particularly in the area of citizen science, may benefit from building on RRI’s achievements in institutionalising participatory approaches to R&I, rather than abandoning them altogether. One could speculate that the instrumental focus of OS might allow the movement to converge more easily with political and institutional goals to attract investment and sustain its momentum as a policy tool than has been the case for RRI. But the question is: at what cost? What are the implications for 1) engagement (with respect to the kind of work SSH are being asked to do) and for 2) interdisciplinarity, i.e. for the terms and conditions of our participation?

                ]]>
                Clare Shelley-EganRune NydalMads Dahl Gjefsen
                Knowledge integration for societal challenges: from interdisciplinarity to research portfolio analysishttps://www.leidenmadtrics.nl/articles/knowledge-integration-for-societal-challenges-from-interdisciplinarity-to-research-portfolio-analysis2020-12-01T10:30:00+01:002024-05-16T23:20:47+02:00For research to address societal challenges, indicators of average degree of ‘interdisciplinarity’ are not relevant. Instead, we propose a portfolio approach to analyze knowledge integration as a systemic process; in particular, the directions, diversity and synergies of research trajectories.‘Convergence’ as knowledge integration for grappling with societal challenges

                Last October the US National Academies held a workshop (available here) to gather views on how to better measure and assess the implications of interdisciplinarity, or convergence, for research and innovation. The use of the term convergence as a synonym of interdisciplinarity followed from two previous reports by the National Academies (2014 and 2019). These reports understood convergence as the ‘integrationof knowledge and ways of thinking to tackle complex challengesand achieve new and innovative solutions that could not otherwise be obtained.’ (A discourse that echoes European discourse on interdisciplinarity for grand challenges and missions.)

                In this blog, I will summarise the argument I put forward in the workshop: that for mapping progress towards this goal (that is: the successful knowledge integration for addressing a given societal challenge), we should conduct multidimensional portfolio analyses on the types of knowledge to be integrated rather than produce synthetic indicators of interdisciplinarity.

                For two main reasons. First, since knowledge integration for societal challenges is a systemic and dynamic process, we need broad and plural perspectives and therefore we should use a battery of analytical tools, as developed for example in research portfolio analysis, rather than a narrow focus on interdisciplinarity. The second reason is that while interdisciplinarity is one (but not the only) of the relevant concepts in knowledge integration, the concept of interdisciplinarity is too ambiguous, diverse and contextual to be captured by traditional indicators, as discussed in a previous blog.

                Fostering plural innovation pathways in the face of uncertainty and ambiguity

                It has long been argued that addressing societal challenges, such as climate change or COVID-19, benefits from the combination of disparate types of knowledge. Societal challenges are ‘wicked’ problems, in the sense that the framings of both the problems and the solutions are complex, disputed and uncertain.

                Under these conditions of ambiguity and uncertainty, research contributions are likely to come from combinations of diverse types of knowledge (or ways of knowing). This is: diversity within projects is needed. However, diversity across projects is also necessary. Since we do not know or even agree in advance on what types of expertise are appropriate to tackle a given problem, it is also important to have a plurality of research trajectories. Take the example of malaria: in spite of decades of efforts to develop drugs or vaccines, the most successful strategies so far have been fighting mosquitoes that transmit it, in particular with insecticide-treated bed nets.

                Therefore, rather than just aiming at fostering a ‘melting pot’ of disciplines, research systems should also produce a high number of disparate research trajectories – knowing that only some of them will ever be technically successful.

                Moreover, different research and innovation pathways are not equally desirable from a public value perspective – directionality matters. Some solutions are more socially preferable than others depending on their effects on public goods such as equity or environmental sustainability. Which means that public investment, while keeping a diverse portfolio of research strategies, should favour those which are perceived as more socially robust and relatively underfunded by the private sector.

                In summary, policy for S&T convergence should aim at fostering systemic diversity, rather than interdisciplinarity in every single project or program, but it should also take into account the preferred research directions in particular contexts or societies.

                Figure 1. Comparison of the focus of rice research in India and the US (2000-2012). Red areas indicate areas of high density of publications. From Ciarli and Rafols (2019)

                From ‘measuring’ interdisciplinarity to multi-level mapping of knowledge integration

                Measurement approaches to convergence should reflect this turn towards a systemic perspective on knowledge integration for societal challenges.

                This shift in the conceptualisation of S&T indicators from individual to systemic properties is similar to the shift in biology towards ecological approaches. The forest should not be measured by the average size of its trees or the timber it yields (scalars), but by the distribution (vectors) of all types of species and how they interact (matrices). Because the wealth, in sustainable terms, that can be derived from the forest comes from this diversity: water resources, herbs and mushrooms that unexpectedly yield nutritional or pharmacological benefits, spaces for leisure and well-being, etcetera.

                Similarly, the ‘solutions’ to societal challenges will not emanate from 1,000 labs with the same combination of disciplines, but from labs of various epistemic combinations and social embeddings. Therefore, our measurement should not focus on an average degree of interdisciplinarity. Instead, it should focus on mapping the directions and diversity of research approaches. To do this, we need to shift towards statistical descriptions of the vectors and distributions of research trajectories over knowledge landscapes. A framing in terms of research portfolios can help conduct this type of analyses.

                Portfolio analysis: exploring directions, diversity and synergies

                In a nutshell, the key idea is that for a given societal issue, the contribution of research should be explored by mapping the relevant types of knowledge over a research landscape (e.g. see obesity). The portfolio or repertoire of a given laboratory, university or territory, can then be visualised by projecting (overlaying) their activities of this research landscape, as illustrated in the figure above for ‘rice research’ (or avian flu).

                First, this portfolio provides us with information on the main directions that the research on a given topic is taking – which is pointing to the type of solutions envisaged for a grand challenge. For example, in the example in the figure above on rice, if the focus is related to genomics, mainstream research investments can be expected to deliver via Genetically Modified seeds (the case of the US). But if the focus is in fertilizers and yields (the case of India), the main goal is to increase productivity.

                Second, the portfolio can tell us about the diversity of research efforts, i.e. whether investments are heavily concentrated in a few areas, or distributed across a variety of fields. In the face of uncertainty and contested views on preferred innovation pathways (e.g. in renewable energies), one would expect a variety of pathways to be supported. This way the bets are hedged against unexpected scientific results or social reactions to certain approaches. Indicators of interdisciplinarity provide a view of the epistemic diversity in specific projects, labs or centres. This is a valuable but only a partial perspective of the research landscape.

                Third, by analysing the interrelations between innovation areas, a portfolio approach helps think about the synergies or lack thereof across research pathways. For example, in a portfolio of energy technologies, solar cells and small wind turbines have positive synergies as they both fit with distributed electricity infrastructure, while they have negative synergy with nuclear energy which needs centralisation. Understanding these positive or negative relations is important in balancing portfolios.

                From ‘atomistic’ to systemic and dynamic descriptions

                In summary, since social contributions are multifaceted, the analysis of research for societal challenges needs to adopt systemic perspectives, and thus take multidimensional forms. Research portfolio analysis offers a battery of tools, among other possibilities of exploring systemic properties of a research landscape. While interdisciplinary research is paramount in certain points, it is not required across the whole landscape. Therefore, rather than indicators of aggregates or averages, we need rich description of knowledge landscapes including the directions, diversity and synergies of research trajectories.

                ]]>
                Ismael Rafolshttps://orcid.org/0000-0002-6527-7778
                On 'measuring' interdisciplinarity: from indicators to indicatinghttps://www.leidenmadtrics.nl/articles/on-measuring-interdisciplinarity-from-indicators-to-indicating2020-11-30T10:28:00+01:002024-05-16T23:20:47+02:00Indicators of interdisciplinarity are increasingly requested. Yet efforts to make aggregate indicators have failed due to the diversity and ambiguity of understandings of interdisciplinarity. Instead of universal indicators, we propose a contextualised process of indicating interdisciplinarity.Interdisciplinary research for addressing societal problems

                In this blog I will share some thoughts developed for and during a fantastic workshop (available here) held last October by the US National Academies to help the National Science Foundation (NSF) set an agenda on how to better measure and assess the implications of interdisciplinarity (or convergence) for research and innovation. The event showed that interdisciplinarity is becoming more prominent in the face of increasing demands for science to address societal challenges. Thus, policy makers across the globe are asking for methods and indicators to monitor and assess interdisciplinary research: where it is located, how it evolves, how it supports innovation.

                Yet the wide diversity of (sometimes divergent) presentations in the workshop supported the view that policy notions of interdisciplinarity are too diverse and too complex to be encapsulated in a few universal indicators. Therefore, I argue here that strategies to assess interdisciplinarity should be radically reframed – away from traditional statistics towards contextualised approaches. Thus, I suggest to follow recent publications in proposing two different, but complementary, shifts:

                From indicators to indicating:

                • An assessment of specific interdisciplinary projects or programs for indicating where and how interdisciplinarity develops as a process, given the particular understandings relevant for the specific policy goals.

                From interdisciplinarity to knowledge portfolios:

                • An exploration of research landscapes for addressing societal challenges using a portfolio analysis approach, i.e. based on mapping of the distribution of knowledge and the variety of pathways that may contribute to solving a societal issue – interdisciplinarity.

                Both strategies reflect the notion of directionality in research and innovation, which is gaining hold in policy. Namely, in order to value intellectual and social contributions of research, analyses need to go beyond quantity (scalars: unidimensional indicators) and to take into account the orientations of the research contents (vectors: indicating and distributions).

                The failure of universal indicators of interdisciplinarity

                In the last decade, there have been multiple attempts to come up with universal indicators based on bibliometric data. For example, in the US, the 2010 Science & Engineers Indicators (p. 5-35) reported a study commissioned by the NSF to SRI International which concluded that it was premature ‘to identify one or a small set of indicators or measures of interdisciplinary research… in part, because of a lack of understanding of how current attempts to measure conform to the actual process and practice of interdisciplinary research’.

                In 2015, the UK research councils commissioned two independent reports to assess and compare the overall degree of interdisciplinarity across countries. The Elsevier report produced the unforeseen result that China and Brazil were more interdisciplinary than the UK or the US – which I interpret as an artefact of unconventional (rather than interdisciplinary) citation patterns of ‘emergent’ countries. A Digital Science report, with a more reflective and multiple perspective approach, was interestingly titled: ‘Interdisciplinary Research: Do We Know What We Are Measuring?’ and concluded that:

                Wang and Schneider, in a quantitative literature review ‘corroborate[d] recent claims that the current measurements of interdisciplinarity in science studies are both confusing and unsatisfying’ and thus ‘question[ed] the validity of current measures and argue[d] that we do not need more of the same, but rather something different in order to be able to measure the multidimensional and complex construct of interdisciplinarity’.

                Figure 1. A heatmap depicting the correlation across a battery of measures of interdisciplinarity. The differences show that there are many measures that are not in agreement (in orange and red). Source: Wang and Schneider (2020)

                A broader review on evaluations of interdisciplinarity by Laursen and colleagues also found a striking variety of approaches (and indicators) depending on the contexts, purpose and criteria of the assessment. They highlighted a lack of ‘rigorous evaluative reasoning’, i.e. insufficient clarity on how criteria behind indicators relate to the intended goals of interdisciplinarity.

                These critiques do not mean that one should disregard and mistrust the many studies of interdisciplinarity that use indicators in sensible and useful ways. The critiques point out that the methods are not stable or robust enough, or that they only illuminate a particular aspect. Therefore, they are valuable but only for specific contexts or purposes.

                In summary, the failed policy reports and the findings of scholarly reviews suggest that universal indicators of interdisciplinarity cannot be meaningfully developed and that, instead, we should switch to radically different analytical approaches. These results are rather humbling for people like myself who worked on methods for ‘measuring’ interdisciplinarity for many years. Yet they are consistent with critiques to conventional scientometrics and efforts towards methods for ‘opening up’ evaluation, as discussed, for example, in ‘Indicators in the wild’.

                From indicators to indicating of interdisciplinarity

                Does it make sense, then, to try to assess the degree of interdisciplinarity? Yes, it may make sense as far as the evaluators or policy makers are specific about the purpose, the contexts and the particular understandings of interdisciplinarity that are meaningful in a given project. This means stepping out of the traditional statistical comfort zone and interacting with relevant stakeholders (scientists and knowledge users) about what type of knowledge combinations make valuable contributions –acknowledging that actors may differ in their understandings.

                Making a virtue out of necessity, Marres and De Rijcke highlight that the ambiguity and situated nature of interdisciplinarity allow for ‘interesting opportunities to redefine, reconstruct, or reinvent the use of indicators’, and propose a participatory, abductive, interactive approach to indicator development. In opening up in this way the processes of measurement, they bring about a leap in framing: from indicators (as closed outputs) to indicating (as an open process).

                Marres and De Rijcke’s proposal may not come as a surprise to project evaluators, who are used to choosing indicators only after situating the evaluation and choosing relevant frames and criteria – i.e., in fact evaluators are used to indicating. But this approach means that aggregated or averaged measures are unlikely to be meaningful.

                In an ensuing blog, I will argue, however, that in order to reflect on knowledge integration to address societal challenges, we should shift from a narrow focus on interdisciplinarity towards broader explorations of research portfolios.

                Header image: "Kaleidoscope" by H. Pellikka is licensed under CC BY-SA 3.0.

                ]]>
                Ismael Rafolshttps://orcid.org/0000-0002-6527-7778
                Is there a typical journal article in the field of science and technology studies?https://www.leidenmadtrics.nl/articles/is-there-a-typical-journal-article-in-the-field-of-science-and-technology-studies2020-11-25T10:55:00+01:002024-05-16T23:20:47+02:00An intermediary report from an ongoing research project to study the co-evolution of publishing practices and intellectual debates in the field of science and technology studies.When Wolfgang Kaltenbrunner, a researcher at Leiden University’s Centre for Science and Technology Studies, stumbled upon the Twitter feed STS Title Bot, he was immediately struck by its creativity and effortless verisimilitude. Despite being generated by an automated algorithm that has apparently been fed with data obtained through text mining, many titles could easily pass for actual publications in major STS journals. Browsing the recent inventions of the algorithm, one comes across such fictional publications as “Waste in the 21st century: (re-)classifying materiality, exploration and experiment” or “What is a bridge? Engaged circulations for (re-)negotiating movements”.

                The disconcerting familiarity of these titles raised an interesting question: is there such a thing as a typical STS journal article whose very conventionality is a precondition for the effectiveness of the algorithm? Luckily, Wolfgang is working on a research project that could attempt a partial answer to this question, and apparently in the affirmative: a typical STS journal article is approximately 20 pages in length, has 50-60 references, and mostly cites journals indexed in Web of Science. The typical article attempts, moreover, to coin a new concept, one that is connected to the foundational STS literature but usually does not challenge this literature in a significant way, and draws on an in-depth, often ethnographic, case study.

                These findings come out of a research project entitled “Changing landscape of academic publishing and its impact on interdisciplinary social science fields: The case of science & technology studies (STS),” funded by the Social Sciences and Humanities Research Council of Canada (SSHRC). Led by Kean Birch, a professor at York University, and with Kaltenbrunner as co-PI, the team moreover includes Thed van Leeuwen, another researcher at Leiden University, and Maria Amuchastegui, a graduate student at York University.

                In addition to identifying a typical journal article, the ongoing research project seeks to discern how such a standardized format has emerged, and what implications it might have for the content of the research published in STS journals.

                The research team are using multiple methods, including both scientometric approaches and interviews with 76 editors, editorial board members, authors, referees, and publishers associated with seven general STS journals. The informants come from around the world, primarily Europe and North America, but also Asia and Latin America, and are from different career stages. The research team also conducted a scientometric analysis of STS journal articles, focusing on both metadata and content.

                So far, the metadata analysis has revealed several trends across a wider array of STS journals. First, it documents the growing importance of the Web of Science for scholarly communication in STS. The sheer volume of journal articles published has significantly increased in the last three decades, with two particularly pronounced upticks in the late 1990s and another in the late 2000s. Moreover, articles in the 1990s cited a significant diversity of types of publications, from monographs to edited volumes to articles in non-indexed journals. As of 2015, however, STS journal articles in the Web of Science predominantly refer to other articles of the same type, thus emphasizing the growing importance of the Web of Science for scholarly communication in STS.

                Interestingly, the metadata analysis also shows that the article format gradually standardized. In the 1980s, there was much variance in page length and number of citations. Many journal issues contain shorter conceptual essays, position papers, and conference reports alongside very long empirical research articles of 60-70 pages, sometimes even split into multiple parts. Starting in the late 1990s, however, the amount of variance decreased, and a standard format with the previously mentioned characteristics began to emerge, converging at around 20 pages and 50-60 references.

                A preliminary analysis of the interview transcripts gives additional hints at the epistemic shifts that have accompanied formal standardization. For example, in the 1980s and early 1990s, in line with the zeitgeist of postmodern literary theory, emphatically ironic writing, use of polyphonic narration, and other forms of experimentation with format were common. Nowadays, authors aim for more standard prose, a stylistic shift that may reflect the imperative to be cited. Several interview subjects noted, moreover, that nowadays there seem to be fewer “big ideas”.

                What prompted these changes in STS publishing? One hypothesis is that the standardization of the journal article should be seen as the emergent result of a confluence of broader dynamics. On one hand, publishing companies trying to streamline the production of journal articles to lower marginal cost; and on the other, attempts by scholars to approach their research practice as an epistemic economy of scale, geared to manage various constraints and uncertainties in the daily conduct or research – for example related to funding, evaluation, collaboration, and the differentiation and growth of STS as a field.

                What are the next steps in the project? The team is currently undertaking a fine-grained content analysis of the general STS journals covering 30 years of STS publishing (1990-2019). The following seven journals were included in the content dataset: Social Studies of Science; Science, Technology and Human Values; Science as Culture; Science and Technology Studies; Social Epistemology; East Asian Science and Technology Studies; and Engaging STS. To create the dataset, Maria Amuchastegui has written a custom Python script to scrape the contents from the PDFs and identify new epistemic concepts that have emerged in the STS literature. Combined with the material already collected, this will hopefully allow for a detailed understanding of the co-evolution of epistemic debates in a scholarly community and the publishing practices it simultaneously cultivates.

                ]]>
                Maria AmuchasteguiWolfgang KaltenbrunnerKean Birch
                The unintended consequences of task specialization in research careershttps://www.leidenmadtrics.nl/articles/the-unintended-consequences-of-task-specialization-in-research-careers2020-11-23T09:00:00+01:002024-05-16T23:20:47+02:00Researchers collaborate specializing in specific tasks. However, the research evaluation system only rewards specific profiles of researchers, threatening the diversity of the science ecosystem.In this blog post we discuss recent findings on the relation between career trajectories and task specialization. Research careers are commonly envisioned in evaluation schemes as homogeneous pathways in which individuals have to take a series of steps to advance. In each of these steps, researchers must comply with certain expectations, usually so embedded into our way of thinking of scientists that many countries and supranational agencies even explicitly address what is expected of individuals at each stage. The rationale behind this is to ensure that career paths align with academic positions, and describe the whole process from apprentice to colleague.

                Examples of such simplified vision of research careers can be found for instance in the Research Profiles defined by the European Commission (Figure 1), in which four stages are defined along with the expectations and requirements needed to reach each of them. In the description of such profiles words such as excellence and leadership are common, in many cases even used as interchangeable, sending the message that a hierarchical structure is expected in research teams, and that this hierarchical structure is directly linked to seniority. But one might question to what extent those expectations match reality. Is there such a strong link between career stages and researcher profiles? And what happens when researchers deviate from such expected roles?

                In this post we discuss our findings after designing a model based on a machine learning algorithm to predict the probability of scientists to contribute in specific ways over their complete career, based on the contribution statements of a seed of their publications. Based on our predictions we were able to identify different archetypes of researchers across career stages. We distinguished between four career stages and compared differences between archetypes of researchers based on their career length, productivity, citation impact and gender. We observed differences on career length based on the archetype, plus gender differences on the type of profile researchers have at their early-career.


                Figure 1.
                Graphical representation of the career stages designed by the European Commission along with the expectations at each state, and an attempt at aligning them in a timeline.

                Distribution of labour and archetypes

                There is increasing evidence that scientists tend to specialize on specific tasks during their career in order to be more efficient when collaborating to distribute the work among co-authors. Authors’ contribution to publications is commonly associated with their position in author order, signaling middle positions as those conducting more technical and specialised (e.g., applying advanced methodologies) tasks, while first and last positions are commonly reserved to those leading the work. Of course, if the unique career path ideal resembles reality, one would expect junior scientists to be earning their stripes first in middle positions and contributing with technical expertise and later on moving towards leading roles. But in a recent study published in PNAS, the authors suggested that there is an increasing number of middle authors who never reach these leading positions, and furthermore, that their presence is crucial to ensure scientific progress. But, is their middle position related to task specialisation as they seemed to imply?

                To answer this question, we trained a prediction model using a dataset of over 70,000 publications from PLOS journals (all data has been made openly accessible). This model used bibliographic and bibliometric variables to predict the probability of a given author to conduct a given contribution. We then retrieved the complete publication history of over 200,000 researchers from the original dataset, and predicted the probability of contributions for each paper and author. Figure 2 shows the distribution of our predicted probabilities distinguished by the career stage in which researchers conduct each contribution.

                Figure 2. Distribution of predicted probabilities of contributions for the complete history of researchers.

                Just from inspecting these distributions, we do observe that some contributions are indeed more aligned with career stages than others, but that such distinction is not as clear as one would imagine. Still, we are not able to discern if individuals consistently carry on the same contributions when collaborating.

                This is where we used Robust Archetypal Analysis, a technique that identifies archetypes, which accentuates specific features of individuals’ population. To our surprise we found consistent similarities between archetypes across stages, with two archetypes at the junior stage (specialized and supporting), three at the early- and mid-career stages (leader, specialized and supporting), and two at the late-career stage (leader and supporting). Leader profiles are characterized by high probabilities on writing the paper and conceiving and designing the study. Specialized archetypes are researchers who are in charge of performing experiments, but also may play a role on the writing, conception of the study and analysis of data. Finally, supporting authors conduct more marginal contributions to papers.

                Career trajectories, productivity, impact and gender

                The archetypal analysis provides evidence that scientists specialize on specific tasks during their careers, but do they exhibit the same profile during their whole trajectory? Are there differences in their performance? Do we observe differences by gender on the profile of scientists? To answer these questions, an archetype was assigned to each researcher, at each career stage, and the trajectories of archetypes inspected. Figure 3 shows these flows. The first thing we notice is that a researcher’s profile seems to influence their possibility of making it to the next stage. A larger share of leaders make it to the next stage, followed by specialized and last, supporting. Furthermore, leader profiles seem to be more versatile than the rest, that is, they seem to more easily shift from the leading profile to any of the other two.


                Figure 3.
                Trajectories of scientists analyzed by archetype. Blue shows the specialized profile; green, supporting; and red, leader.

                In terms of productivity and citations however, leaders and supporters show a better performance than specialists. This means that evaluation based on productivity and citation metrics may be undermining specific and indeed valuable profiles of researchers. But most worryingly, we find that there are gender differences at the early-career stage. That is, most male scientists at this stage show either a specialized or leader profile, while for women there is a strong bias towards the former. At this critical stage, this could be affecting women’s career prospects in a definite way, as their performance is hindered by the type of tasks they perform, as our results suggest.

                Revising assumptions and looking forward

                This study is part of the ‘Unveiling the Ecosystem of Science’ project, in which we aim to systematically analyze the diversity of profiles in science, with the hope of devising methodological tools that can improve current evaluation systems. With this specific study we also look into the potential of surpassing the well-known limitations of authorship by going beyond equal attribution of credit among authors. An example of this can be observed in Figure 4, where we look at the share of scientists by archetype and career stage publishing either as first, middle or last author. Here we observe that neither seniority nor archetype are always the ruling criteria as normally assumed.

                Figure 4. Share of scientists by career stage and archetype based on their author order in publications.

                With this study we hope to continue the conversation into looking at diversity in science. How to design tools that can improve our understanding of this diversity, and design evaluation tools that can contribute to maximize efforts and ensure an hospitable work environment for researchers. We need to ensure that evaluations do not add constraints and stress that can destabilize the ecosystem of science. Narrow definitions of excellence and poorly designed research careers, not only work against the progress of science, but affect attitudes towards success and failure, as it “generate(s) hubris and anxiety among the winners and humiliation and resentment among the losers”.

                ]]>
                Nicolás Robinson-GarcíaRodrigo Costashttps://orcid.org/0000-0002-7465-6462Cassidy R. SugimotoVincent LarivièreTina Nane
                How important are bibliometrics in academic recruitment processes?https://www.leidenmadtrics.nl/articles/how-important-are-bibliometrics-in-academic-recruitment-processes2020-11-20T11:33:00+01:002024-05-16T23:20:47+02:00In a newly published paper in Minerva I have analyzed confidential reports from professor recruitments in four disciplines at the University of Oslo. In the paper I show how bibliometrics are used as a screening tool and not as a replacement for more traditional qualitative evaluation of candidates.The use of metrics is a hot topic in science, and scholars have criticized metrics for being more driven by data than by judgements. Both the Leiden Manifesto and the DORA-declaration, signed by thousands of organizations and individuals, have expressed concerns about the use of metrics on individuals. Despite the critique metrics are used in academic hiring processes which represent critical junctures for academics deciding on their future careers. Although metrics are used in academic recruitment processes, there are few studies on how and with which importance they are used, and whether metrics have replaced or only supplemented the more traditional qualitative candidate evaluation. In a newly published paper in Minerva I cover this research gap and show how metrics are applied chiefly as a screening tool to decrease the number of eligible candidates and not as a replacement for peer review.

                The lack of knowledge of how metrics are used in recruitments could partly be due to the secrecy of these processes, where what happens is often highly confidential. However, with access to confidential documents from 57 professor recruitments in sociology, physics, informatics and economics between 2000 and 2017 at the University of Oslo, I was able to explore these black boxes. Going beyond more superficial accounts of whether metrics were used or not, I could unpack the evaluation of candidates and explore how metrics were used. With content analysis in NVivo I identified which criteria were used, when these criteria were used and how important they were for the ranking of the candidates.

                These documents showed that research experience was the most important criterion in recruitment processes, while the candidates’ teaching and dissemination experience were less valued. In these evaluations, metrics of research output were an important criterion but seldom the most important one. Contrary to the literature suggesting an escalation of metrics in academic recruitment, I instead detected foremost stable assessment practices with only a modestly increased reliance on metrics. Furthermore, paying attention to the candidate’s volume of publications is no entirely new phenomena either, but has been a practice throughout the time period observed in my study. Still, I found a moderate increased reliance on metrics in these evaluations.

                In the evaluation of candidates bibliometric indicators were primarily applied as a screening tool to reduce high numbers of candidates and not as a replacement of the qualitative peer review of the candidates’ work. It is quite understandable that when universities receive applications by, e.g., over 40 candidates, they are not capable of evaluating them all but need to decrease the number of candidates for more thorough evaluations. Here, bibliometrics have proved to be a useful screening tool.

                In the figure below I display the most important criteria used in the three different committees which the Norwegian academic recruitment processes consisted of. While metrics were the most important criteria in the selection committees, whose task it is to select eligible candidates, they were inferior when it came to the in-depth reading of the candidates’ work in the expert committees. Here, tenured professors evaluated the candidates according to disciplinary standards. Moreover, in the last stage of the recruitment process, when interviewing the highest ranked candidate, metrics were neglected as the focus for these interviews was to evaluate the candidates’ teaching experience and their social skills.

                Figure 1 IR
                Figure 1. Most important criterion in the three different committee types (percentage). N refers to the number of the most important assessment criterion/a in the different committees

                The use of metrics was also strongly dependent on the evaluation cultures of different disciplines. In sociology, the evaluators’ in-depth reading of the candidates’ work was still the most important, and in physics and informatics having the specific skills announced in the call was more important than having impressive publication lists. However, economics was an exception, where the number of top publications proved to be the most salient criterion. The next figure shows the most important criteria in the expert committee, where tenured professors evaluated the candidates.

                Figure 2 IR
                Figure 2. Most important assessment criteria in the expert committees by academic discipline (percentage). N refers to the number of important assessment criterion/a detected in the expert committee

                The disciplines further relied on different types of metrics. Social sciences chiefly emphasized publication volumes and journal quality, while the natural sciences relied more strongly on various metrics such as the number of publications, citation scores and the number of conference proceedings. Figure 3 shows how often the different types of metrics were applied by the expert committees.

                Figure 3 IR
                Figure 3. Metrics types applied by expert committees in each discipline (percentage). N refers to the number of arguments coded as metrics in the expert committee

                My study thus reveals a more nuanced view of the use of metrics in the evaluation of individual researchers. Even though metrics are used in academic recruitments, this does not imply a fundamental change of these processes where metrics have overruled traditional peer reviews. Instead, the Norwegian case could hint to a moderate use of metrics, as for instance as a screening tool.

                Nevertheless, although the use of metrics was moderate, I have not investigated whether the first screening process eliminated only irrelevant candidates or if the screening also excluded highly qualified candidates. Nor have I investigated more indirect effect, for example if the awareness of this screening makes researchers follow ideas where the prospect of publication in high ranked journals seems more likely. I thus encourage scholars to more closely study the effect of the use of metrics.

                ]]>
                Ingvild Reymert
                Do not assess books by their publishershttps://www.leidenmadtrics.nl/articles/do-not-assess-books-by-their-publishers2020-11-18T10:30:00+01:002024-05-16T23:20:47+02:00In my PhD research, I investigate the practicalities of the evaluation of scholarly book outputs across countries. In this blog post, I discuss the inconsistencies I discovered in judgements about publishers. I also propose a model for future evaluation of scholarly books.As my latest research reveals, the prestige of a book publisher yields points for getting government funding, not only in my home country Lithuania, but also in Denmark, Finland, Norway, and other countries. In these countries, institutions earn the maximum number of points for books issued by publishers ranked at the highest level, fewer points for books produced by publishers lingering at the entry level, and nothing when publishers do not qualify to enter the system.

                In Lithuania, the decision whether a publisher is prestigious or not depends on the opinion of anonymous experts who assess physically submitted books. The prestige of a publisher is especially important for monographs in the sciences. Since only books published by prestigious (and only foreign) publishers earn a significant number of points (and funds), nothing is achieved if the experts decide that a publisher is not prestigious. It seems that nobody knows why some publishers were awarded the prestigious level in one year and designated as not prestigious in subsequent years, or the other way around.

                Hunting for points, trickling down incentives, and gaming the system

                As stated in the Norwegian Publication Indicator and elsewhere, the levels of publishers were created to incentivise researchers to publish their books in the most prestigious channels within their field of study.

                People respond to incentives differently. Nonetheless, such rankings of publishers and institutional strategies to achieve more funds have led to hunting for points, trickling down incentives, and gaming the system. The more ambiguous the rules that are in place, the more prevalent gaming becomes.

                My findings suggest that it is difficult to reach a common understanding of what it means to be a prestigious publisher.

                Are publishers rated consistently across countries and over time?

                Experts in different countries may have contradictory opinions on the prestige of a publisher. Figure 1 shows that the same publisher may be ranked as prestigious in Lithuania, as basic in Finland, and as not qualifying for points in Denmark and Norway. Consequently, depending on the country, books from the same publisher may yield the maximum, minimum, or zero points.

                Even in a specific country, the level achieved by a publisher may fluctuate over time. As shown in Figure 1, Cambridge Scholars Publishing had the basic level between 2005 and 2018 in Norway; in the beginning of this period, it covered a quarter of all national book outputs in the social sciences and humanities. The publisher lost the basic level in 2019. There are no apparent reasons which explain this change in the Norwegian Registry. Interestingly, the publisher regained its prior status in 2020.

                Figure 1. The same publisher is ranked differently across countries and over time
                (data updated on 16 November 2020)

                Cambridge Scholars Publishing is only one of the examples included in my recent paper, which examines not only the prestige of publishers but also the minimum requirements set for publishers.

                As my findings suggest, there is no straightforward way to verify if a book publisher complies with the minimum mandatory prerequisites (displayed in the left part of Figure 2).

                An alternative approach to book assessment

                As seen from Figure 2, the current rankings of book publishers are focused mostly on publishers’ gatekeeping. The current national regulations usually do not set prerequisites on publishers’ contributions to the dissemination of academic research and scholarship.

                My proposal is to start with the idea that there are several essential stages in scholarly book publishing: quality control, production, dissemination (along with archiving), and marketing of books. However, publishers do not contribute equally to each of these steps. But every stage is vital for the quality of book outputs from the perspectives of research evaluation and scholarly communication.

                Figure 2. The current model for publisher evaluation and an alternative model
                proposed for assessment of scholarly books.

                My idea is that publishers may decide which services they want to offer in each step but that they need to be transparent by providing data on the services they have delivered. It would be best if publishers give the relevant information as metadata for every book they publish (e.g. along with the ISBN of the book). Ideally, the metadata would be easily accessible and freely available through channels suitable for academics, publishers, librarians, and other parties involved in book publishing and assessment.

                I presented the above idea at Metrics 2020: Workshop on Informetric and Scientometric Research (SIG/MET). A recording is available here.

                My initial findings indicate that there are various publishing services for book outputs. The same book could even be peer reviewed, issued, distributed, and translated by different independent publishers (or non-publishing companies). Importantly, there is a need to define and label these services in a consistent way.

                Next steps

                Many questions still need to be answered, such as: how can the different services provided by publishers best be classified? Can publishers produce machine-readable metadata? Where can the metadata be stored and accessed? How can metadata be gathered and processed?

                I will further investigate these questions in my PhD research. And I hope that the academic community, publishers, librarians, and infrastructure providers will also contribute to realising my proposed model for book assessment.

                My research paper Prestige of scholarly book publishers: an investigation into criteria, processes, and practices across countries is currently under peer review; nevertheless, it is accessible as a preprint.

                I am grateful to my supervisor Ludo Waltman, who has helped to improve my work in innumerable ways, for his exceptional support. I am also thankful to Julie Martyn for her encouraging emails reaching me precisely at the time I got stuck in my writings.

                ]]>
                Eleonora Dagienehttps://orcid.org/0000-0003-0043-3837
                How can we organise team building and brainstorming online in times of corona?https://www.leidenmadtrics.nl/articles/how-can-we-organise-team-building-and-brainstorming-online-in-times-of-corona2020-11-16T10:02:00+01:002024-05-16T23:20:47+02:00The CWTS solution to this question: organise an online retreat. Last year, CWTS organised its research retreat off-site in Noord-Brabant. This year, due to the pandemic, we organised an alternative. This even brought us to Thailand - virtually, of course. In this post, we share our experiences.Online or offline?

                Where to begin? In the spring of this year – right as Europe’s “first wave” hit – we started thinking about how to organise our second-ever research retreat. We considered several options. The preference was to once again organise the research retreat on the location of a beautiful repurposed monastery in the province of Noord-Brabant, like it was last year, this time keeping the 1.5 metres distance rule in mind.

                By the time summer came around, it was clear that this idea was no longer feasible, the Netherlands now very much in the shadow of a rising infection rate. This meant that it was time for plan B: organising the retreat in a combination of so-called city hubs and online hubs. In cities where multiple colleagues live (or: live close by) colleagues could come together for the retreat. For the ones who wouldn’t feel comfortable meeting in-person, online hubs would be created.

                At the end of summer, it turned out that meeting in city hubs wouldn’t be possible either, this time with rising infection rates accompanied by a partial nationwide lockdown. That’s when we, at the last possible moment, decided to go for plan C: organising the retreat completely online. This online retreat was divided over two days: on Thursday afternoon we organised an informal session where all our colleagues could join in on the fun. The next morning researchers of CWTS came together for an online Quackathon organised by Vincent Traag and Wolfgang Kaltenbrunner, allowing researchers to collaborate with colleagues outside of their usual circles and develop mixed methods approaches to a particular issue, in this case open science. Fortunately, this was experienced as a good alternative by at least one of our colleagues:

                “We spent last year’s retreat near the border with Belgium. This year we went fully online, and while I did miss having all colleagues in one place, it worked quite well. Thanks in large part to a great organizing team! One thing I loved is how the Quackathon enabled us to work with others in CWTS we don’t normally get a chance to engage with in a joint project because of time constraints. Though last year we were more flexible in moving around between groups, tables and flip-overs, we also made it work online and I truly enjoyed it.”

                Offline travelling: to colleagues’ living rooms and Thailand

                For the informal part of the retreat we asked participants beforehand to send a picture of their living room to one of the organisers. The first part of the retreat consisted of a quiz in which participants were asked to match the pictures of the living room to the right colleague. Spending much more time at home than usual, this seemed a nice way to get to know our colleagues better. This was easier said than done, of course, with some colleagues having more instantaneously recognizable surroundings than others.

                Figure 1. Concentration during the quiz “Which living room belongs to whom?”


                After this quiz, we moved on to an online escape room that we played in smaller groups. In this game, a private school’s employee went missing and we had to find out where he was. He turned out to be in Thailand! The pictures of Thailand made some colleagues long for a holiday far away. One of our groups was incredibly quick and even achieved an all-time high score. The online escape room was received differently by our colleagues. Sometimes it was a challenge to connect to each other online and solve a puzzle together. After each group finished the escape room, the informal part of the retreat finished. From the feedback round it appeared that it would have been nice to have an online drink together as well, so that’s something we should definitely do next time! Still, being able to attend such an event in-person would have been the preferred option, especially because of the difficulty of one-on-one social interactions and getting to know (new) colleagues in digital formats. As one of our colleagues summarises:

                “The online retreat was a great way for getting this community feeling again – and you could really feel how everyone was excited about this experience. But it was also a bit disappointing when the session was over and one had to face the actual distance again.”

                Quackathon: the best of several (research) worlds

                Friday was the day of the Quackathon! A favourite from the previous year, most researchers looked forward to trying it again, this time online. A Quackathon is a sort of online pressure cooker where no information is provided beforehand, which can be especially challenging for research tasks which necessitate extensive reading in order to gather relevant information. However, putting together colleagues who either do more quantitative or more qualitative research also offered learning opportunities. For instance, one of our colleagues learned how to do qualitative coding in a very short time amount. As the next blogposts about the research retreat will show, this is exactly why we spend time on events like the Quackathon, designed to push us beyond our intellectual comfort zones. As an institute where so many different types of research come together, we must take the time to learn something from each other.

                ]]>
                Josephine BergmansInge van der WeijdenJackie Ashkin
                Evaluative Inquiry IV: Accountability and learninghttps://www.leidenmadtrics.nl/articles/evaluative-inquiry-iv-accountability-and-learning2020-11-05T14:18:00+01:002024-05-16T23:20:47+02:00Do research evaluations serve the purpose of accountability or of learning? We argue that they can do both and that we might as well use the energy and resources it takes to organize evaluations for both accountability and learning opportunities.This is the last blog post on the Evaluative Inquiry, the new approach to research evaluation that CWTS has been developing since 2017, following one on broadening the concept of academic value,evaluating research in context andmixing methods.

                In evaluations of any kind people often distinguish between summative and formative evaluations (see for example the classic Evaluator’s Handbook from 1987). Summative evaluations are carried out to ensure accountability for past work. They test whether investments have led to the desired outcomes in order to formulate statements about the effectiveness of policy instruments and to support decisions about the allocation of funding. Formative evaluations are, on the contrary, primarily concerned with learning for improvement: they assess processes and mechanisms in order to formulate recommendations to improve them.

                Originally, the focus of the evaluation of research was on accountability. In order to justify investments in public research governments wanted to know the returns on these investments and university managers were looking for data and insights to inform the allocation of money among different faculties and research groups. Yet, evaluation reports implicitly also produced relevant lessons for the research units under evaluation, either in the form of recommendations, or as observations or interpretations of their activities that fed back into the group’s discussions about research directions, organizational matters or human resources.

                While learning and accountability are different purposes and distinguishing between these is important, we do not see a contradiction between accountability and learning in the practice of research evaluation. Research evaluations can perfectly serve both purposes at the same time and, as said, implicitly often do. The evaluative inquiry explicitly works towards both purposes. It would be a waste of energy and resources to organize evaluations solely for accountability and not use them as a learning opportunity.

                The latest rendition of the Dutch Strategic Evaluation Protocol (2021-2027) fortunately expanded the space for learning, focusing on goals and strategy rather than metric assessment. Academic research units are now evaluated in terms of research quality, societal relevance, and viability with special attention for Open Science, PhD policy and training, academic culture and HR policy. The groups under evaluation themselves decide which indicators they want to be evaluated on. Moreover, research evaluation is a crucial part of quality assurance, which is now a topic of yearly conversations with the board of the institute. All these elements of the current SEP protocol clearly promote self-reflection and learning as part of a strategy towards viable, relevant and well-recognized and used research.

                The Evaluative Inquiry most directly feeds into the first phase of the evaluation process when the academic unit needs to prepare its self-evaluation document. Insights are helpful much beyond, however, most notably for research strategy and organizational planning. Carrying out a self-evaluation under the new SEP can be quite demanding for research groups. Firstly, they have to make their aims and strategy explicit. As research aims and strategy of many research groups are implicit, making this explicit for a SEP evaluation requires work that an external party can help with. Secondly, the unit is expected to reflect in a coherent, narrative way on how it actually performs and organizes its research to achieve its strategic aims. Our experience is that many groups struggle with this. Describing performance in the form of a narrative is not what academic environments are used to. Especially the integration of research quality and societal relevance in one text can be challenging. Lastly, as organizations of any kind, academic units have cultures and are collectives of people with different opinions. Bringing in external research evaluation specialists helps to facilitate the putting together of the self-evaluation document as well as the larger conversation around the missions and ambitions of the collective.

                The Evaluative Inquiry supports academic units in crystalizing goals, missions, visions and strategy, taking stock of the diversity of output, making the multitude of stakeholder relations visible, and listing staff opinions about the academic organization. Building on a combination of scientometric and qualitative analyses this work helps to make visible whether what people say what they do (their missions and strategies), is in fact what they do (their output and their collaborations), and whether their academic organizations are aligned with this (SWOT). The Evaluative Inquiry helps to navigate the academic unit through this inspiring and sometimes thorny process towards a solid self-evaluation document as well as better informed research strategy and organizational planning more generally.

                ]]>
                Tjitske HoltropLaurens HesselsAd Prins
                Leiden Madtrics turns one today!https://www.leidenmadtrics.nl/articles/leidenmadtrics-turns-one-today2020-10-31T10:40:00+01:002024-05-16T23:20:47+02:00Leiden Madtrics has been around for a full year! Time to reflect and wonder: How did it go?Halloween 2019. A team of seven at CWTS is hectically working on the launch of the institute’s new science blog. Getting the last settings in WordPress right, preparing a quick announcement, entering the first posts (so that things don’t look too empty) – we (the editorial team) were rather excited.

                53 blog posts later, it is time to reflect a bit. Admittedly, we started out rather open-mindedly. There wasn’t much that we could have foreseen back then. Beginning with the quirky name, we wanted this blog to be a playful and accessible way of communicating the research done at CWTS. All of that while maintaining a rather broad range of topics. Anything related to Science of Science, Scientometrics, Evaluation Studies - you name it.

                Admittedly, our initial goals felt quite ambitious, even given our enthusiasm. But – editing a blog is a task one grows with over time. And it’s not about doing it perfectly, either. What counts is just to slowly gain experience and routine and also, to have a team to share the burden with. And not to forget our authors who provided all the posts! In the end, it is thanks to them that editing a science blog is fun (most of the time).

                We hope that you, our readers, could also gain a bit from following the blog. Maybe you have found your very own reason to stop by and look around? Be it finding out more about meta-science, learning about new topics, or just killing some time – we are sure that there have been posts for which it was worth it. Let’s go on a quick tour and delve into some of our highlights from the past year!

                To begin with, Covid-19 not only had an impact on everyone’s life but got its fair share on the blog as well. Twelve entire blog posts were dedicated or related to this topic (and maybe there are yet more to come?). Actually, we liked most of them quite a bit. Here, we would just like to highlight the three posts that reflected on the social implications of the lockdown, written by our authors Carey, Eleonora, and Ed.

                Observant readers of Leiden Madtrics might have noticed that delineations of science of all sorts have been a recurrent theme. These posts have hopefully contributed to a better understanding of e.g., how science can be mapped according to the SDGs, why it is so difficult to categorize research, or which the most prominent topics in, well, Covid-19 related research are.

                Open Science enjoys some prominence on the blog as well. Be it on the topic of open abstracts, current developments concerning open access, or the application of the FAIR-principles to scientific publications, this topic is hard to miss.

                Sometimes, our authors contribute a full-blown study as a blog post. That is, of course, great, but can give the editors some headache when it involves implementing fancy Tableau visualizations… But in the end, we can learn from that as well.

                One might ask: where actually do the ‘metrics’ as in ‘Madtrics’ come in? A pertinent example are the indicators in the Leiden Ranking 2020. Or consider the series on the Evaluative Inquiry and research metrics, covering the role of value, the context of research, and the use of mixed methods in evaluation practices.

                Finally, there is one blog post that we are particularly fond of. It’s a rather light-hearted, yet so informative approach to describing some of the work done at CWTS. Read again about the daily quest of the A-team!

                This is of course just a selection. Explore further for yourself, browse through the different categories, or maybe use the tags to find out more about a topic. Also, if you haven’t subscribed to the email notifications or followed us on Twitter yet, this could be a good moment. Thank you so much for following until here, and hopefully, stay around for the year that lies ahead!

                ]]>
                Blog team
                Incorporating the human factor in the study of universitieshttps://www.leidenmadtrics.nl/articles/incorporating-the-human-factor-in-the-study-of-universities2020-10-28T10:00:00+01:002024-05-16T23:20:47+02:00University evaluation is done, in part, by evaluating the papers produced by the university. However, universities don’t produce papers, right? People produce papers! In this blogpost we illustrate how you can use the number of papers produced by individuals to evaluate universities.Why should you care?

                How do you evaluate a university? This question does not have an easy answer. However, there is an attribute that is typically considered relevant: the production of scientific papers. However, papers are not created by the university per se, they are created by individuals who are affiliated to a university. Currently, how individuals contribute to the scientific output of a university (e. g. number of papers produced per individual) is not a parameter considered in university evaluations, in part because it is difficult to get the necessary data. But now this data has become more readily available thanks to advances in machine learning and improvements in the metadata available in most scientometric databases. In this post we briefly illustrate how we can use such data to analyze universities differently, incorporating a more human dimension in the discussion of how science is being produced.

                We would like to know the contribution of each individual to the university production of papers and analyze how the contributions are distributed among the individuals affiliated to that university. Recently, new disambiguation algorithms allow us to more accurately identify the different individuals active in the production of scientific papers. At the same time, new developments in the tracking of the linkages between authors and their affiliations at the publication level have opened the possibility of determining who is affiliated with what university in each scientific paper. These developments pave the way to more advanced forms of scientometric analysis, like for example mobility studies.

                In this blogpost we illustrate how these data also allow us to study the individuals affiliated to universities, and how they contribute differently to the scientific output of their universities, thus allowing for a far more in depth analysis on how universities produce their results, moving beyond the mere publication analysis of the university outputs.

                How does it work?

                Take a university and all its publications. Then identify all the individuals (i.e. disambiguated authors) that are affiliated to that university in the set of publications. Count the publications for each individual. Of course, the sum of the number of papers of all individuals affiliated to a university is greater than the number of papers affiliated to the university because the same paper can be authored by several individuals from the same university. To fix this, we need to divide the weight of a paper among the authors of the same university. This represents the contribution of an individual to that paper. If we sum all the contributions of an individual, we get the contribution of that individual to the paper production of her university. Figure 1 illustrates this process. Let’s suppose a university has 3 publications, and no external collaboration. These publications are represented in column B (P1, P2, P3). Column A represents the weight of that publication for the count of publications of the university (i.e. in total the university has produced 3 publications). These publications have been authored by 3 different individuals represented in column D (I1, I2, I3). Column C captures the different contributions of each individual to each of the publications, while column E captures the net contribution of each individual to the overall output of the university. Et voilà, from a plain set of publications, we now have a much richer set of information of how these publications have been carried out within the university.

                Figure 1: How to calculate the contributions of individuals. A: Contributions to productivity per paper. B: Papers. C: Mapping of contributions from papers to individuals. D: Individuals. E: Contributions to productivity per individual.

                Based on this much richer information, it is now possible to perform much more advanced analyses on the output of the university. For example, now it is possible to analyze the distribution of the contributions. To do so, we use a Lorenz curve, which is used by economists to analyze the distribution of income in a country. From this curve, we can calculate the Gini index, which will tell us how concentrated the distribution of contributions is. Gini index 0.0 means perfect equality and Gini index 1.0 means that all the papers are produced by one person.

                Applying it to real life

                We created a Lorenz curve for each of the ~1000 universities of the Leiden Ranking (LR). With this data, we calculated the average Gini index of the LR universities (0.59 +- 0.03) and the average values of the curves at 9 points (see Figure 2). In order to illustrate how this can be used to analyze specific universities, we also plotted the Lorenz curve of Tilburg University and Erasmus University, since these universities have the most extreme values of the Gini index for the Dutch universities (0.56 and 0.65, respectively).

                The most revealing finding is that 70% of the least productive individuals in a university contribute to about 25% of the papers of a university, which is in line with previous observations about the skewness of scientific productivity. However, the distributions of Tilburg University and Erasmus University sit at opposite extremes of the world average. Tilburg is somehow more egalitarian than Erasmus in terms of individual contribution to its production.

                Figure 2: Lorenz curve of the individual contributions within a university. Gray area: The area of an absolutely equal distribution. Blue: Tilburg University, Gini 0.56. Red: Erasmus University, Gini 0.65. Black: Leiden ranking average, Gini 0.59 +- 0.03.

                As a mode of conclusion

                We have illustrated how new data science developments in scientometric databases allow for new approaches to analyze universities, illustrated by the use of the Gini index to characterize the contributions of individuals to the scientific production of universities. This approach opens the possibility of measuring new attributes of universities, more related to their workforce than just their output, thus positioning the individual at the center of the academic system, and supporting a more anthropogenic perspective in science studies. Our intention is to continue the exploration of this perspective, and to start a discussion on which of these attributes could become more supportive evaluation metrics.

                ]]>
                Juan Pablo Bascur CifuentesRodrigo Costashttps://orcid.org/0000-0002-7465-6462
                Publications should be FAIRhttps://www.leidenmadtrics.nl/articles/publications-should-be-fair2020-10-26T11:35:00+01:002024-05-16T23:20:47+02:00Scholarly data sets are increasingly expected to be FAIR (findable, accessible, interoperable, and reusable). To fully realize the benefits of open access to the scholarly literature, Ludo Waltman argues that publications should be FAIR as well.Over the past two decades, the open access movement has made significant progress in promoting the free accessibility and reusability of scholarly publications. About half of the publications from recent years are free to access and reuse. However, are accessibility and reusability sufficient for a well-functioning system of scholarly publishing? While accessibility and reusability are essential, I believe a broader perspective on open access is needed.

                Findability and interoperability

                Researchers and other users of the scholarly literature spend large amounts of time trying to find the publications that are most relevant to their needs. Obviously, accessibility and reusability of publications are of little use if it is hard to find relevant publications in the first place. Findability of publications therefore is just as important as accessibility and reusability.

                One approach to improve the findability of publications is to create an infrastructure in which the text of publications is made available in a machine readable way and in which interfaces are provided to enable humans and machines to perform text-based searches. Such an infrastructure should be as inclusive as possible, so it should not be artificially restricted to publications from specific publishers or platforms. In addition, the infrastructure should be fully flexible in the way in which it enables the text of publications to be searched.

                Performing text-based searches is of course just one way in which humans and machines may try to find relevant publications. There are many other approaches as well. One approach for instance is to search for publications of a specific researcher or research organization or to search for publications in a specific journal. Another approach is to start from a seed set of relevant publications and to search for related publications by tracing citation links from the seed set to other publications.

                This highlights the importance of interoperability. Publications are connected to each other by citation links. They also have links with other types of entities, such as the journal in which they have appeared, the license under which they have been made available, the data sets and source codes of which they make use, the researchers by whom they are authored, and the organizations with which these researchers are affiliated or by which they are funded. To facilitate interoperability, publications need to be enriched with metadata that captures these links. In addition to being open, this metadata should as much as possible make use of persistent identifiers, such as DOIs and ORCIDs.

                Making publications FAIR

                A well-functioning system of scholarly publishing requires publications not only to be freely accessible and reusable, but also to be findable and interoperable. In other words, publications should comply with the FAIR (findable, accessible, interoperable, and reusable) principles, just as scholarly data sets are increasingly expected to be FAIR.

                There is a growing consensus in the scientific community on the importance of open access. Governments, funding agencies, research organizations, scholarly societies, publishers, and individual researchers increasingly share a commitment to making publications free to access and reuse, even though they do not always agree on the best way to reach this goal. Making publications findable and interoperable requires a similar commitment. In particular, it requires stakeholders to work together to create infrastructures that provide high-quality open metadata on publications (and ideally also the full text of publications). Although several initiatives have been taken, the availability of high-quality open metadata is still limited, leading to a situation in which publications are increasingly free to access and reuse, while their findability and interoperability are still significantly hampered.

                The scientific community has a responsibility not only to make publications freely accessible and reusable, but also to make them findable and interoperable. The FAIRness of publications can be improved by supporting efforts such as Metadata 2020, the Initiative for Open Citations (I4OC), the Initiative for Open Abstracts (I4OA), the Research Organization Registry (ROR), FREYA, and other related initiatives. Making publications FAIR also requires careful thinking about the governance and funding of infrastructures for open metadata. Just as publishers, funding agencies, research organizations, and other stakeholders are discussing ways to make publications freely accessible and reusable, they also need to discuss ways to improve the findability and interoperability of publications.

                Last week we celebrated the progress made in the transition to open access publishing. Let’s make sure we will soon be able to also celebrate the improved FAIRness of publications!

                This blog post has been inspired by discussions in the I4OA team. I thank Bianca Kramer, Catriona MacCallum, Cameron Neylon, David Shotton, Clifford Tatum, and Nees Jan van Eck for their helpful feedback in the preparation of this post.

                ]]>
                Ludo Waltman
                Why is it so difficult to think of new possible worlds?https://www.leidenmadtrics.nl/articles/why-is-it-so-difficult-to-think-of-new-possible-worlds2020-10-07T10:30:00+02:002024-05-16T23:20:47+02:00We are what we read, it is sometimes said. In this blogpost, Jackie Ashkin suggests what academics might read to inspire imaginations of a world that could be otherwise.

                Why is it so difficult to think of new possible worlds? This is a question Marta Hejer and Wytske Versteeg ask in a recent paper for Territory, Politics, Governance. It is a question I ask myself almost every day.

                Hejer and Versteeg contend that 'use of fossil fuels is deeply embedded in our societal values and everyday routines' and that 'as a consequence, we lack coherent imaginaries of alternative post-fossil futures'. Imagination, for them as well as for me, is inextricably linked to the capacity to change.

                So what might help academics imagine? As an old English teacher used to tell me, you are what you read – so why not something a bit more fantastical?

                When I say fantasy, think of more than Harry Potter or the Hunger Games: think of (amongst many others) classics of magical realism like Mikhail Bulgakov’s Master and Margarita or the more contemporary surrealism of Salman Rushdie’s Two Years Eight Months and Twenty-Eight Nights; think of Emily St John Mandel’s eerie post-apocalyptic Station Eleven or Isobelle Carmody’s epic Obernewtyn Chronicles. Fantasy books are not just children’s books. When we relegate fantasy to the realm of adolescent escapism and insist that we have more important things to read, we collectively fail to take new possible worlds seriously. We make it harder for ourselves to begin to think of new possible worlds.

                One vibrant example of what can happen when you combine social scientific practice with speculative fiction is Radical Ocean Futures, an art-science exhibit developed by the Stockholm Resilience Center in 2014. The project presents four possible futures for our ocean, worlds in 2070 where there is no land or there are no fish - but none in which the world continues with ‘business as usual’ and everything turns out ok. The team developed short stories, audio-bytes, and scientific papers to make their case.

                As we continue our steady march into what some call the Anthropocene, others the Capitalocene (Moore 2016), we must engage with radical possibilities for a world that is otherwise. In this spirit, I here suggest three fantasy novels for imagining new possible worlds.

                1. For the History Buff - Naomi Novak’s His Majesty’s Dragon (2006)
                  Everything is better with dragons – including the Napoleonic Wars. Novak brings you dragons like you’ve never known them before: Temeraire is as charismatic and complex as his master, naval captain William Lawrence. The novel is fast-paced without sacrificing the intricate details of military warfare in the late-eighteenth century and is the first of seven books through which Novak meticulously tackles issues of race, coloniality, and the inevitability of history. A spirited read that will leave you wondering if there really weren’t dragons back then, after all.

                2. For the Strong Female Lead – N. K. Jemisin’s The Fifth Season (2015)
                  What’s that? A believable heroine? Never mind fantasy novels that forget women in their middle age – on the contrary, this story revolves around one. In a world where the apocalypse is just another season (hence the title of the book), follow Essun into the depths of political intrigue on her quest to find her kidnapped daughter. This thought-provoking novel will leave you questioning a number of appropriately STS-ey themes, including time, perspective, and the very nature of what you know.

                3. For the Wandering Soul – Ursula K. Le Guin’s The Farthest Shore (1972)
                  This story follows a middle-aged wizard and a young prince as they set out to understand why magic across the land is losing its power. The third book of her Earthsea cycle, this volume stands out to me because it is clearly written with the delicacy and sensibility of the most practiced ethnographer (after all, the K. in her name refers to her father, American anthropologist Alfred Kroeber). Her steady, straightforward prose will carry you on a journey quite literally to the ends of the earth.

                I leave you with this: imagination is not a gift, but a skill – one that we must commit to practicing as much as any other if imagining new possible worlds is to get any easier in the days and months to come. Happy reading!

                ]]>
                Jackie Ashkin
                Who benefits from science? A comment on Barry Bozeman’s ‘Public Value Science’https://www.leidenmadtrics.nl/articles/who-benefits-from-science-a-comment-on-barry-bozemans-public-value-science2020-09-22T13:26:00+02:002024-05-16T23:20:47+02:00In a new article for Issues in S&T Barry Bozeman argues that current science policies benefit the rich more than the poor, thus reinforcing social inequalities. This blog post discusses his argument in the light of related views on how science can contribute to wider social well-being.

                Barry Bozeman’s new article on ‘Public Value Science’ raises one of the most fundamental questions in science policy: Who benefits from science? His answer is clear: right now the benefits tend to go to the rich while the ­negative impacts, such as unemployment or pollution, differentially affect the poor. Bozeman thus concludes that science and technology can be a regressive force in society as they reinforce current social inequalities.

                The argument is sharp, sound and convincing. Although it is focused in the US, it is a relevant discussion across the globe, even in welfare democracies such as the Netherlands or Sweden. Many innovations related to economic growth reduce job opportunities to low and middle classes. Many innovations related to consumption are mainly enjoyed by those who can afford them–even in health. And the harm caused by innovation affects more directly disenfranchised communities.

                Under the special status that science enjoyed in the 20th century as a central factor in ‘modernity’, science policy seldom took notice that innovation could do harm. If there were negative outcomes to knowledge production this was assumed to be the result of inadequate downstream policies for environmental, health or welfare issues–not a problem of science policy. Irrespective of research agendas, it was seldom questioned that science would or could result in benefits for all.

                The importance of Bozeman’s article lies in highlighting that many research trajectories (or directions) supported by public policies are surprisingly well-aligned with dominant economic and political interests–rather than being concerned with wider social benefits. This is obvious in publicly funded health research, with a relative focus on expensive treatments and chronic diseases of wealthy nations which is astonishingly similar to private R&D. Yet in other sectors as well incumbent groups can be seen to shape research agendas according to their interests rather than the public good. See, for example, the persistently large investment in nuclear fusion research (still €5bn, thus 6% of all European Commission research spending for 2021-27) in spite of the current success of greener renewable technologies. Thus, science tends to benefit more the wealthy than the poor because research agendas are shaped in a variety of both explicit and invisible ways by incumbent groups (by the political economy) without open debate on public values and wider societal benefits.

                The picture drawn by Bozeman is concordant with diagnoses presented in recent years by innovation studies scholars such as Andy Stirling, Johan Schot or Mariana Mazzucato. However, the proposals for improvement by the different authors have interesting differences in emphasis. Mazzucato’s focus is on (rather top-down) state-led missions that would spearhead innovation in directions consistent with public values. Building on sustainability transition theory, Schot proposes that transformative change in innovation systems need the coordination (orchestrated by state policy) of the various actors involved. Research can indeed contribute to change innovation pathways but it will only succeed when synchronised with ongoing transformations downstream. Concerned about how allegedly progressive transformations become captured by particular interests even when led by public policy, Stirling emphasises the need for supporting a diversity of innovation trajectories and plurality of perspectives in appraisal of agendas. He thus stresses participation, precaution and responsibility given that the benefits of science are often not self-evident, and that different social groups may have disparate preferences.

                Bozeman proposes a five-step program for making science more attuned to benefiting all citizens: 

                1. Graduate education on science’s social contributions
                2. Evaluation of research impacts
                3. Ring-fencing curiosity-driven science while making other research more accountable
                4. Diversifying the research working force
                5. Fostering public participation on the goals of science

                I would fully endorse Bozeman’s plan -- let me notice its similarity with some of the European initiatives on Responsible Research and Innovation, e.g. in terms of gender or participation. Now, its comparison with Mazzucato, Schot and Stirling’s perspectives raises interesting questions. Are decentralised and piece-meal steps as suggested by Bozeman more likely to succeed than grand schemes as in Mazzucato’s missions? To which extent should or could public agents coordinate with innovation actors (further downstream) to achieve transitions à la Schot? How can a ‘public value science’ be supported in controversial contexts (in labour, environment) while keeping Stirling’s attention for diversity and plurality?

                Bozeman’s provocation succeeds in showing that a sizeable part of research is now serving mainly the privileged and potentially harming the disenfranchised–and in spurring much needed-debate on how science policies could help in making research (again?) a progressive force in society.

                (This comment will be published in Issues of Science and Technology in the Fall 2020)

                Photo by Vlad Tchompalov on Unsplash

                ]]>
                Ismael Rafolshttps://orcid.org/0000-0002-6527-7778
                Structuring Natural Language Processing Contributions in the Open Research Knowledge Graphhttps://www.leidenmadtrics.nl/articles/structuring-natural-language-processing-contributions-in-the-open-research-knowledge-graph2020-09-17T00:00:00+02:002024-05-16T23:20:47+02:00Next-generation digital libraries like the Open Research Knowledge Graph are here! Catering to which, we announce a Shared Task that builds scholarly contributions-focused graphs over Natural Language Processing (NLP) articles. Want to build a machine learner, we provide the data--join us!Search has long been revolutionized by knowledge-graph-powered services such as the Amazon Marketplace in e-commerce, or Open Street Maps in the cartography and navigation services domains, to name just two examples. Inspired by such knowledge graph (KG) success stories in the general domain, such technology is now being realized over scholarly knowledge as well. In this vein, we highlight the TIB-led project Open Research Knowledge Graph (ORKG) that advocates for representing scholarly articles’ contributions in knowledge graphs and that, as a next-generation digital library platform, stores and publishes such graphs as persistent knowledge items. You can browse this digital library and its scholarly knowledge here!

                Since scientific literature is growing at a rapid rate and researchers today are faced with a publications deluge, it is increasingly tedious, if not practically impossible to keep up with the research progress even within one's own narrow discipline. The ORKG then is posited as a solution to the problem of keeping track of research progress minus the cognitive overload that reading dozens of full papers impose. It aims to build a comprehensive knowledge graph that publishes just the research contributions of scholarly publications per paper where the framework can then intelligently compute paperwise or aggregated scholarly knowledge highlights for researchers.

                Naturally, then, one wonders what information should be captured in such scholarly contributions’ knowledge-focused graphs? Within the SemEval 2021: NLPContributionGraph (NCG) Shared Task, we seek both to answer and to discover better answers to this question. We have formalized a scholarly contributions-focused graph model over NLP scholarly articles that will be applied to annotate hundreds of NLP articles for their contributions. The corpus will be freely released to the NCG task participants, based on which they will be able to train and test automated machine learners. In essence, such systems will read “contributions” information in a subject-predicate-object structured format to be integrable within Knowledge Graph infrastructures such as the ORKG. The corpus annotation data elements will include: (1) contribution sentences - a set of sentences about the contribution in the article; (2) scientific terms and relations - a set of scientific terms and relational cue phrases extracted from the contribution sentences; and (3) triples - semantic statements that pair scientific terms with a relation, modeled toward subject-predicate-object Resource Description Framework (a standard model for data interchange on the Web, commonly referred to as RDF) statements for KG building. The task is to automatically extract these elements given a new NLP article. Have a look at our pilot annotation task description paper published in the 1st Workshop on Extraction and Evaluation of Knowledge Entities from Scientific Documents co-located with the ACM/IEEE Joint Conference on Digital Libraries (JCDL 2020).

                NCG is organized under the umbrella of the well-known Semantic Evaluation (SemEval) series that have been running since 1998. SemEval tasks bring together researchers with similar text mining and machine learning interests, and facilitate the collaborative building of computational semantic analysis systems. As depicted in Figure 1, our task will conform to the standard SemEval framework for tasks where the gold standards will be released by the organizers and the NLP systems will be developed by the task participants.

                Figure 1: SemEval Framework. Source: Wikimedia Commons under the CC-BY-SA 3.0 License

                In an earlier blogpost we raised a few questions: What if scholarly knowledge communicated in the scholarly literature would be FAIR, also for machines? What if the global scholarly knowledge base would be more than a repository of digital documents? How would this change the global access to as well as the reuse of scholarly knowledge?

                NLPContributionGraph seeks to concretely find the answers. We invite the scholarly communication, information science and related research communities to contribute to the vision and the ORKG, specifically, and help to shape the future of scholarly communication. You may find detailed participation information and the task timeline here.


                ]]>
                Jennifer D'Souza
                Where do scholars move? Measuring the mobility of researchers across academic institutionshttps://www.leidenmadtrics.nl/articles/where-do-scholars-move-measuring-the-mobility-of-researchers-across-academic-institutions2020-09-03T10:00:00+02:002024-05-16T23:20:47+02:00The mobility of scientific human capital is a key channel for exchanging ideas and disseminating scientific knowledge. In this blog post, we demonstrate how scientometrics can help trace mobility patterns at the institutional level, using the Dimensions database.

                In recent years, bibliometric databases have substantially improved the consistency and quality of the metadata extracted from publications, particularly the author-affiliations linkages from scientific publications. Furthermore, author-name disambiguation algorithms have been implemented for most large bibliometric databases, such as Web of Science, Scopus, and Dimensions. Most of these algorithms benefit from open systems for the unique identification of scholars like ORCID. These developments have led to new scientometric approaches to track aggregated mobility patterns between countries and regions.

                However, when it comes to the mobility of researchers between institutions, evidence is scarce due to the lack of harmonized affiliation data at the micro level. This situation is changing due to the implementation of advanced approaches for affiliation harmonization like the approach used for the Leiden Ranking, or, more recently, the Global Research Identifier Database (GRID), that currently covers more than 98,000 research institutions worldwide. The availability of these harmonized registries enables the identification of affiliation changes in the careers of scholars. In this blog post, we illustrate how author-affiliation information can be used to develop mobility indicators at the institutional level and explore the many possibilities this offers for the study of scientific mobility.

                Measuring the institutional mobility of scholars

                There are many different forms of mobility, and the interpretation of such forms may vary from case to case. To keep things simple, we focus only on the distinction of institutionally mobile vs. non-mobile. Specifically, we consider that a researcher is institutionally mobile when she is affiliated to more than one institution in a given timeframe. Based on this broad definition, we categorize researchers into two different mutually exclusive groups:

                • Non-mobile, researchers who have been only affiliated to one institution during the period of analysis.
                • Mobile, researchers who have been affiliated to more than one institution in the period of analysis.

                The dataset: identifying researchers and their institutions

                We use the Dimensions data dump updated until June 2019 that is available at CWTS, selecting only publications from the period 2015-2018. This time period is the same as the one used in the most recent release of the Leiden Ranking.

                Mobility research using bibliometric data relies on the connections between authors and publications. Dimensions data allow the authors to be directly linked to their publication level affiliations. In order to link publications with individual scholars, Dimensions implements an author-disambiguation algorithm, allowing to know which publications were authored by which author in their database. This algorithm has a higher level of precision (i.e. How many identified publications truly belong to the given researcher?) than recall (Are all researchers’ publications correctly identified?). While higher precision is a desired property for an author-disambiguation algorithm, the lower recall may lead to underestimation of the number of mobile researchers, since some of their publications (and affiliations) may not be identified.

                In order to track scholars’ movements at the institutional level, we combine the affiliation information of those articles with the unique institutional affiliation names available in the GRID. Given the large scope of organizations included in GRID, and in order to work with a homogeneous set of institutions, we crossmatched 1,176 distinct Leiden Ranking institutions with GRID identifiers. We found a total of 1,169 organizations that had a GRID identifier and appeared in the latest release of the Leiden Ranking (2020). Therefore, we adopt the methodology of the Leiden Ranking for the identification of institutions. This limits our analysis to a set of well-established universities.

                Global institutional mobility

                Figure 1. Main institutional mobility patterns of Leiden Ranking universities (mobility restricted to LR universities) - the size of circles represents the number of scholars with at least one publication affiliated with a Leiden Ranking university between 2015 and 2018. The color represents the share of researchers that were affiliated to another Leiden Ranking institution in the same period. Universities in red are those with more than 22% (which is the average of all universities in the set) of its affiliated researchers with mobility, while blue indicates a share of institutionally mobile researchers below that threshold. Explore Tableau version in a new tab

                Figure 1 shows the propensity to mobility within universities included in the Leiden Ranking. The results indicate that North American, Australian and Northern European universities exhibit a relatively high level of institutional mobility. Countries in Southern and Eastern Europe show lower levels of institutional mobility, something that is also observed in South America, Africa, and Asia, including Japan and South Korea.

                An important element to consider when studying mobility with bibliometric indicators is to which extent publications of researchers provide reliable signals of mobility. In order to test this for the results in Figure 1, we performed a test studying only those researchers with exactly 5 publications. This returned patterns very similar to those in Figure 1.

                So far we analyzed only mobility events for Leiden Ranking universities. This approach allows tracking mobility among a relatively homogeneous set of institutions but does not capture the mobility events of researchers with institutions that are not covered by the Leiden Ranking. For example, we did not track mobility linkages of researchers with other local universities and with other types of research organizations in the government sector and elsewhere (e.g. thematic or umbrella research organizations like Inserm, CSIC, CNRS, CNR, Instituto de Salud Carlos III, national academies of sciences, etc).

                In Figure 2, we study the mobility of researchers affiliated with universities covered by the Leiden Ranking, while also considering their mobility events with any other institution identified in GRID. This means that mobile researches are not only those that have been affiliated with more than one Leiden Ranking university, but also with any other organization identified by GRID. This includes, for instance, government research organizations, umbrella research organizations and their subsidiaries, as well as hospitals.

                Figure 2. Main institutional mobility patterns of Leiden Ranking universities (all mobility events as captured by GRID) - the blue-red threshold is set at 38%, which is the average share of mobile researchers among all the universities in the set. Explore Tableau version in a new tab

                Overall, the general trends observed in Figure 2 remain the same as in Figure 1. However, this time we see a stronger propensity of mobility particularly in French and Italian universities that may be related to the important role of national research organizations such as CNRS (France) and CNR (Italy) in structuring and developing those countries' scientific occupations. Hence, one needs to keep the impact of these organizations in mind when analyzing differences in mobility patterns between individual countries, but the broad geographical patterns are robust to this bias.

                Expanding mobility analytics

                The devil is in the detail. While the previously outlined methodology is simple to calculate and understand, it may be challenging to interpret in the light of more refined and detailed mobility concepts, like migration, brain drain, etc., which have more relevance from a policy-motivated point of view. For example, the indicators above may confound cases in which a given researcher is marked as mobile because she simultaneously keeps multiple affiliations, or because she moved towards new opportunities in a different institution. The short timeframe of analysis may also be limiting. Policy-motivated research will require more directed and focused indicators.

                That’s why we also want to offer a quick look at what we could see as a potential indicator of inbreeding. This indicator is motivated by the previous study "Where do universities recruit researchers from?" Assuming that researchers most likely publish their first paper(s) with affiliation to their Ph.D institution, this indicator aims at measuring the tendency of universities to keep their own Ph.D graduates affiliated to them over time. We first identify researchers who published with any given Leiden Ranking university in 2018 and collect their full publication history (as in Dimensions). We excluded academically younger researchers by removing all researchers with the first publication after 2012, thus retaining only those researchers who started to publish in or before 2012. Then we classified researchers into two types:

                • Insiders: Researchers whose first affiliation and their affiliation in 2018 remain the same.
                • Outsiders: Researchers whose first affiliation and their affiliation in 2018 are different (i.e. in 2018 they are in a different institution than when they started to publish).

                Figure 3. Inbreeding mobility patterns of Leiden Ranking universities. The size of circles represents the number of scholars with at least one publication affiliated with a Leiden Ranking university in 2018. The color represents the share of insiders. Universities in red are those with more than 50% of insiders, while blue indicates a larger share of outsiders. Explore Tableau version in a new tab

                Interestingly, Figure 3 exhibits a very similar pattern to those shown previously. While U.S. and Western European universities have (in 2018) researchers who more frequently started to publish in other universities, this is much less common in Eastern Europe or Southern Europe. For example, only 1 out of 4 researchers at Indiana University Bloomington started their publishing career at the same university. This figure is 3 out of 4 at Sapienza University in Rome or the University of Warsaw. Readers can study the data in more detail in an interactive dashboard depicting differences between institutions and fields of research.

                The way forward

                The preliminary analysis presented in this blog post supports the possibility of monitoring and studying mobility patterns at the institutional level using bibliometrics. Many perspectives and alternative indicators can be formulated to fully understand global mobility patterns. Issues related to the economic, social, reputational, linguistic, geographical, generational, systemic, or political aspects of scientific mobility (e.g., youth and size of the different scientific systems, travel bans, war conflicts, or the effects of crises like the current COVID-19 pandemic, etc.) are all elements that need to be considered in future scientific mobility studies. Moreover, more advanced conceptual definitions of mobility (e.g. migrants vs. multiple affiliations, inbreeding, or brain drain/brain gain processes) are also necessary for more advanced policy-relevant studies of the different dynamics related to scientific mobility.

                Finally, more technical issues such as the coverage, completeness, and accuracy of the Dimensions database and of the GRID identifier, or more conceptual aspects such as the importance of scientific mobility in creating new thematic flows across institutions will deserve our attention in the near future.

                ]]>
                Vít MacháčekMárcia R. FerreiraNicolás Robinson-GarcíaMartin SrholecRodrigo Costashttps://orcid.org/0000-0002-7465-6462
                Systematize information on journal policies and practices - A call to actionhttps://www.leidenmadtrics.nl/articles/systematize-information-on-journal-policies-and-practices-a-call-to-action2020-08-31T16:00:00+02:002024-05-16T23:20:47+02:00Recently the creators of Transpose and the Platform for Responsible Editorial Policies convened an online workshop on infrastructures that provide information on scholarly journals. In this blog post they look back at the workshop and discuss next steps.In most research fields, journals play a dominant role in the scholarly communication system. However, the availability of systematic information on the policies and practices of journals, for instance with respect to peer review and open access publishing, is surprisingly limited and scattered. Of course we have the journal impact factor, as well as a range of other citation-based journal metrics (e.g., CiteScore, SNIP, SJR, and Eigenfactor), but these metrics provide information only on one very specific aspect of a journal. As is widely recognized, there is a strong need for a wider range of information on journals (see for instance here and here). Such information is for instance needed to facilitate responsible evaluation practices, to promote open access publishing, and to improve journal peer review.

                Various infrastructures provide information on aspects of scholarly journals, for instance:

                Even though this list of infrastructures (which is definitely not comprehensive) may look impressive at first sight, it in fact leaves much to be desired. There are at least three problems. First, many of the above-mentioned infrastructures provide information only for a limited number of journals or publishers. Much information is missing, and information may also be inaccurate or outdated. Second, there is little coordination between the various infrastructures. They all operate independently from each other, leading to a scattered landscape. Insiders may understand the unique information provided by each infrastructure, but most researchers, publishers, and funders are likely to get lost in the multitude of infrastructures and data sources. Third, for many of the above-mentioned infrastructures, the longer-term sustainability is unclear. Infrastructures are often run by small teams working with very limited resources.

                In May 2020, in our roles as the creators of Transpose and PREP, we convened an online workshop to discuss ways to address the above-mentioned problems, in particular by exploring possibilities for collaboration between the various infrastructures. About 35 participants attended the workshop, including representatives of infrastructure organizations (e.g. representatives of the above listed initiatives and members of COPE, CrossRef, etc.), scholarly publishers, and research funders. Representatives of six infrastructure initiatives (i.e., PREP, Transpose, the STM taxonomy working group, TOP Factor, DOAJ, and SHERPA/RoMEO) gave short presentations, explaining their mission and scope as well as their perspective on collaboration with other initiatives. This was followed by a break-out session in which the workshop participants had more in-depth discussions about possibilities for collaboration.

                The workshop has shown that there are many promising ways in which the different infrastructures could work together. This ranges from the development of a standardized terminology to describe the activities of journals (building on the work of the STM taxonomy working group), to the introduction of cross-links between the websites of the different infrastructures and, more ambitiously, to initiatives aimed at making the different infrastructures fully interoperable and perhaps even at setting up an integrated infrastructure. In practical terms, the outcome of the workshop has been to start working together on two immediate next steps:

                • Comparing infrastructures. To obtain a better understanding of the similarities and differences between the various infrastructures, we plan to perform a systematic comparison of the information provided by each of the infrastructures.
                • Shared terminology or taxonomy. Different infrastructures use different terminologies, which may cause confusion and limit interoperability. To address this issue, we plan to work on the development of a shared terminology or taxonomy via the Doc Maps project led by the Knowledge Futures group.

                Depending on the availability of resources and the level of support from the community, these two steps will hopefully provide a starting point for a more ambitious long-term agenda, aimed at working toward some kind of integrated infrastructure for providing systematic and reliable information on scholarly journals. We hope to involve all relevant stakeholders in this endeavor. Let us know if you would like to join!

                ]]>
                Willem HalffmanSerge HorbachJessica PolkaTony Ross-HellauerLudo Waltman
                Evaluative Inquiry III: Mixing methods for evaluating researchhttps://www.leidenmadtrics.nl/articles/evaluative-inquiry-iii-mixing-methods-for-evaluating-research2020-08-21T13:00:00+02:002024-05-16T23:20:47+02:00Critiques on research metrics have produced an unhelpful divide between quantitative and qualitative research methods. In this blogpost, we explain why research evaluation can benefit from the strengths of both.Since 2017 we have been developing a new approach to research evaluation, which we call Evaluative Inquiry (EI). In a series of blog posts, we discuss the four principles of EI, based on our experiences in projects with the Protestant Theological University and with the University for Humanistics. In these projects we analyzed the value of the work of these institutes which subsequently informed the self-evaluation document to be submitted to the evaluation committee. In our previous two posts we discussed the EIs focus on value trajectories, and the EIs contextualization of research value. This third post focuses on our methods for evaluating research.

                Many in academic and professional environments have discussed and criticized the reliance on metrics and quantitative methods in research evaluation. The Leiden Manifesto, the Metric Tide, or DORA have offered careful considerations on how to measure and represent research value. The Evaluative Inquiry participates in this project using a portfolio of quantitative and qualitative methods that are used in complementary ways to make visible the complexity of academic research.

                The Dutch evaluation protocol requires academic organizations to provide proof of use and recognition of academic and societal production. In many fields this distinction between the societal and the academic is artificial, which makes it difficult for scientific boards and managers to put together the self-evaluation document that is required by the evaluation committee. Mixing methods provides different pieces to this complex puzzle, allowing for a less dichotomized and more contextualized approached.

                We have used bibliometric methodologies, using Web of Science, Google Scholar and Microsoft Academic, to get insight into co-authorship relations, citation scores and visibility in journals. As fields such as Anthropology and Theology often produce not only articles in journals but also books, monographs and edited volumes, we like working with Google Scholar as it allows us to trace the use of books both in the academic domain as beyond. In addition to these analyses, we have used Ad Prins' Contextual Response Analysis, which makes it possible to get a sense of the users and the patterns of use of the output of the particular research organization. The VOSviewer tool that CWTS developed makes it possible to map the discursive space that research organizations operate in, as well as changes over time. Other than these more quantitative methods, we have used interviews and focus group discussions to get a more fine-grained understanding of the organizational context as well as people’s perceptions of the organization’s strengths and weaknesses. These interviews and focus groups allow us to probe scholars about the relevance of their work for other social environments other than academia which is still their main focus. Our portfolio includes other advanced scientometric analytics that we will put to use in the future, such as the Strength, Potential and Risk analysis and the Area Based Connectedness analysis.

                The Evaluative Inquiry uses its methods in a complementary way. Doing Google Scholar analyses and user studies makes it possible to get a sense of the different elements of the academic value trajectory: the kind of output, reception, theoretical and topical developments and people’s engagements and perceptions. The more qualitative interviews and focus groups facilitate the collection of organizational and contextual information, allowing us to situate these value trajectories in direct relation to the academic organizations and stakeholder networks that scholars work within. One method’s insights can, moreover, corroborate or dispute claims of another. Theologians have for example claimed in interviews that their work reaches multiple audiences, while the user analysis and Google Scholar impressions showed a more homogeneous user group. Discussing these dissonances yielded important information about theologians' value trajectories.

                An important part of our methodological strategy is to work closely with the academic institute, provide regular updates of our analyses, and allow for questions and input. In the project with the humanists we, moreover, invited them to actively contribute to the analyses. An example of this is the user analysis we did for the University for Humanistic Studies. When we presented preliminary results, the scientific board commented on our classification of topics that users expressed interest in. We therefore invited them to do the labelling themselves, involving them in the nitty-gritty of our analysis and classification process. Allowing them into the kitchen of our analyses not only improved their understanding of the user analysis but also created ownership of the results. We achieved a similar effect with the workshop we have organized towards the end of the project. We invited the whole academic organization for this event where we shared our preliminary findings and gave everyone the opportunity to weigh in and fine-tune our results.

                A portfolio of quantitative and qualitative methods provides complementary insights. Metrics can give powerful insights into collaboration patterns, disciplinary orientation and relevant audiences but they are insufficient to understand and represent value and relevance in context; qualitative insights are needed as well. The Evaluative Inquiry uses methods in a versatile and complementary way. This entails a letting go of believing in one method getting it right and being capable of providing the most accurate representation of academic work. We argue, instead, that a multiplication of methods and close collaboration with clients allow for more interesting insights into academic realities. This approach, lastly, fits the requirements of the new Dutch Strategic Evaluation Approach (SEP) 2021 -2027, which calls for a narrative focus of the self-evaluation document.

                ]]>
                Tjitske HoltropLaurens HesselsAd Prins
                Consensus and dissensus in ‘mappings’ of science for Sustainable Development Goals (SDGs)https://www.leidenmadtrics.nl/articles/consensus-and-dissensus-in-mappings-of-science-for-sustainable-development-goals-sdgs2020-08-10T10:21:00+02:002024-05-16T23:20:47+02:00A variety of ‘mappings’ of research on SDGs are being developed. A recent study shows that there are stark disagreements across some of these bibliometric ‘mappings’, raising concerns about their robustness. I argue here that this is due to different interpretations of the science relevant to SDGs.The shift in R&D goals towards the SDGs is driving demand for new S&T indicators…

                The shift in Science & Technology policy from a focus on research quality (or ‘excellence’) towards societal impact has led to a demand for new Science & Technology indicators that capture the contributions of research to society, in particular those aligned with SDGs. The use of the new ‘impact’ indicators would help monitoring if (and which) research organisations are aligning their research towards certain SDGs.

                Responding to these demands data providers, consultancies and university analysts are rapidly developing methods to map projects or publications related to specific SDGs. These ‘mappings’ do not analyse the actual impact of research, but hope to capture instead if research is directed towards problems or technologies that can potentially contribute to improving sustainability and wellbeing.

                …but indicators on the contributions of science on the SDGs are not (yet) robust

                Yet this quick surge of news methods raises new questions about the robustness of the mappings and indicators produced, and old questions about the effects of using questionable indicators in policy making. The misuse of indicators and rankings in research evaluation has been one of the key debates in science policy this last decade, as highlighted by initiatives such as the San Francisco Declaration on Research Assessment (DORA), the Leiden Manifesto or The Metric Tide report in the UK context.

                Indeed, the first publicly available analysis of SDG impact, released recently by the Times Higher Education (THE), should be a motive for serious alarm. For almost two decades, the THE has offered a controversial ranking of universities according to ‘excellence’. This last May it has produced a new ranking of universities according to an equally questionable composite indicator that arbitrarily adds up dimensions of unclear relevance. For example, the indicator of the impact on health (SDG3) of a university depends on the one hand on its relative specialisation on health – as captured, e.g. by the proportion of papers related to health (10% of total weight), and on the other hand on the proportion of health graduates (34.6%). But the weight is also based on (self-reported) university policies such as care provided by the university, e.g. free sexual and reproductive health services for students (8.6%) or community access to sports facilities (4%). This indicator is likely to cause more confusion than clarity and it is potentially harmful as it mystifies university policies for the SDGs.

                The relative specialisation on health captured by the proportion of papers related to health in the THE ranking is partly supported by an Elsevier analysis of the publications that are related to the SDGs – which might seem more reliable than those based on data self-reported by universities.

                However, mapping publications to the SDGs is not as straightforward as it might seem. An article published last month by a team at the University of Bergen (see Armitage et al., 2020) sounded the alarm by showing that slightly different methods may produce extremely different results. When comparing the papers related to SDGs retrieved with their own analysis with those by Elsevier, they found that there is astonishingly little overlap – in most SDGs only around 20-30% as illustrated in Figure 1. The differences also affected the rankings of countries’ contributions to the SDGs. The Bergen team concluded that ‘currently available SDG rankings and tools should be used with caution at their current stage of development.’

                Figure 1. Comparison between the Bergen and Elsevier approaches to mapping SDG-related publications. Based on Web of Science Core collection, 2015-2018. Source: Armitage et al. (2020)

                Why are mappings of publications to SDGs so different? Lack of direct relation between science and SDGs

                Perhaps we should not be surprised that different methods yield so different results. The SDGs refer to policy goals about sustainability in multiple dimensions – ending poverty, improving health, achieving gender equality, preserving the natural environment, etcetera. Science and innovation studies have shown that the contributions of research to societies are often unexpected and highly dependent on the local social contexts in which knowledges are created and used.

                Nevertheless, most research is funded according to the expectations of the type of societal benefits that it may generate – and thus one can try to map these expectations or promises according to the language used in the (titles and abstracts of) projects and articles. Unfortunately, the expected social contributions are often not made explicit in these technical documents because the experts reading them are assumed to see the potential value.

                As a consequence, the process of mapping projects or articles to the SDGs is ineluctably carried out through an interpretative process that ‘translates’ (or attempts to link) scientific discourse into potential outcomes. Of course, such translation is dependent on the analysts’ understandings of science and the SDGs. There is consensus on some of these understandings. For example most analysts would agree that research on malaria is important for achieving global health. However, other translations are highly contested: should nuclear (either fission or fusion) research be seen as a contribution to clean and affordable energy? Should all educational research be counted as contribution to the SDG on ‘quality education’?

                Furthermore, in a number of SDGs such as gender equity (SDG 5) or reduced inequalities (SDG 10), there is a lot of ambiguity on the potential contributions. In particular, there is relatively little research specifically on these issues in comparison to the research with outcomes affecting gender relations and inequalities.

                Another challenge of these mappings is that the databases used for analysis are not comprehensive, having a much larger coverage of certain fields and countries (See Chapter 5 in Chavarro, 2017). This is particularly problematic when analysing research of the Global South.

                In summary, there are many societal problems where there is lack of consensus and ambiguities, and in these cases, the mappings will depend on the particular interpretation of the SDGs that the mapping methods implicitly adopt.

                A plurality of SDG mapping methodologies

                It follows from the previous discussion that different analyses carry out different ‘translations’ of the SDGs into science through the choice of different methodologies. The study by Clarivate (2019) is based on a core set of articles that mention ‘Sustainable Development Goals’ – thus it is related to research areas with an explicit SDG discourse.

                The approaches developed by Bergen University, Elsevier, the Aurora Network and SIRIS Academic are based on searching for strings of keywords, in particular keywords found in the UN SDGs targets or other relevant policy documents. These searches are then enriched differently in each case. The hypothesis of this ‘translation’ is that publications or projects containing these keywords are those best aligned with the UN SDG discourse. The question is then where should the line be drawn. For example, why in some lists zika virus is included in the list of health SDG3, but not the closely related dengue virus, with a much higher disease burden?

                An alternative approach being developed at NESTA and Dimensions uses policy documents and keywords to train machine learning algorithms in order to identify articles related to the SDGs instead of creating a list of keywords to search the articles. The downside of this approach is that it is a black box regarding the preferences (or biases) of the machine learning algorithms.

                Comparisons as a pragmatic way forward

                In the face of this plurality of approaches potentially yielding disparate results, the STRINGS project aims to be a space for constructive discussion and comparison across different methodologies. A comparison between methods will help in finding out to which extent there is consensus or dissensus in the mappings of various SDGs.

                To this purpose, in collaboration with the Data Intensive Science Centre at the University of Sussex (DISCUS), on July 23-27 we have carried out a hackathon focussed on retrieving publications related to clean energy research (SDG 7) (to be reported). We have also organised a workshop to discuss the results obtained by the different teams mentioned above with the various methodologies, and how each methodology might capture a particular ‘translation’ or understanding of the SDGs. As proposed by the Bergen team, this comparison ‘will allow institutions to compare different approaches, better understand where rankings come from, and evaluate how well a specific tool might work’ for specific contexts and purposes.

                Disclaimer

                The discussion in this blog builds on ongoing work carried out by the STRINGS project. It presents my personal view (rather than the project’s) following my engagement debates on the use of indicators in policy and evaluation, for example a recent participation in an EC Expert Group on ‘Indicators for open science’.

                This post was first published in the STRINGS project blog on 30th July 2020.

                ]]>
                Ismael Rafolshttps://orcid.org/0000-0002-6527-7778
                The Book That Changed My Notion of Workhttps://www.leidenmadtrics.nl/articles/the-book-that-changed-my-notion-of-work2020-08-07T10:30:00+02:002024-05-16T23:20:47+02:00This summer season, we are publishing a series of book reviews. This time, our colleague Juan shares with us a book that is very close to his heart, and which had an influence on how he sees the idea of work.I would like to tell you about a book that changed my life, but I don’t want to spoil it yet by revealing the title. You see, since I was young, I had always anguished about career choices. I imagined that I would be forced to put hours into something I hate, and I would arrive home after work hating myself too. My family and my school imposed on me this idea that work is suffering, and suffering is good, and if you don’t like suffering then you don’t deserve good things. How cheerful. Happily, I had some pieces of common sense in my brain, so I rejected this idea, but I also thought: so, this is what most people think about work, I better be careful in choosing my job or else I'll get suffocated!

                And so, I lived my life questioning what kind of job I would really like. People told me that if I followed my passion, I would never have to work in my life. Such a pressure! That is, until I found this wonderful book. This book proposes that the idea that you are born with a passion that destines you to a dream job is a lie, and a quite harmful one! In reality, most people that are happy at their job acquire a taste for their job over time. The more years they spend doing their job, the more they start to like it.

                Now I know what you are thinking: "But what about this and that job. They are horrible!" Well, luckily, this book has got you covered. There are three conditions that a job requires to make you happy, and jobs without these conditions will never make you happy. These conditions are:

                • Autonomy: You need to feel some sense of control over what you do with your time. If your job requires you to behave like a machine without initiative, then you are bound to feel as such. Interestingly, autonomy is also considered a critical factor for happiness by psychologists!
                • Competence: You need to feel that you are getting better at what you do. Trivial jobs rot your brain and do not allow you to feel pride in your skills, while difficult and unmanageable jobs make you feel humiliated and stupid.
                • Relatedness: You need to feel that you are connecting with people at your job. This could be either with your colleagues, your clients, or by helping people as a consequence of your job. Nobody likes to work with people they hate, and nobody profits from causing others to suffer (I hope!).

                You may also be thinking: "Well, not everybody is looking to be happy at their work; some people only want the money." If you are thinking that, then the book also addresses that issue (and if you are not thinking that then, well, you should). The book cites Amy Wrzesniewski, who argues that there are three contexts for your work:

                • Job: You work for the money.
                • Career: You work to get a better job.
                • Calling: You work because it defines who you are.

                I would argue that for most people their work is a job, especially for those unfortunately enough to not have the power to choose which job they want. These categories are not very relevant to the point I am making, but I still wanted to show them to you because they might be helpful, somehow.

                Anyhow, going back to my point, after reading the book I realized that life at work can actually be wonderful, and that I don’t need to fear landing in a bad job if I know how to look for a better one. The book’s title is So Good They Can’t Ignore You, written by Cal Newport, and in this post I have only reviewed the part that touched me most deeply. For a review of the full length of the book, check this summary. The book is also available as an audiobook.

                ]]>
                Juan Pablo Bascur Cifuentes
                Honest signaling in academic publishinghttps://www.leidenmadtrics.nl/articles/honest-signaling-in-academic-publishing2020-07-22T14:00:00+02:002024-05-16T23:20:47+02:00Scientific publishing has become a game between scientists and journals. Scientists try to convince the journals to publish their papers, while journals try to filter-out low-quality papers while being overwhelmed with too many submissions. Is there a smarter way? Honest signaling may be the key.This post is based on the following manuscript, currently under review: Tiokhin, L., Panchanathan, K., Lakens, D., Vazire, S., Morgan, T., & Zollman, K. (Preprint). Honest signaling in academic publishing, and is also published in the author's blog author's blog).

                “An article…is not the scholarship itself, it is merely advertising of the scholarship.” (Buckheit & Donoho, 1995)

                If you asked me, “Leo — why did you pursue a career in science?”, I’m not sure that I could give you a good answer. Maybe it had something to do with the whole being “curious about the nature of reality” thing. Maybe it’s because I’m stubborn and argumentative, and I thought that academic science rewarded these traits. Or maybe I just liked the independence — the chance to study whatever I wanted and actuallyget paid for it

                I can, however, think of one thing that definitely wasn’t a reason for getting into science: writing up my research in the sexiest way possible, submitting it to high-impact journals, and hoping to convince some editor to publish it and validate my sense of self-worth (and slightly increase my chances of getting a grant or permanent position some day). 

                I mean, my memory isn’t great, but I’m pretty sure that wasn’t part of the equation. 

                The reality is that many of us are idealistic when we get into science. Then, little by little, we learn the rules of the game. We learn that certain types of results, such as those that are novel and statistically significant, are valued more than others. We learn that scientists prefer clean, compelling narratives over honest descriptions of mixed findings and protocol failures. And we learn that our scientific worth is determined by whether we publish in certain journals, such as those with a high impact-factor.

                Once we learn the rules, we begin to play (or we just get fed up and leave ). After all, nobody likes to lose, even if it’s just a game. 

                In this post, I’d like to focus on one game that scientists play: writing up and submitting papers for publication. I’ll try to convince you that, given the way this game is set up, scientists are incentivized to deceive journals about the quality of their work. 

                I’ll also try to convince you that all hope is not lost. Even if we accept that scientists “play the game”, we can change the rules to promote a more “honest” publishing system. Along the way, we’ll learn a bit of signaling theory, and I’ll even throw in a Ghostbusters reference or two.  

                Academic journals are vulnerable to deception. 

                Why? Well, there are two interrelated reasons. 

                1. There are information asymmetries between scientists and journals. 
                2. There are conflicts of interest between scientists and journals. 

                Scientists know every little detail about their research — how many experiments they ran, how many dependent variables they measured, all the ways they analyzed their data, how their hypotheses changed throughout the research process, etc. But a journal only sees the final paper. So, there’s an information asymmetry - scientists have more information about some aspects of their work (for example, things related to its “quality”) than do journals. 

                All else equal, scientists have incentives to publish each paper in the highest-ranking journal possible (even if a paper isn’t very good). But high-ranking journals don’t want to publish every paper — they want a subset of papers that meet their publication criteria. These might be papers with compelling evidence, novel results, important theoretical contributions, or whatever. This creates a conflict of interest, in the game-theoretic sense — a scientist may benefit by getting a methodologically sloppy, p-hacked paper published in a high-ranking journal, but the high-ranking journal would prefer not to publish this paper (all else equal). 

                These factors make journals vulnerable to deception. This vulnerability exists along any dimension where there are information asymmetries and conflicts of interest. Let’s focus on research “quality” for now, because that’s a case where the information asymmetries and conflicts of interest are clear (see Simine Vazire’s nice paper about this in the context of quality uncertainty and trust in science). 

                Aside: I’m going to use a behavioral definition of deception — an act that transmits information that doesn’t accurately (i.e., honestly) represent some underlying state (and was designed to do so). This sidesteps the whole “is it conscious or not” business. It also gets closer to how biologists think of “deceptive signals”, which will become relevant later.

                Why should we care if scientists attempt to “deceive” journals by submitting low-quality work to high-ranking journals? At least 3 reasons. 

                1. It wastes editors’ and reviewers’ time. 
                2. Peer review sucks. So, low-quality papers “slip through the cracks” and onto the pages of high-ranking journals (it’s trivially easy to find example after example after example of this). This lowers any correlation between journal rank and research quality, which isn’t ideal because, for better or worse, scientists use journal rank as a proxy for “quality” (hint: it’s worse). 
                3. If low-quality research takes less time than high-quality research but still gets published in high-ranking journals, then scientists have less incentive to do high-quality work. This can generate adverse selection: high-quality work is driven out of the market, until low-quality garbage is all that remains (you can also think of the related “Natural Selection of Bad Science, where low-quality science spreads even if scientists don’t strategically adjust their methods). 

                So, it’d be nice if we could solve this problem somehow.  

                If there’s something strange…in your neighborhood.
                If there’s something weird…and it don’t look good.
                If you’re seeing p-hacking…when you look under the hood.
                If you’re reading shitty papers…and it’s ruining your mood.
                Who you gonna call?

                Of course, deception isn’t unique to academic publishing — whenever there are information asymmetries and conflicts of interest, there are incentives to deceive. 

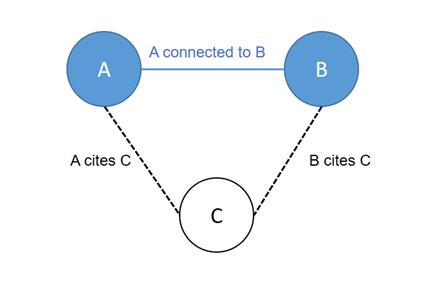
                Consider a biological example. A mama bird brings food back to her nest and must decide which chick to feed. Mama prefers to feed the hungriest chick and so benefits from knowing how much food each chick needs. But each chick may want the food for itself. So, even though Mama would benefit if the chicks honestly communicated their level of hunger, each chick may benefit by deceiving Mama and claiming to be the hungriest. 

                How can honest communication exist when there are incentives for deception? Why don’t communication systems just become filled with lies and break down?

                It turns out that economists and biologists have been interested in this question for a long time. And so, there’s a body of formal theory — Signaling Theory — dedicated to this and related problems (I’m more familiar with biological signaling theory, so I’ll focus on that).

                This is good news. 

                Why? Because it means that signaling theory can potentially provide us with “tools for thinking” about how to deal with deception in academic publishing.

                Who you gonna call? Signaling theory!

                I tried ¯\_(:/)_/¯

                One insight from signaling theory is that “honest signaling” is possible if the costs or benefits of producing a signal are different for different “types” of individuals. Think back to Mama bird and her chicks. Imagine that there are two types of chicks — starving and kinda-hungry. Both chicks benefit from getting food. But the benefit is larger for the starving chick, because it needs the food more. 

                If signaling (e.g., loudly begging Mama bird for food) has no cost, then none of this matters - both chicks will signal because they benefit from the food. But what if the signal is costly? Then, a chick will only signal if the benefits of getting the food outweigh the cost of the signal. This is where it gets interesting. Because the starving chick benefits more from the food than the kinda-hungry chick, if a signal is costly enough, then it’s only worth paying this cost if a chick is truly starving. So, in a world of magical payoff-maximizing chicks and where begging is just costly enough, only the starving chicks would be doing the begging. 

                Boom — honest signaling. 

                This is what’s known as a situation of differential benefits — both chicks pay the same cost when begging, but receive different payoffs from getting fed. Another way to get honest signaling is via differential costs. The idea is similar, except that different types pay different costs for the same signal. For example, maybe a good skateboarder can get away with doing a roof drop to show how cool they are, but a bad skateboarder would break their legs. The key is that producing a signal must only be worth it for some types of individuals (there are also other ways to get honest signaling that I won’t get into here - check out (1) and (2) if interested). 

                Now let’s apply these insights to academic publishing. Say that we want a system where scientists don’t submit every paper to high-ranking journals, thinking that they might as well “give it a shot”. Instead, say that we want scientists to “honestly” submit high-quality papers to high-ranking journals and low-quality papers to low-ranking journals. What reforms would move us towards this outcome?

                My co-authors and I go through a bunch of these in our paper. Here, I’ll list a few that I think are most interesting. 

                Publishing inefficiencies serve a function.

                We often complain about publishing inefficiencies, like long review times, arbitrary formatting requirements, and high financial costs to publication. But, as the signaling example shows, inefficiencies can serve a function: the costs associated with publishing reduce the incentive to submit low-quality research to high-ranking journals. Economists have known this for a long time (1, 2). Just think of what would happen if Nature and Science made their submission process as low-cost as possible (e.g., no submission costs, formatting requirements, or cover letters; guaranteed reviews within 48 hours). They’d get flooded with (even more) shitty submissions. 

                The point isn’t that inefficiencies are “good for science”. It’s that we should keep in mind that removing inefficiencies will create collateral damage, and we need to weigh this damage against the benefits of a more efficient publishing system. I see a lot of room for work on this and related problems: what functions do inefficiencies serve and how can we optimally structure inefficiencies to generate the best outcomes for science?

                Creating differential benefits.

                For differential benefits, the key is to create a system where there are larger benefits for submitting or publishing high-quality versus low-quality papers in high-ranking journals. 

                Some ways to do this are intuitive. We can improve peer-review (which makes it easier to tell good work from bad). We can mandate transparent research practices (same function). 

                Another idea is to reduce the benefits associated with publishing low-quality work in high-ranking journals. I see a few potential approaches here. We could target high-ranking publications for direct replication or preferentially scrutinize them for questionable research practices, statistical/mathematical errors, and problems with study design. This would be a post-publication differential benefits approach. Then, we would need to make sure that scientists receive lower benefits for publishing bad work in high-ranking journals. Possibilities include financial penalties, fewer citations for the published paper, or reputational damage (maybe the journal refuses to accept the scientist’s future submissions for some amount of time, or maybe other journals raise their bar for publishing that scientist’s future papers). 

                Creating differential costs. 

                For differential costs, the key is to create a system where there are larger costs for submitting or publishing low-quality versus high-quality papers in high-ranking journals. 

                One way to do this is to create costs to resubmission. When submission and resubmission is cheap and easy, scientists are incentivized to submit all papers to high-ranking journals, because scientists don’t lose anything when they get rejected. Resubmission costs solve this problem by making rejection costly. If low-quality submissions are more likely to be rejected, then resubmission costs will work. Of course, this would be another inefficiency in the publication process, which is something we’d need to take into account. 

                If we wanted to go this route, there are a few possibilities. Editors could wait some time before sending “reject” decisions. This would cause disproportionate delays for low-quality submissions. If papers had pre-publication DOI’s and their submission histories could be tracked, journals could refuse to evaluate papers that had been resubmitted too quickly. Or authors could “pay” for submissions by having to peer review N other papers for each submission. 

                Something else that could work would be to make peer-review and editorial decisions openly available, even for rejected papers. I like this idea (though it does have some issues, like generating information cascades). One nice thing is that making peer-review and editorial decisions openly available would mean that less information gets lost throughout the submission process (because prior reviews don’t just disappear into the darkness). And if low-quality papers receive more negative reviews, on average, then scientists will have fewer incentives to “try out” submitting to a high-impact journal, because negative reviews would follow the paper to future journals (and would eventually be seen by readers). 

                Other ways to increase differential costs could be to target the submission process. For example, authors could pay a submission fee (as is the case for some journals in Economics, Accounting, and Finance) but get refunded if the paper is deemed to be sufficiently high quality. This could even be incremental — bigger fees when there’s a bigger difference between the journal’s minimum standards and the quality of the submission. 

                Limiting the number of submissions (or rejections) per paper. 

                This will also work (but because it creates opportunity costs). I’ll discuss this idea in more detail in a future post. If you’re interested, check out the paper, which goes into more detail. 

                Epic inspiring ending. 

                This is where I’m supposed to bring everything together, throw in an inspirational quote, and make a final Ghostbusters reference, to make you think, “well isn’t he clever.” Must. Validate. Sense. Of. Self. Worth. 

                Instead, a few thoughts. 

                I’m not really a fan of the current publishing system, using journal rank as a proxy for quality, publishing inefficiencies, and so on. I hate the game, and resent the fact that I need to play it to have a successful academic career. I’m open to overhauling the system completely (e.g., getting rid of journals) if we get solid evidence that this would be better. But we’re not quite there yet. For now, we’re stuck. Journals and rankings. Information asymmetries. Conflicts of interests. So if we’re going to play this game, then we should consider how we can change the rules to produce better outcomes. 

                As we think about changing these rules, we could do worse than to add “differential costs” and “differential benefits” to our conceptual toolkits. These ideas have proven their worth in biology, and will likely be of use to us, even outside the context of academic publishing. 

                Want to prevent scientists from submitting grant applications when their ideas are bad or infeasible? Make grant submission more costly for bad proposals. John Ioannidis suggested a version of this with the “provocative” idea that grants be “...considered negatively unless one delivers more good-quality science in proportion”. Producing good-quality science is harder if your proposal was bad or infeasible. Boom — differential costs. Alternatively, as suggested for academic publishing, there could be submission fees that are refunded if a grant proposal meets some quality threshold.  

                We should keep in mind that many of the ideas here could exacerbate inequalities between individuals with more or less resources, such as early-career researchers and scientists in developing countries. This is a concern (though there are solutions, such as making submission costs conditional on scientists’ ability to pay them). The paper discusses this a bit. 

                Finally, we should keep our eyes open for what we can learn from other disciplines. The fact that signaling theory is useful for thinking about academic publishing is just the tip of the iceberg. As one example, while working on our paper, my co-authors and I discovered a huge literature in economics that addresses these same problems (and where people have come to many of the same conclusions about how to improve academic publishing). We review some of this work in the paper. For a nice, non-mathy introduction, check out this paper

                So, what now?

                You could read our paper. That’s an ok start. You could give me and my co-authors all of your money, so that we can figure out how to make publishing more efficient and reliable. That benefits us, but probably isn’t in your best interest. You could immerse yourself in the literature on signaling in biology and publishing reform in economics. That may or may not be useful for you though, and it’s pretty costly. 

                I think I’ve got a better idea. 

                If you’re all alone

                Pick up the phone

                And call

                Thanks to Anne Scheel, Daniel Lakens, Kotrina Kajokaite & Karthik Panchanathan for feedback on an earlier version of this post.

                ]]>
                Leo Tiokhin
                Evaluative Inquiry II: Evaluating research in contexthttps://www.leidenmadtrics.nl/articles/evaluative-inquiry-ii-evaluating-research-in-context2020-07-20T16:48:00+02:002024-05-16T23:20:47+02:00We know that academic knowledge production happens in context, yet, when assessing research, we undervalue the influence of stakeholders and organizational contexts on academic output and impact. The second of four blogposts is on evaluating research in context.In a series of blog posts, we want to introduce the four principles of a new CWTS approach to research evaluation. Since 2017 we have been developing this approach in the context of several projects mainly assisting others with putting together the self-evaluation document of the Standard Evaluation Protocol. On the basis of these experiences, and most notably the projects with the Protestant Theological University and with the University for Humanistics, we want to describe the four underpinnings of this Evaluative Inquiry: open-ended concept of research value; contextualization; mixed-method approach; and a focus on both accounting and learning. This second post focuses on contextualizing value.

                The previous post was about how the Evaluative Inquiry doesn’t follow a predetermined understanding of value as performance metrics but investigates value as a quality that comes into being in trajectories from research ambitions and organization to reception and use in the larger world. This post focuses on the two contexts of these trajectories, the research organization and the user and stakeholder context.

                To start with the latter, when societal relevance was added to the evaluation protocols in the Netherlands and United Kingdom, a rather uniform concept of stakeholders developed in the science policy community as societal recipients of the benefits of fundamental research and secondary audiences of the scientific output. Even if this group was very diverse, from teachers to transportation companies, to the elderly or provincial governments, the relation of these stakeholders to academic work was as relatively passive recipients. Our experiences with the theologians and humanists present a different picture. Theologians and humanistic scholars working on, for example, spiritual care work closely together with practitioners, policy makers or caregivers in the field of spiritual care. Their work addresses questions that stem from professional, policy or academic environments such as moral injury or distress and it is taken up both in professional circles (professional handbooks or policy guidelines for example) and in academic audiences (papers on the spiritual in care). The distinctions between scientific production and societal use become blurry.

                The fundamental point here is that at every stage of the knowledge trajectory, from question to answer, from production to communication and reception, from input to output, the scholarly and societal are closely intertwined. What do these collaborations look like, how do these result in particular kinds of output, and how can these collaborations be made visible in evaluative projects? The Evaluative Inquiry aspires to making visible these “productive interactions” within a shared problem space and their particular versions of relevance, excellence, or expertise. As such it builds on other attempts such as the Quality and Relevance in the Humanities system, developed for research evaluation in the humanities, which seeks to broaden the ranges of outputs, use and recognition.

                Thinking of value pathways that integrate the societal and the scholarly, and knowledge production and communication and reception, brings into view the academic organization as a crucial context as well. Research evaluation is often concerned with use, reception and impact of academic knowledge considering the organization of the knowledge production, “its viability,” as an afterthought to research value. We contend that the organization of the knowledge production process is crucial for understanding what knowledge is being produced and to what effect.

                There are many variables to this organizational context that matter to the specific output, relevance and reception. Organizational histories, publication cultures, teaching versus research obligations, funding sources and epistemic cultures all influence the processes and practices of academic research. Research organizations often bring together (sub)disciplines with differing epistemic commitments. These groups (such as development studies versus anthropology, humanists versus social scientists, or denominational loyalties in theology) do not have the same ideas about what good knowledge or impact looks like. They serve very different audiences and tend to debate the quality and relevance of books and articles that the other side of these commitments produces.

                Moreover, understanding the logics of organizations and how they have distributed collective tasks makes us realize that value and relevance require work. Since time is scarce, choices have to be made and priorities have to be set. Our anthropology case suggests that many anthropologists working on contracts of 80% teaching and 20% research, need to be conservative about their time investments. This means that finishing an article trumps one’s desire to participate in experimental collaborations, experimental types of science communications or experimental research directions.

                Concerning the discipline of the organization, theology and anthropology are critical and reflective practices. What is value, what is impact, what is transformation, where is society? It is these critical interrogations of terms and the systems they make sense in that define anthropology, theology, and many other SSH domains. This critical interrogation of political and epistemological underpinnings of social forms is a crucial contribution to public discussions, as social science and humanities scholars keenly emphasize. As these contributions are difficult to quantify and make visible within the parameters of the evaluation protocol, they require a different approach to the traditional views of research results ubiquitous in research evaluations.

                A contextualized approach to research evaluation requires a smart combination of evaluation tools and methods. In our next post, we will explain how Evaluative Inquiry tailors its use of different qualitative and quantitative methods to the research group under evaluation.

                ]]>
                Tjitske HoltropLaurens HesselsAd Prins
                Survey: Doing science in times of COVID-19https://www.leidenmadtrics.nl/articles/survey-doing-science-in-times-of-covid-192020-07-13T09:30:00+02:002024-05-16T23:20:47+02:00We are conducting a new study to understand how science is communicated during the coronavirus pandemic. All academic researchers, whether they are studying COVID-19 or not, are invited to undertake our surveyThe World Health Organization has declared a COVID-19 ‘infodemic’: an overabundance of information which is often mixed with rumours and misinformation. In light of this, CWTS researchers Giovanni Colavizza and Karlijn Roex are conducting a study in which they investigate how science is communicated during the coronavirus pandemic. All academic researchers, whether they are studying COVID-19 or not, are invited to take part in a 10-minute survey.

                The COVID-19 infodemic presents a real problem: an overabundance of often unreliable information creates uncertainty and anxiety. On the one hand, it is vital that experts and policy-makers know how to effectively communicate advice, while on the other hand, the public must be well-informed, too, if they are to act in such a way as to contain the spread of the virus. Scientists play a pivotal role in the flow of information because they need to keep themselves informed and are acting as experts by communicating information.

                The project

                Giovanni Colavizza and Karlijn Roex’s project, Collecting systematic survey data on scientists’ information-seeking and information-spreading behaviour in a time of crisis, aims to inform governments and experts with reliable, actionable information. They will conduct systematic, anonymous and regular surveys among scientists from all disciplines and investigate how they are adapting their information-seeking and -spreading behaviour to the unfolding of this infodemic, and will also include the role of different media. Colavizza and Roex want to share early insights with not just governments but also health officials and experts in order to help them improve their communication practices. They furthermore expect that the data gathered in their project will be used in future studies concerning the information behaviour of scientists in times of crisis.

                More about the project

                Participate in the survey

                All academic researchers, regardless of their discipline or research topic, are invited to participate in the 10-minute survey. By participating, you help us collecting crucial data that would otherwise be lost. In order to participate, you can proceed to the survey by following the link below:

                Take part in the survey

                ‘Corona: fast-track data’ grant by the NWO

                Colavizza and Roex’s project is one of thirty proposals that was granted funding in April 2020 in a special NWO call for research into issues of a non-medical or healthcare-related nature that arise in society during the corona crisis.

                Image created by Arco Mul. ]]>
                Karlijn RoexGiovanni Colavizza
                A-TEAM: A stands for a very challenging jobhttps://www.leidenmadtrics.nl/articles/a-team-a-stands-for-very-challenging-job2020-07-09T15:00:00+02:002024-05-16T23:20:47+02:00As the A-TEAM, we thoroughly evaluate the data we collect, and aim to provide a consistent and transparent curation. What we do could also be described as that of a detective/archeologist/archivist: through bits and pieces of data we seek to unravel the scientific landscape.“What do you do for work?” is a common conversation starter at social gatherings. For doctors or teachers, this is easier to answer, but for members of the A-TEAM this is a question that requires a lengthy explanation. The short answer would be that we unify organizations in a database, but this does not cover all our work. To unify an organization, we need to recognize which type of organization it is and what kind of relationships it has with other organizations. Then, of course, we must explain what unification means in our context. In short, we are busy with ontologies.

                Maybe giving an example would help explain what we do. Our job is not always like a fairy tale, but sometimes it can get equally unreal.

                Unravelling the higher education, research system, and funding resources

                Once upon a time there was a higher education institution called the University of Ensaïmada. First, we look at what project requires us to enter this organization into our database as each project has its own criteria when it comes to the number of publications to be used as a minimum threshold. Sometimes we must check other criteria such as the education programs they offer or demographic implications they may have on other organizations in our database. As the University of Ensaïmada fits our criteria, we decide to include it in our organization list. To give a few examples, this involves assigning it a unique ID and collecting relevant information such as location geocodes, up-to-date webpages, foundation years, mergers, persistent IDs if any, and connections to other databases/projects.

                A next step is to check all the name variations there may be for the organization. This step is also known as unification. For example, when research is published by a scientist working at the University of Ensaïmada, the name of the university can appear as Univ Ensaïmada, Ensaïmada Univ, Univ Ensai Mada, Ensaimad Uni, as well as with spelling mistakes as in Univ Ensamiada. The A-TEAM is extremely careful on this unification step and we are proud of our results. This data is then linked to the entity on the CWTS publication database as identified with a CWTS ID.

                Sometimes organizations change their names, they are split into different organizations, or they merge with others to form even larger organizations. As researchers should be able to follow publication data alongside these changes, the A-TEAM makes sure they are recorded within our database. As a principle we unify in such a way that disaggregation is always possible. For example, in 2017 University of Ensaïmada merged with University of Profiterole, yet this new organization kept the name of University of Ensaïmada. In this case our database would have three entries: one per university before the merger, and one for the new university. Thanks to this transparent approach, researchers can track such developments.

                Relationships that contribute to delicious research

                One of the most challenging parts of describing an organization concerns its relationships to others. This is necessary to understand how the research and higher education system works in the land of Pâtisseria. Science requires extensive collaboration as researchers do not work alone in isolation. To better understand the dynamics between organizations we also classify its relationships to others.

                For example, the University of Custard specializes in cream while the University of Puff Pastry specializes in layered dough. Together they have set up the lab of Applied Dough Combinations where research focuses on combinations of layered dough with cream, funded mostly by the Academy of Delicious Crafts. The research from this lab owes to these three organizations, and our mission is to codify these relationships so that researchers can understand how the research came to exist. In our database, these relationships are broadly defined as components (closely integrated) and associates (loosely affiliated).

                Types of organizations that cater to the feast of research

                Research in Pâtisseria does not only take place at universities. Some of it is carried out at hospitals, museums, research centres, and labs. However, not all hospitals and museums conduct research. Part of our task is to investigate what kind of organizations they are and how they interconnect in the wider research system. For example, the Museum of Baklava has a large collection of photos and documents but does not conduct research, as a contrast the Museum of Filo Pastry focuses heavily on research. Sometimes museums are both research and exhibition oriented as well. Sometimes these museums are standalone entities, but sometimes they are affiliated to research organizations or networks of museums, all of these are examined by the A-TEAM and entered into our database.

                In Pâtisseria there are 20 hospitals and clinics. The largest one, University Hospital Briouat, not only provides healthcare but produces a large amount of papers per year. It also collaborates with the University of Puff Pastry and with the Pastry Health Institute. With the former, it provides core curriculum education to medicine students as the faculty is located at the hospital and conducts research, while with the latter it has two research laboratories.

                Based on its characteristics as a healthcare provider and education/research centre, University Hospital Briouat could be classified as a hospital, a university, or a research centre. It could also be classified as a faculty of the university, but we would miss integrating its other functions. In general, we identify organizations by its core activity and identify the other functions through relationships. In this case, Briouat is classified as a hospital. To signal its close relationship with the university, we mark it as a component. The relationship with the Pastry Health Institute is less tight according to our criteria and thus we mark them as associates.

                This example is relatively straightforward and sometimes such relationships can be quite puzzling and intricate. Some hospitals can work with various universities or only collaborate for special trainings, while some universities place their students for trainings in 10 different hospitals. Our task is to investigate and establish how close or loose these various relationships can be. Only then can other researchers use our data for future research.

                Who is funding the research behind a publication?

                During the last years the Ministry for Healthy Bakery, the Foundation for Sweet Life or the Academy of Delicious Crafts are financing the research published in Pâtisseria, and the researchers mention them or the grants they receive in the funding acknowledgment section of the publication. In the same way as for the affiliated organizations in a paper, the role of the A-TEAM here is to check name variations, change of names, relationships among organizations, and type of funding organizations.

                Patisserie
                The Lab of Applied Dough Combination is closely affiliated to the University of Puff Pastry and the University of Custard, it receives funding from the Academy of Delicious Crafts.

                OK, it is deliciously complicated but what is this good for?

                The information we collect is stored in a database that scientists use in order to research various aspects of the science system. However, our most famous output can be seen in the Leiden Ranking of Universities. You can see an example of how our data is and should be used here and read more about the responsible use principles we uphold in the Leiden Manifesto.

                Thanks to our work, researchers can do delicious research.

                Our work involves careful evaluations and thorough reviews of the information we collect. By checking that all the data about an entity is accurate, we make sure that the information is accessible and current. After all, a database is only beneficial when the data it contains has been properly curated with consistent and transparent methods. Otherwise, what you get is a large heap of meaningless data which can only serve as the basis for faulty studies. A recent example of this is the inaccurate database from Surgisphere which was used in a now-retracted paper about HydroxyChloroquine.

                The challenges of our work are that although much of the information for each organization should be public, accessing such information is rarely straightforward. Most countries lack an overview of scientific collaborations, websites are not kept up to date, and organizations might disappear without a trace. We just keep on drinking more and more coffee on such days. We also enjoy seeing the actual buildings of the organizations we spend hours understanding, which happens quite randomly when we are on work trips. We are, in short, proud of and excited about what we do at CWTS every day!

                Charite Berlin Andrea
                A-TEAM member Andrea at Charité, Berlin. It is always nice to personally meet the hospitals we work on!

                What the A-TEAM does could also be described as that of a detective/archeologist/archivist: through bits and pieces of information we seek to unravel the scientific landscape. As such, only very patient and conscientious individuals are fit for it. A-TEAM members also do engage on research tasks of their own, which brings more insights into our database-related tasks. The current team is formed by Clara Calero Medina, Martijn Visser, Andrea Reyes Elizondo, Jeroen van Honk, Zeynep Anli, Tobias Nosten, Dan Gibson, and our visiting member Carey Ming-Li Chen. However, our database would not be what it is without the work from our dear former team members: Maia Francisco Borruel and Sonia Mena Jara.

                The A in A-TEAM stands for many aspects of our job: Address, Acknowledgement, Affiliations... In the end, we put everything together as a team and hopefully provide a delicious result!

                ]]>
                Zeynep AnliClara Calero-MedinaAndrea Reyes Elizondo
                The CWTS Leiden Ranking 2020https://www.leidenmadtrics.nl/articles/the-cwts-leiden-ranking-20202020-07-08T13:00:00+02:002024-05-16T23:20:47+02:00At CWTS, we have just released a new edition of our Leiden Ranking. In this post, the core members of the Leiden Ranking team provide a quick update and illustrate some of the insights provided by the ranking.Today CWTS is releasing the 2020 edition of the CWTS Leiden Ranking. As always, the release of the ranking requires a major effort involving contributions from a large number of colleagues at our center. This year, the COVID-19 crisis, combined with a major update of the internal data infrastructure at CWTS, created additional challenges, which has unfortunately led to a delay of almost two months in the release of the ranking.

                We hope, however, that it has been worth the wait. In recent years, we have made improvements to the Leiden Ranking by enhancing the online interface, by promoting the responsible use of rankings, and by adding new indicators, in particular indicators of open access publishing and gender diversity. This year, we have focused on increasing the number of universities included in the Leiden Ranking. While the 2019 edition included 963 universities from 56 different countries, we now have 1,176 universities covering 65 countries. Below we present a breakdown of the number of universities per country.

                Figure 1. Breakdown of the number of universities per country


                For each university included in the Leiden Ranking, we carefully collect the publications indexed in the Web of Science database that belong to the university. This is a laborious process that involves a significant amount of manual work. For this reason, we need to limit the number of universities in the Leiden Ranking, often leading to universities expressing their disappointment about not being covered by our ranking. This year, in order to increase the number of universities in the ranking, we have decided to make an additional effort. Rather than including all universities with at least 1,000 publications in the Web of Science database, we have chosen to include all universities that have at least 800 publications in the database (time period 2015-2018; fractional counting). This is the main explanation for the large increase in the number of universities covered by the ranking.

                The Leiden Ranking 2020 provides a huge amount of statistics. The ranking covers 1,176 universities, six main fields of science, and ten time periods (2006-2009 through 2015-2018). For each combination of a university, a main field, and a time period, the ranking provides values for 50 indicators, yielding a total of 1,176 × 6 × 10 × 50 = 3.5 million indicator values. This clearly offers lots of interesting insights. To illustrate this, there is one particular insight that we would like to share.

                The 2020 edition of the Leiden Ranking turns out to be the first edition that includes more Chinese universities than US universities. In 2019, the Leiden Ranking included a few more universities from the US than from China (173 vs. 165). This year, the situation has reversed. The Leiden Ranking now covers 204 Chinese universities, including six from Hong Kong and one from Macau, and 198 US universities. The scatter plot below shows for each university from China (in blue) and the US (in orange) the number of publications (horizontal axis; time period 2015-2018; fractional counting) and the percentage of highly cited publications (vertical axis; publications belonging to the top 10% most highly cited of their field and publication year).

                Figure 2. Scatter plot showing the number of publications (horizontal axis) and the percentage of highly cited publications (vertical axis) for Chinese and US universities


                The scatter plot shows that US universities dominate among the universities with the highest percentage of highly cited publications. Rockefeller University, located in the top-left in the plot, is a clear outlier, with a small output of fewer than 1000 publications, but more than 33% highly cited publications. In terms of output, Harvard University, located in the far right in the plot, surpasses all other universities, with almost 34,000 fractionally counted publications, of which 22% are highly cited. However, among the runners-up, we find many Chinese universities, often with a fairly decent percentage of highly cited publications.

                The chart below offers some insight into the growth of the publication output of Chinese universities over time. For all Chinese and US universities included in the 2020 edition of the Leiden Ranking, the chart displays the number of universities with at least 800 fractionally counted publications in each of the time periods covered by our ranking. Going from the earliest (2006-2009) to the most recent (2015-2018) time period, the number of Chinese universities with at least 800 publications shows a major increase, from 77 to 204, while the increase in the number of US universities with at least 800 publications is relatively small, from 172 to 198.

                Figure 3. Growth over time in the number of Chinese and US universities with at least 800 publications in a four-year time period


                This is just one illustration of the insights that can be obtained from the Leiden Ranking. We invite you to explore the ranking in full detail at www.leidenranking.com. As always, we welcome your feedback on the Leiden Ranking. To contact us, please use this contact form.


                ]]>
                Ludo WaltmanZeynep AnliClara Calero-MedinaMark NeijsselAndrea Reyes ElizondoNees Jan van Eckhttps://orcid.org/0000-0001-8448-4521Martijn Visser
                Could pre-Covid-19 research into coronaviruses have been otherwise? Episode one: Careershttps://www.leidenmadtrics.nl/articles/could-pre-covid-19-research-into-coronaviruses-have-been-otherwise-episode-one-careers2020-07-07T14:00:00+02:002024-05-16T23:20:47+02:00Could coronavirus-related research (CRR) pre-Covid-19 have been otherwise? In this series we examine pre-pandemic publications in CRR, asking how issues of careers, funding, and geopolitics may have affected the state of knowledge in CRR. Ep.1: Careers.Months into the corona crisis we are living in a world changed, for better or worse things are other than they once were. It is obvious many countries were underprepared, but does it make sense to ask—could this have been otherwise? Indeed, this is a prodigious question, one unlikely to be answered comprehensively by a blog post. Still, it is the goal of this short series of blog posts to reflect on one small portion of this almost overwhelming question. In our first installment we reflect on pre-pandemic research funding for coronaviruses (like SARS) and its impact on research careers in an attempt to understand how these potential pieces might fit into the larger puzzle that is the corona crisis.

                There were warnings. Public health officials, epidemiologists, and researchers of coronaviruses cautioned the world for years of a looming global pandemic. In 2018—the hundredth anniversary of the Spanish flu—the WHO held a discussion entitled: Are we ready for the next pandemic?. Their answer: an emphatic No. Despite these warnings as well as warnings of corresponding global recession, research on coronaviruses (similar to public health research more broadly) remained underfunded. The small research field suffered from a boom-and-bust cycle, corresponding to the two previous outbreaks. First with SARS in 2002 and again in 2012 with the MERS outbreak, funding of coronavirus related research (CRR) increased in response to the outbreak and waned thereafter. This cycle becomes clear when visualizing CRR publications over time (see Figure 1 below)—in 2019 CCR was, again, on the decline.

                Fig. 1: Trend in number of publications in the field of corona related research, Web of Science, 1981-2019

                We were unsatisfied by this generalized observation and sought to dig deeper into pre-Covid-19 funding for CRR in order to gain a detailed overview of the funding available (see Figure 2). Following the definition as applied in the work of Colavizza et. al, we selected all publications from Web of Science containing the relevant terms in their titles and abstracts to identify a set of publications on CRR and investigated how many of these CRR publications contained explicit funding acknowledgements.

                Fig. 2: Trend in number of publications in the field of corona related research (CRR) containing funding acknowledgments, Web of Science, 2010-2019

                Upon first inspection one sees a field with a high percentage of (externally) funded research. This high-level of funding was unexpected as it, initially, seems to contradict claims of CRR being underfunded. Yet, we asked ourselves: are there perhaps other explanations? When compared to other scientific fields, like cardiology (known to be well-funded, see Figure 3 below), CRR has a markedly higher percentage of research with funding acknowledgements.

                Fig. 3: Trend in number of publications in cardiology research containing funding acknowledgments, Web of Science, 2010-2019

                We suggest one potential reason for this trend could be that the field lacks support from the kinds of sustained institutionalized funding (not usually acknowledged in a publication) from which well-funded fields like cardiology may benefit and, thus, relies heavily on external grant-based funding. Potentially, reliance on this type of—often temporary and precarious—funding mechanism could have created many difficulties in the building of sustained research lines on coronaviruses.

                Science and evaluation studies have shown the type(s) of funding available to a research field can have great effects on many aspects of its research, such as: the amount of research being conducted; the type(s) of research valued; or the viability and desirability of a career in a certain (sub-)field. Interestingly, some coronavirus researchers themselves describe the field before the crisis as one largely shaped by the waxing and waning of interest in coronaviruses, which led to knowledge gaps in fundamental research and unstable career trajectories for researchers attempting to build a career in coronaviruses. These researchers claimed those in the field struggled both to justify their continued research to funding bodies and to establish themselves in the field, leading many to choose a research path outside of it. They contend this early-stage exodus of researchers from the field produced a distinct career stratification with a very minimal middle-stage stratum.

                Building upon our examination of pre-pandemic coronavirus funding and the assertions of these coronavirus researchers, we decided to look deeper into their claims by analyzing CRR careers via publication trends in relation to academic age of pre-pandemic coronavirus researchers—with academic age (i.e. amount of years since a researcher’s first publication in CRR) acting as a proxy for the amount of years a researcher remained active in CRR. Our preliminary findings seem to support their claims, displaying atypical field characteristics.

                Fig. 4: Connecting career stages to CRR related output shares, Web of Science, 1981-2019.

                As visible in Figure 4, one can discern a large cohort of young scientists, who appear to be publishing most of their work in the field; a number of well-established, long-term researchers, who have only a share of their research in the field; and a noticeable absence of cohorts in between. In most research fields one could expect to track multiple cohorts of researchers as they move through their research careers, but this movement appears to be absent in pre-pandemic CRR. Instead, it seems a large majority of starting researchers disappear from CRR after their first 4 to 7 years and few publications, suggesting, after their PhD or post-doc, these researchers move to other areas or leave research altogether. Another interesting trend is noticeable amongst the established researchers, who seem to only have a modest share of their output (less than 10% of their total output) in CRR. Although comparisons with other fields of research are needed to further substantiate these findings, they indeed suggest building a sustained career on CRR alone is very difficult—or at the very least unlikely to happen. Furthermore, our findings are indicative of a field brimming with uncertainty and instability—qualities that seem counterproductive for understanding a group of deadly viruses.

                For now, the questions remain: What do these initial findings mean? What could we as a society have done differently? And, if something is to be gained: How can we perhaps learn from our mistakes in order to be better prepared in the future? There are many more viruses in existence with pandemic potential—coronaviruses are just one of them. In addition, let us not forget there are many common,  harmful pathogens that remain disproportionately understudied and underfunded—particularly those occurring mostly outside the global North (e.g. Tuberculosis, Malaria and Ebola). Learning how to better research and respond to these threats may also necessitate a long, hard look at what types of research on pathogens is deemed worthy of funding and why, with particular attention given to their geographies.

                Much more research is urgently needed. For our next episodes, we are working on deepening our exploration into pre-pandemic funding of CRR and its effects on both the structure and knowledge production potential of coronavirus research. This blog post is meant to be provocative, not conclusive. As our explorations into the peculiarities of CRR in relation to research careers and funding are only tentative, it is our hope that this provocation invites you to join us in the discussion. So, we leave you with some important questions: What do you think this means? Could certain systematic issues of how research is funded and how careers can (or cannot) be built on particular topics have made a crucial difference in the pre-pandemic state of our knowledge on coronaviruses? Could it have been otherwise?

                A note from the authors: a full academic version of the blogpost with further explanations of the material can be received from the first author upon request.

                ]]>
                Sarah Rose BieszczadJochem ZuijderwijkThed van Leeuwen
                COVID-19 research in the news: Visualizing the sentiment and topics in science news about the pandemichttps://www.leidenmadtrics.nl/articles/covid-19-research-in-the-news-visualizing-the-sentiment-and-topics-in-science-news-about-the-pandemic2020-07-06T15:24:00+02:002024-05-16T23:20:47+02:00Every day news outlets around the world play a central role in disseminating the latest COVID-19 research. In this post, we discuss the impact of COVID-19 findings on the news by applying state-of-the-art sentiment analysis and present some interesting preliminary results, stay tuned!There are many reasons why we should be concerned with how science is portrayed in the news media, particularly given the ‘infodemic’ related to COVID-19. For example, over-hyped research results can lead to misinterpretation that may contribute, among other things, to public skepticism and distrust towards science. Because of that, we began to wonder how we could start the exploration of the news reception about the science related to the pandemic. More specifically, we decided to explore the potential of natural language processing (NLP), which incorporates sentiment analysis as an important indicator of expression of news media sentiment about COVID-19 findings. As a disclaimer, the analysis presented in this blog post should be seen as a preliminary exploration on how sentiment approaches can be implemented in the study of the reception of scientific content in social and news media outlets.

                In our experiment we used an existing dataset of scientific publications related to research on COVID-19 updated up to April 24th, 2020 and matched it with data by Altmetric.com (Figure 1). From this dataset, we selected publications related to the pandemic as indicated by the WHO or Dimensions. Since our analysis focused on texts, we filtered out publications without an abstract. Also, from the data obtained from Altmetric.com we removed news articles that did not come with a summary text (this summary typically contains about the first 250 characters of the news media text). We ended up with a dataset of 1,910 publications with an abstract and mentions in 38,611 different news media posts.

                The Sentiment Analysis

                To obtain the sentiments apparent in the news articles, we used a sentiment extraction transformer built on top of BERT (Bidirectional Encoder Representations from Transformers) (See Vaswani et al, 2017). We use the bert-base-multilingual-uncased-sentiment model, which is trained in six different languages: English, Dutch, German, French, Spanish and Italian, and is fine-tuned on a set of 500,000 product reviews with sentiment labels ranging from 0 to 4, where 0 is a bad review and 4 is a good review (the pretrained model can be accessed here). Thus, sentiment scores range between 0 and 4 and can be interpreted as follows: 0=‘very negative’, 1=‘negative’, 2=‘neutral’, 3=’positive’, 4=’very positive’.


                Figure 1
                . The figure illustrates the process of cross-matching WHO/Dimensions COVID-19 data with Altmetric.com data to extract news sentiment for different publication topics. Bert-based sentiment classifier is used to extract sentiment of news posts, initially at the sentence level, and then at the levels of news posts and publications.

                How has the science around COVID-19 been received in the news?

                To get a sense of how well BERT dealt with topics related to COVID-19 research in the news we plot a term map of the most commonly co-occurring terms in scientific articles. Then, we overlay the average BERT sentiment scores of news corresponding to each paper in the dataset in order to represent the sentiment of news items around COVID-19 research. As we can see, BERT seems to be able to identify paper topics related to solutions like vaccines and treatments as more neutral/slightly positive news media pieces. On the other hand, articles on the topic of symptoms such as fever, hypertension, and policy measures to control the virus are more negatively reported in the news.

                Term map - This visualization illustrates a co-occurrence map of the most common terms that are used in titles and abstracts of the selected papers. Warm colors (red) indicate where the positive attention of the media has focused on, while cool colors (blue) indicate negative attention. Terms such as “fever” and “vaccine” are among the most commonly used terms, and also “drug”, “clinical trial”, “antibody”, and “control measures” can be seen among the more frequently used terms. News talks positively about publication topics related to vaccines, antibodies and drugs, while talking about control measures and fever news posts tend to have a more negative sentiment.


                We also analyzed the temporal dynamics of the news items and aggregated the average sentiment of the sentences of all the news on a given day (Figures 2 and 3). The number of news items around COVID-19 related scientific publications has increased over time, particularly from mid-March onwards, a pattern that has also been observed for Twitter, other social media sources, and in The Conversation. During the period of higher news activity (March-April), the mean sentiment scores oscillate between slight negativity (1.5) and neutrality (2) (Figure 2).

                Figure 2. Trend analysis of the number of distinct news items regarding COVID-19-related publications and their average sentiment score.

                In Figure 3 we show the aggregated sentiment scores at the month-level to show the overall increase of the sentiment inferred from the news items from the early months to the more recent ones.

                Figure 3. Box plot analysis of the sentiment score of the sentences from news items mentioning COVID-19 research per month of publication of the news items .

                Another interesting piece of information recorded by Altmetric.com are the sources of the news items. This enables the study of the type of sentiments expressed by the different news items providers (Figure 4).

                Figure 4. Top 35 news outlets characterized by the average sentiment in their news items.

                Interestingly, some of the most popular news outlets related to medical research (e.g. MedicalXpress,The Conversation or Medscape) exhibit values very close to 2, suggesting a high degree of neutrality in their dissemination of COVID-19 science related news. In contrast, business-related news outlets (Business Insider - Malaysia, Singapore, Australia, India or the Netherlands) tend to have a more negative sentiment in their news items, perhaps due to the negativity around the critical economic situation caused by the pandemic. Other news aggregators such as Yahoo! News, MSN, or Google News also exhibit rather negative sentiments, which is in line with news media such as the New York Times, CNN News or The Guardian. An interesting exception is the conservative channel Fox News, with a fairly positive coverage of the research around the pandemic.

                What did we learn from this exercise?

                This is a first analysis of the sentiment of news items covering scientific articles about COVID-19. Overall, we observe a slight increase in the neutrality of news as they move from a slightly negative sentiment in the early months to a more neutral sentiment of scientific findings. On average, paper topics related to solutions like vaccines and treatments tend to be more neutral or positively treated in the news, while paper topics about transmission and control measures are more negatively disseminated. Medical-related news sources tend to present more neutral views, while generalistic and business-related news outlets write more negatively about scientific research related to the virus.

                However, this exercise is by no means in its final stages. Given the lack of abstracts in many of the publications and occasionally of summary text from news items, we could only study a limited selection of publications and news media items. In the future we will consider larger sets of publications and news media items. Another concern is that we used an already trained BERT model fine tuned for sentiment analysis on product reviews, and used it for classifying news items about research. While models like BERT can be generalized to different contexts (especially social media), we could have obtained state-of-the-art classification by fine tuning the model with a corpus of research articles about COVID-19 and related news items instead.

                Nevertheless, BERT reveals interesting findings that we think are worth sharing in this blog post. It also shows the potential of Machine Learning such as text classification for further studying and characterizing the online and social media reception of scientific outputs. Tips on improvement would be greatly appreciated!

                Acknowledgements

                We thank William Schueller and Jonathan Dudek for their helpful comments on an early version of this blog post.

                ]]>
                Márcia R. FerreiraBijan Ranjbar-SahraeiRodrigo Costashttps://orcid.org/0000-0002-7465-6462
                From ‘fund and forget’ to formative and participatory research evaluationhttps://www.leidenmadtrics.nl/articles/from-fund-and-forget-to-formative-and-participatory-research-evaluation2020-07-03T16:30:00+02:002024-05-16T23:20:47+02:00A trend in research evaluation is to include stakeholders as active partners in the evaluation process. In June, CWTS organized an online workshop to explore novel evaluation approaches and to identify possibilities and limitations for co-production in research evaluation.“Fund and forget”, that is how Jordi Molas-Gallart from the research centre Ingenio (CSIC-UPV) in València teasingly characterized the way large national research funders often operate. It’s also a point of departure for thinking about new ways of research evaluation. The cornerstones of many forms of research evaluation are peer review and bibliometric analysis. Interestingly, peer review as practiced by evaluation committees, on closer inspection typically consists of judgement based on intimate entanglement of peer review and information based bibliometric indicators, to the point that the two are often hard to separate.

                What research evaluation currently looks like is relatively clear, the road ahead is a little less so. But there is a shift visible towards formative and participatory forms of evaluation. One key assumption in those new approaches is that the traditional distinction between research evaluators, the organisations they are evaluating and societal stakeholders can no longer hold: intensive interactions between the three can help to make evaluations more relevant, more productive and more effective in terms of learning. Co-production models stress the need for contribution from stakeholders throughout the whole evaluation process, with the aim of creating synergy between the various people and groups involved. And ideally the use of a co-production model results in stakeholders experiencing a shared responsibility for the outcomes.

                How stakeholder involvement or ‘co-production’ works out in practice was the topic of an online workshop, organised on June 4th by CWTS, as part of its ‘Responsible Evaluation’ and ‘Engagement and RRI’ thematic hubs. The close to thirty participants were drafted from CWTS and various (research) organisations involved in or thinking about research evaluation.

                The workshop started with three brief presentations about ‘new’ forms of evaluation. Pierre-Benoit Joly (INRA) introduced a novel method for real-time assessment of research impact, building on the ASIRPA tool that has become mainstream in the French agricultural research institute INRA. Jordi Molas-Gallart (Ingenio, CSIC-UPV) introduced a formative approach to the evaluation of transformative innovation policy. Tjitske Holtrop (CWTS) introduced the main principles of Evaluative Inquiry, a multi-method approach to analyse the interaction between knowledge production and societal practices. In breakout rooms participants focused on the (possible) role of societal stakeholders in evaluation, which brought about discussions in many directions.

                More questions were raised than answered, as expected in a field that is contested and quickly developing. For example, there seems to be a blurring of boundaries between formative evaluators and co-creation partners. And if the distance between evaluators and research performers gets smaller, does that leave enough room for ‘independent’ critical feedback? Or should we define an inner and outer circle of stakeholders that are differently involved in research evaluation? If a research organisation has only a single large stakeholder, which also is involved in evaluating that organisation, questions of academic freedom or conflicts of interest may arise.

                Or should we even go beyond involving stakeholders as additions to evaluation, and instead thinking about mutual benefits by the continuous inclusion of relevant stakeholders with the research? Then a co-production type of evaluation may become real-time, instead of ex post or ex ante. In such a configuration, one can even wonder what the difference is between an evaluator and a partner in knowledge co-production.

                Some research funders are experimenting with ex ante involvement of stakeholders in reviewing research proposals, but this is not widespread and review is still dominated by the scientific community.

                We hope that this initial workshop can function as a stepping stone towards a broader dialogue about the opportunities and limitations of formative and participatory research evaluation. The feedback we received from participants suggests that there is a need for more debate and exchange.

                As a direct follow-up we consider to organize workshops on more specific themes in this area, such as:

                • How to deal with relationships between scientific and societal value in institutional research evaluation?
                • What are the opportunities of formative and participatory methods in natural sciences versus social sciences and humanities?
                • What is the potential of real-time impact assessment for research funding programmes?

                The original blog post included a paragraph about the Dutch Strategy Evaluation Protocol (SEP), but that was removed because it unintendedly suggested that the SEP does not encourage involvement of stakeholders.

                ]]>
                Rinze BenedictusLaurens HesselsIsmael Rafolshttps://orcid.org/0000-0002-6527-7778Ingeborg Meijer
                Why openly available abstracts are important — overview of the current state of affairshttps://www.leidenmadtrics.nl/articles/why-openly-available-abstracts-are-important-overview-of-the-current-state-of-affairs2020-06-30T10:45:00+02:002024-05-16T23:20:47+02:00Openness of the metadata of scientific articles is increasingly being discussed. In this blog post, Aaron Tay (SMU Libraries, Singapore Management University), Bianca Kramer (Utrecht University Library), and Ludo Waltman (CWTS, Leiden University) discuss the value of openly available abstracts.This post was originally published at Medium

                The value of open and interoperable metadata of scientific articles is increasingly being recognized, as demonstrated by the work of organizations such as Crossref, DataCite, and OpenCitations and by initiatives such as Metadata 2020 and the Initiative for Open Citations. At the same time, scientific articles are increasingly being made openly accessible, stimulated for instance by Plan S, AmeliCA, and recent developments in the US, and also by the need for open access to coronavirus literature.

                In this post, we focus on a key issue at the interface of these two developments: The open availability of abstracts of scientific articles. Abstracts provide a summary of an article and are part of an article’s metadata. We first discuss the many ways in which abstracts can be used and we then explore the availability of abstracts. The open availability of abstracts is surprisingly limited. This creates important obstacles to scientific literature search, bibliometric analysis, and automatic knowledge extraction.

                The many uses of abstracts

                The most basic way in which researchers benefit from abstracts is clear: Abstracts provide a summary of an article and are used by researchers to quickly decide whether an article is likely to be of interest. In addition, however, abstracts are also used in a large number of more advanced ways.

                Abstracts of course play an important role in scientific literature search. Databases such as Web of Science, Scopus, and PubMed enable searching in abstracts of articles, and so do many lesser known alternatives (e.g., Scilit and Open Ukrainian Citation Index). Other databases (e.g., Google Scholar) support full-text search, but in many cases (e.g., Dimensions, Lens, and PubMed Central) these databases also offer the possibility to restrict a search to abstracts only, which will give more focused results.

                Lens: Searching for articles based on data from Microsoft Academic, Crossref, PubMed, and CORE

                Discovery tools increasingly make use of text mining features combined with visual user interfaces. Open Knowledge Maps is a prominent example. Iris.ai is another one. These tools group articles based on textual similarity of titles and abstracts and visually show the resulting clusters of articles.

                Open Knowledge Maps: Clustering of articles based on titles and abstracts

                Bibliometric visualization tools such as VOSviewer and CiteSpace perform text mining of titles and abstracts of articles to offer an overview of the literature in a research field. VOSviewer uses text mining to create term co-occurrence maps that show the main topics studied in a field. CiteSpace analyzes emerging trends and research fronts using text mining.

                VOSviewer: Co-occurrence map of terms extracted from titles and abstracts of articles

                Abstracts can also be used to improve the functionality of many library systems, such as library discovery systems like Primo and Summon, research information systems like Pure and Converis, and more. Institutional repository (IR) managers can improve the discoverability of their IR content by enhancing IR entries with abstracts, similar to what CORE has done.

                Some libraries, for instance in Finland, use automated methods for subject indexing of their IR content. This can be done based on titles and abstracts of articles. It doesn’t require full texts. Microsoft Academic for instance uses abstracts, not full texts, for tagging fields of study to articles.

                A different way of using abstracts is illustrated by Get The Research, which aims to help readers, in particular from outside academia, find and understand scientific articles. Titles and abstracts of articles, taken from PubMed, are enriched by adding links to plain language explanations of scientific terms, obtained from Wikipedia. In this case, abstracts have a benefit for a wide audience, also outside academia.

                Abstracts also play a crucial role in systematic reviewing. Literature searches for systematic reviews are usually done in the titles, abstracts, and keywords of articles, and the search results are typically screened (manually and sometimes assisted by machine learning) based on titles and abstracts. Hence, abstracts are essential for high-quality systematic reviewing. An example is the screening of the CORD-19 dataset of COVID-19 related articles using the ASReview tool. However, the fact that abstracts are missing for 22% of the articles in the full CORD-19 dataset, and even for 36% of the CORD-19 articles from 2020, limits the use of the dataset.

                ASReview: Using abstracts to screen articles for systematic reviewing

                The most sophisticated uses of abstracts arguably can be found in the biomedical domain, where the open availability of abstracts in PubMed has spurred innovation. One example is PubMed’s feature for finding similar articles, which compares articles based on their titles and abstracts. Another example can be found in Europe PMC, where the SciLite platform provides annotations of biomedical entities identified in abstracts (and full text, if available) using text mining algorithms. Identification of biomedical entities in abstracts enables computational analyses of associations between these entities. Gene-disease associations have for instance been extracted from abstracts by the LHGDN (Literature-derived human gene-disease network) and BeFree systems and have been made available in the DisGeNET database. In a similar way, researchers have developed algorithms for extracting protein-protein interactions from the abstracts of biomedical articles. Although similar approaches to the use of abstracts for automatic knowledge extraction are also being explored in other fields of research (e.g., materials science), the biomedical domain is clearly ahead of these other fields. This is most likely due to the open availability of abstracts in PubMed.

                EuropePMC: Instructions on using annotations

                As the above examples illustrate, abstracts have many uses. This is true even given the increasing number of articles for which the full text is openly accessible. While it would often be beneficial to have access to full texts rather than just abstracts, such access is unfortunately not yet a given for the full scholarly literature. In many cases, however, it is a deliberate choice to work with abstracts rather than full texts, even when the full text of articles is accessible. This can be for technical reasons, but also because abstracts provide a more focused description of the underlying research. For instance, a recent analysis of the CORD-19 dataset of COVID-related articles showed that only 24% of the CORD-19 articles available in Web of Science include COVID-related terms in their title, abstract, or keywords — restricting to this subset may give more targeted results than using the full dataset.

                Availability of abstracts

                The ways in which researchers benefit from abstracts are quite varied. But are abstracts generally available for the various use cases discussed above?

                Abstracts are mostly freely accessible on publisher websites. This facilitates the most basic use case for abstracts, namely to enable researchers to easily get a general understanding of what an article is about. However, for the other use cases discussed above, having free access to abstracts on publisher websites is not enough. These use cases require bulk access to machine readable abstracts.

                Commercial and proprietary bibliographic databases such as Web of Science and Scopus provide a good coverage of abstracts. However, in addition to the cost of accessing them, they have the limitation of being selective in scope, not covering the full breadth of the scholarly literature. Moreover, they impose restrictions on the number of abstracts that can be downloaded from the database and the way these abstracts can be used. Dimensions is generally less selective and provides free access, but it currently has the disadvantage that abstracts cannot be downloaded. (The Dimensions team informed us that they plan to make abstracts available for download in the near future.)

                Microsoft Academic, which is openly available under an ODC-BY license, provides some hope though. It is pretty comprehensive in scope and is also being used by other databases such as the Lens and Semantic Scholar. However, as Microsoft Academic obtains its data by scraping the World Wide Web, abstracts suffer from some quality problems. In an analysis of abstracts in Microsoft Academic, we for instance found that abstracts are sometimes truncated and that they sometimes include text that actually doesn’t belong to the abstract (e.g., author and affiliation data or the opening paragraph of an article).

                Like Microsoft Academic, PubMed makes abstracts openly available. Since PubMed receives abstracts directly from publishers, the data quality is higher than in the case of Microsoft Academic. However, PubMed has the limitation of being restricted to biomedical research.

                Another cross-domain source of bibliographic metadata, including abstracts, is CORE (COnnecting REpositories) — one of the largest aggregators of research articles harvested from subject and institutional repositories as well as open access and hybrid journals. The data is free to access and for non-commercial purposes the data can also be freely downloaded. CORE content is for instance used in the Lens. The exact coverage of CORE, especially for metadata of paywalled articles, is hard to ascertain.

                Availability of abstracts in Crossref for different publishers (journal content, 2018–2020)


                Finally, an important source of bibliographic metadata is provided by Crossref, a not-for-profit organization that most international publishers work with to register Digital Object Identifiers (DOIs) for their content. Except for some citation data, all metadata in Crossref is openly available. Unlike Microsoft Academic, Crossref receives its metadata directly from publishers, resulting in a higher data quality, and unlike PubMed, Crossref is not restricted to biomedical research. However, although Crossref offers a first-class infrastructure for making abstracts openly available, the actual number of abstracts in Crossref is disappointingly low. At the moment, only 8% of all journal articles in Crossref have an abstract. For recent years, this percentage is somewhat higher (20% for 2018–2020). As shown in the figure above, many publishers do not make abstracts available in Crossref, or they have done so only for a small share of their articles. More detailed information for individual publishers can be found in Crossref’s Participation Reports.

                Example of a Crossref Participation Report (Royal Society of Chemistry, current journal content)

                Making abstracts openly available

                As we have seen, abstracts are of great value for scientific literature search, bibliometric analysis, and automatic knowledge extraction. Innovative uses of abstracts can be found in particular in biomedical fields, which benefit from the open availability of abstracts in PubMed. However, outside the biomedical domain, the lack of a centralized database in which abstracts are made openly available hinders the development of innovative new tools to support researchers. This will inevitably slow down the speed at which researchers come up with new ideas and make new discoveries.

                Microsoft Academic is the most comprehensive open source of abstracts. It is of great value, but it has two limitations. First, since abstracts have been scraped from the Web, they suffer from data quality issues. And second, we don’t know much about the long-term prospects of Microsoft Academic, which depend on Microsoft’s willingness to continue investing in Microsoft Academic and to keep the data open.

                Crossref clearly provides the most promising centralized infrastructure for making abstracts openly available. While this infrastructure is readily available to all publishers working with Crossref, many of them unfortunately do not yet make use of it, perhaps because they are not aware of it or do not see its value.

                Thanks to the Initiative for Open Citations, a large number of publishers have made the reference lists of their articles openly available in Crossref. In the same spirit, we call on publishers to make abstracts openly available in Crossref. Publishers already make the abstracts of articles in biomedical fields openly available in PubMed, so why not use the infrastructure of Crossref to do the same for articles in all fields? By making this small effort, publishers not only give additional visibility to their content, but they also make a large contribution to the benefit of science.

                This post is licensed under a CC BY 4.0 license.

                ]]>
                Aaron TayBianca KramerLudo Waltman
                Evaluative Inquiry I: Academic value is more than performancehttps://www.leidenmadtrics.nl/articles/evaluative-inquiry-i-academic-value-is-more-than-performance2020-06-25T08:00:00+02:002024-05-16T23:20:47+02:00Mainstream evaluation metrics tend to understand academic value as performance while missing other valuable elements of academic value trajectories. This first of four blogposts focuses on the concept of value of the Evaluative Inquiry’s approach to research evaluation.The world of research evaluation is changing. In particular, we observe a growing need in research organizations for interactive, formative and tailor-made evaluation services. In response to this need, a team of CWTS colleagues has developed a new approach in collaboration with Ad Prins that we call the Evaluative Inquiry. Over the past few years this approach has been put to practice in several projects mainly assisting research groups and institutes with putting together the self-evaluation document of the Standard Evaluation Protocol (SEP). On the basis of these experiences, and most notably the projects with the Protestant Theological University and with the University for Humanistic Studies, we want to describe the four underpinnings of this Evaluative Inquiry in a series of blog posts: open-ended concept of research value; contextualization; mixed-method approach; and a focus on both accounting and learning. This first post focuses on our concept of value.

                Both protestants and humanists approached CWTS to ask for help with their self-evaluation. These small universities with diverse workloads and publication cultures combine characteristics of the broad and diverse academic Social Science and Humanities (SSH) domain and have distinct philosophical and spiritual missions. It was a challenge to provide strong proof of their societal relevance and scientific excellence which was demanded by the formal SEP protocol. Their questions about benchmarking, visibility through citation patterns, and “lists” of productivity revealed a worry that their books and carefully crafted single-authored papers weren’t going to demonstrate the vital characteristics of their work.

                In recent years societal relevance was added to the evaluative palette of the SEP protocol, adding performances of academics in the public debate or collaborations with societal stakeholders to the understanding of impact. However, do sermons that staff members of the Protestant Theological University (PThU) occasionally preach count towards impact? And what can be said of the multiple advisory roles in institutions, with research informants, in political parties or the cultural sector that theologians and humanists have, that are often informal and not traceable to reports, media performances or otherwise? These relations are said to be so local and small-scale that they are almost invisible, so what is their impact, and how to count it?

                The problem of the value of academic research, then, for our SSH clients lies in the fact that they understand it in the realm of performance, of impact that can be shown in metrics. However, this reduces the concept of value to measurable achievements and does not do justice to the multiple possible contributions that researchers make both to science and society. Moreover, it understands value as the vehicle for accountability, showing one’s worth according to an external standard of excellence. The Evaluative Inquiry (EI) is, instead, interested in value as the connection between the institution’s mission or research themes and their reception and use by others in the world around the institution. As the EI’s first principle, this focus on “value trajectories” opens up the concept of academic value and moves it away from a focus on citation scores to finding dense and vital activity around research themes and ambitions. This implies that EI does not necessarily adopt the distinction between scientific and societal value of knowledge that has become commonplace in research evaluation. The Evaluative Inquiry draws both on metrics and on qualitative analyses as ways or making these trajectories visible.

                In the first phase of the Evaluative Inquiry with the theologians and humanists we invited them to think about their value as something that goes beyond what can be expressed in performance metrics and the inherent anxiety about how they compare to others that goes along with it. In these exploratory conversations the EI team has spent quite a bit of time explaining this and the benefits of attuning research ambitions, research strengths, and research organizations. For the theologians this brought up the effects they felt of the declining appeal of theology in society and the downsizing of a thriving theological academy to a handful of institutions scrambling for students and research funding. Over time one of the ambitions that ensued from our conversations and analyses was to showcase the multidisciplinarity and spiritual orientations of the PThU while balancing the diverse demands of a small organization on its employees with needs and professional ambitions of the latter.

                To conclude, what is of value and to be valued is not fixed. When clients choose to work with this method, the Evaluative Inquiry takes the time for probing and exploring to find out where their value is and what it looks like. Making visible organizational specifics and ambitions are not meant to better situate performance and productivity metrics, but to expand what can be considered as good academic value. Good academic value, then, goes beyond writing articles and counting citations to also include maintaining organizations and building conversations. This is not to say that we deny the importance and use of performance metrics and accountability; it is a way to expand the stories we consider to be achievements and want to account for.

                Read part II of the series here.

                ]]>
                Tjitske HoltropLaurens HesselsAd Prins
                Monitoring the dissemination of COVID-19-related scientific publications in online mediahttps://www.leidenmadtrics.nl/articles/monitoring-the-dissemination-of-covid-19-related-scientific-publications-in-online-media2020-06-23T12:30:00+02:002024-05-16T23:20:47+02:00Research around COVID-19 has experienced broad public interest, with new findings being distributed in various communication platforms. In this blog post we introduce a monitoring tool for exploring the social media reception of scientific publications on the pandemic.In response to the COVID-19 pandemic, researchers from all over the world and from multidisciplinary backgrounds are working on answers to the challenges raised by the disease. In this regard, the biomedical point of view is also accompanied by broader social, economic and political perspectives. At CWTS, a dedicated research program has recently been initiated, with the aim of engaging colleagues and perspectives from diverse disciplines in the research and discussion of the science-related aspects of the pandemic. The research program has started to produce its first results, including the analysis of funding decisions, peer review, scientometric data sources or the issues related with delineating COVID-19 and coronavirus research, among other questions.

                Broadening the study of the online media response to COVID-19-related research

                Another dimension that we also consider central at CWTS is how the scientific results related to the pandemic are being disseminated and received across online (social) media platforms. Probably, one of the most visible effects of the COVID-19 pandemic has been the surge of news, social media, and online information about the disease, as well as its political, social and health related effects. It is evident that in the interplay of scientists, policymakers, communicators, and society, the pandemic has posed multiple challenges for science communication. As a consequence, there are also many questions that can be studied from a point of view that incorporates means of dissemination different from scholarly communication via scientific publications. At CWTS, we have started to research the Twitter uptake of the science related to the pandemic, the incorporation of these results in Wikipedia articles, and the response by the academic community in the science communication platform The Conversation.

                Monitoring the social media reception of COVID-19-related research

                With the many different questions and challenges arising from the study of online communication around the pandemic, it is impossible to approach all of them from just one perspective. In this situation, a flexible tool for monitoring how research around the pandemic is being disseminated and discussed on social media is necessary. We have developed a dashboard that provides exactly that: the CWTS COVID-19 social media dashboard offers an easy-to-use visual and flexible tool to explore the online media reception of scientific publications related to COVID-19. It can be used by anyone - scientists, policymakers, journalists and science communicators, or citizens - interested in the uptake of scientific publications related to COVID-19 across multiple online and social media platforms.

                Public Tableau dashboard (updated version with data as of January 20, 2021)

                The dashboard offers two main analytical views: trend analysis and scatterplots to explore publications’ social media reception. Filters are implemented to explore the data more flexibly, including different selection of measures, time periods, data source choice, and wildcard match filter to select publications including a specific keyword.

                In the trend analysis dashboard, the different dates refer to the post date of each of the altmetric events considered (e.g., news mentions, blogs citations, tweets, etc.). For each specific date, the number of publications and social media events happening on that date are presented in the dashboard. You also have the option to select the social media source to be plotted, as well as the period of monitoring, and the different databases that are considered in the COVID-19 research related database maintained at CWTS.

                The explore publications dashboard allows for multiple analytical visualizations, by combining each time two different social media metrics, and allowing the same filtering options as above. It is also possible to identify publications with given title keywords, just by typing them (without any wildcard) in the Filter option of the dashboard and pressing Enter. The aim of this dashboard is to provide an exploratory tool that can help identify publications with different types of online reception (e.g., tweets vs. news), being able to characterize them (i.e. the size of the node) by other indicators such as their number of citations, or whether they are recommended in F1000Prime (indicated by red color).

                Data. The dashboard is constructed based on the updated data sources described in Colavizza et al. (2020). Publication data is extracted from the WHO, Dimensions, and CORD19. Social media data is extracted from Altmetric, a company whose mission is to track and analyze the online activity around scholarly research outputs. Twitter data has been re-hydrated by CWTS using the Twitter API. Recommended publications identified via Altmetric can be further explored in F1000Prime. The underlying, aggregated data can be extracted from the dashboard, thus giving the users a possibility for performing their own analysis. The current version contains data updated until 03/6/2020 and stems from more than 123,000 publications related to COVID-19 or Coronavirus. The dashboard covers more than 53,000 publications that have been mentioned at least once by any of the (social media) sources considered (Twitter, blogs, news media, F1000Prime, and Wikipedia). The default visualization set of the dashboard includes more than 26,000 publications from 2020 with social media mentions in this year, although you can modify these parameters.

                Methods & measures. The overall methodological approach is documented in a GitHub repository. The metrics calculated include: citations (from Dimensions.ai), tweets and retweets, blog mentions, news mediamentions, Wikipedia citations, and whether publications are recommended by experts in F1000Prime. Updates of the dashboard are expected monthly (although variations may occur). The latest updates will be reported in the dashboard.

                Use cases

                Below, we present two use cases to illustrate the analytical possibilities of the dashboard.

                The first one is the temporal analysis of the reception on Twitter (Figure 1 below). This figure captures the temporal evolution of original tweets and retweets around COVID-19 related publications, showing how Twitter engagement has reached a stable level after a rapid increase between mid-February and mid-March.

                Figure 1. Temporal evolution of original tweets (dark blue) and retweets (light blue) around COVID-19-related publications

                The second use case (see Figure 2) is observed at the publication level (following the option “Explore Publications”). We have selected publications containing the term “hydroxychloroquine” in their titles. It is possible to see how many of these publications have received substantial attention on Twitter, both in terms of original tweets and retweets (as well as in news media, measured by the size of the circles). Publications that have been recommended at least once in F1000Prime during the period selected are highlighted in red. There is a publication on the top right side of the graph with a very high volume of tweeting activity as well as reception in the news. This is a recent publication retracted in the Lancet due to the inability to replicate its results and the serious concerns related to the veracity of the data and analyses conducted. Interestingly, the paper was recommended in F1000 Prime as captured by Altmetric (and colored red in Figure 2). This example illustrates how social media metrics can play an interesting role in identifying potential publication issues. For example, doubts about the paper and its design were raised already on Twitter as early as May 22.

                Figure 2. Exploration of publications containing the term “hydroxychloroquine” in their titles

                We expect that the broader community can benefit from a flexible and intuitive tool that periodically informs about the social media reception of the science produced around the pandemic. Feedback and suggestions for further improvement are more than welcome. We may incorporate these in updates of the dashboard in the months to come.

                ]]>
                Rodrigo Costashttps://orcid.org/0000-0002-7465-6462Giovanni ColavizzaJonathan Dudekhttps://orcid.org/0000-0003-2031-4616Zhichao Fang
                You couldn't attend the Altmetrics conference? Fear not! We recorded everything you missedhttps://www.leidenmadtrics.nl/articles/you-couldnt-attend-the-altmetrics-conference-fear-not-we-recorded-everything-you-missed2020-06-09T14:00:00+02:002024-05-16T23:20:47+02:00Our generous friends at TIB have created a service to watch all the Altmetrics conference and workshop videos. We are so lucky!This article has been originally published at the TIB Blog.

                At the TIB AV-Portal, we have created a service to watch the Altmetrics Conferences and Workshops. In doing so, we create a long-term archive of the videos, define licenses for reuse, assign a Digital Object Identifier (DOI) for each video and provide the possibility to link the videos in future to the corresponding presentation slides and/or abstracts. We were supported by Catherine Williams from Altmetric.com and the team of the Lab Non-Textual Materials at TIB.

                The Altmetrics Conferences and Workshops are the most prominent events around the world on altmetrics, and have been held annually at different locations since 2014. The Altmetrics Conference focuses on a wider target audience, such as librarians, publishers, researchers and several altmetrics data aggregators and providers. The conference aims to give attendees a chance to hear practical applications of altmetrics data, learn from what others are doing, and discuss the potential challenges and opportunities that these data bring to their organisations.

                The Altmetrics Workshop takes place together with the conference, after having had workshops at the ACM Web Science Conferences in 2012 and 2014. The workshop series sets the focus on researchers to discuss work in progress on altmetrics research. In contrast to the conference, submissions to the workshop are also peer reviewed, and extended abstracts are published on the workshop website (e.g. The 2019 Altmetrics Workshop).

                source: https://doi.org/10.5195/jmla.2017.250

                The TIB AV-Portal is the ideal infrastructure to host, find and reuse scientific videos. The portal’s key unique selling points are the long-term archiving of all videos and the seamless use of DOIs and Media Fragment Identifiers (MFID), which ensure reliable long-term availability and referencing of the videos to the second.

                Would you like to know how research articles are mentioned on Twitter or how altmetrics are related to open science? These are just two examples, and you can start exploring the full video collection on altmetrics here.

                ]]>
                Bastian DreesGrischa FraumannIsabella Peters
                How does a lockdown affect a visiting researcher? Some reflections during the COVID-19 lockdown periodhttps://www.leidenmadtrics.nl/articles/how-does-a-lockdown-affect-a-visiting-researcher-some-reflections-during-the-period-of-the-covid-19-lockdown2020-06-05T15:28:00+02:002024-05-16T23:20:47+02:00In July 2019, I joined CWTS for a one-year research stay. The lockdown due to COVID-19 changed my situation as a visiting researcher quite a bit. While virtual ways of working could make up for some of the constraints experienced, I had to think: what might be the effects on academic networking?In July 2019, I came to Leiden in the Netherlands for a one-year research visit at CWTS. This was possible thanks to a grant by the Graduate Students Study Abroad Program from the Ministry of Science and Technology (MOST) in Taiwan. This grant supports domestic doctoral students to have a research stay abroad. My time in the Netherlands was spent on pursuing two goals: (1) to conduct my PhD research project in the topic of open access (OA) publishing, combining a survey and bibliometrics approach and studying the policy development in European countries, and (2) to visit as many places as possible to broaden my research horizon.

                I still remember why I chose the Netherlands. First of all, CWTS is an excellent research institution in the area of scientometrics and research policy including OA studies, so I could use this opportunity to learn from experts in the field. Second, CWTS has a long history with the institute where I work in Taiwan, the Science & Technology Policy Research and Information Center (STPI). Both CWTS and STPI had conducted some research projects together almost twenty years ago, but somehow the connection was lost for a while. We have similar missions and research agendas, and I believe my research stay can help to revive this relationship and to create more future collaboration opportunities. Third, the Netherlands is located centrally in Western Europe, and there are many important research institutes here. I was looking forward to visiting many places to exchange research ideas and have discussions. Particularly, many academic conferences or workshops are organized by European research institutes or other stakeholders in research policy on an annual basis. In the past, I attended these activities one or two times a year, and every time I needed to find financial support to cover the travel expenses. If I could not find financial support, I only could use hashtags to follow the latest discussions via Twitter to know what was discussed during those conferences. This definitely lacks the opportunity to network with the academic community. Hence, once I knew that I would have this chance to stay one-year as a visiting researcher in Europe, I got very excited. At this point, though, I could not yet foresee how things would unfold…

                Before the lockdown
                In the first six months of my research stay, I tried to seize any possible opportunity for traveling. Last August, I visited a number of organisations in the United Kingdom to learn about the development of OA in the UK: the Wellcome Trust, Jisc, the Institute for Scientific Information (ISI) by Clarivate Analytics, and Loughborough University to obtain different perspectives on this issue from different stakeholders. In the first week of September, I went to Rome, Italy to attend the 17th International Conference of the International Society for Scientometrics and Informetrics (ISSI) as well as the doctoral forum of the conference. This was my first time to attend an ISSI conference and I was very thrilled to see many scholars and peers there. Then, I was invited to go to London to attend the launch event of the Research on Research Institute (RoRI). It was a great opportunity to observe how a new research agenda is formed. Participating in such a big event gave me the chance to get to know more people in the field and think about how to connect this academic community with our institute in Taiwan in the future. During those events, I couldn't help but to think that all these things could not have happened if I had not come to Europe to do my research. Moreover, I started to worry about whether the degree of connection with Europe could be decreasing more or less after I had gone back home. How should I maintain the connections? How should I find more financial support to let me have the opportunity to fly to Europe to attend the academic activities here?

                After the lockdown

                Suddenly, my upcoming trips were forced to be cancelled due to the outbreak of COVID-19. I was supposed to attend the PEERE Conference on Peer Review in March and give a talk at the German Centre for Higher Education Research and Science Studies (DZHW) in April. Not to mention that I also had plans to visit more research institutes in Europe in the second half year of my research stay. The only event that I could still attend in person was the LIS-Bibliometrics conference organized by Leeds University in early March, just before the lockdown.

                It seems that my identity as a “visiting researcher” has less meaning now. I am the “work-from-home” researcher now. To be honest, it is a little disappointing for me. I did not expect this situation happening at all.

                However, I still feel grateful with all the arrangements made at CWTS and Leiden University. Thanks to the infrastructure of the database and the remote connection, I can access the database remotely. We still have the regular group and individual meetings. All the Friday afternoon research seminars remained to take place, in an online form however. One day, I woken up to the realization that there is a bright side of this lockdown as well, similar to what my colleague Eleonora Dagiene said in her blog post. Maybe, when I go back to Taiwan, I can still use this online channel to have discussions with my colleagues at CWTS, and I still can join research seminars on Friday afternoons and feel inspired. The only thing that I will need to overcome is the different time zone.

                Moreover, many courses or lectures are shifting to the online version. For example, the lecture series of Science of Science organized by University of Luxembourg invites many outstanding scholars to give a talk: the presenters are from all over the world, as are the participants. I feel excited about all these new opportunities and connections.

                Reflections

                Nevertheless, I have somewhat mixed feelings about this. Academic communication and interaction will have changed once the lockdowns are removed again. On the one hand, the boundary of geography might disappear. All these conferences, workshops, and seminars perhaps will continue to take place virtually. This will allow people from distant countries to join these activities without having to consider timely or budgetary limits. Those who always had to go on many international business trips may have more time to spend with their families instead of on travelling. Moreover, it is really helpful for carbon reduction.

                However, all the information about online lectures or seminars that I have obtained so far is provided by the acquaintances I made during conferences. This means that the connections and information exchange we are enjoying now are somehow based on the interactions we had in the past. Without meeting each other physically anymore, though, will we still get new such opportunities during virtual meetings? I doubt it.

                This pandemic makes us re-think the meaning of globalization in academia. If online courses and virtual conferences become the future norm, will it increase or decrease the degree of scientific collaboration? Although I personally prefer having traditional face-to-face discussions, I do benefit from the online discussions. However, I am wondering whether this virtual way of working will actually contribute to increasing access to academic knowledge for those from developing countries. While researchers from developing countries may not need to worry about the issue of affordability of traveling or living abroad, new disparities might be created as well. Those could be an immediate consequence of less face-to-face connection, confining possibilities for enlarging one’s academic network. Would this mean that we will have smaller circles in academia in the future? I do hope that this will not be the case, and that we will find ways for inspiring (new) collaborations regardless of more virtual interactions.

                ]]>
                Carey Ming-Li Chen
                Exploring the COVID-19 discourse in “The Conversation”https://www.leidenmadtrics.nl/articles/exploring-the-covid-19-discourse-in-the-conversation2020-06-02T15:00:00+02:002024-05-16T23:20:47+02:00The current pandemic has revealed a pressing demand for accessible and reliable science communication. Platforms such as “The Conversation” can help by enabling experts to communicate research to the public. Here, we explore the topics that became prevalent in this medium in the context of COVID-19.The COVID-19 pandemic currently striking the world is accompanied by the marked necessity of communicating reliable and understandable scientific knowledge around the disease. In this situation, the complexity of the scientific language may not necessarily be accessible to the broader public. This makes it necessary to have communicators and scientists able to translate the implications of scientific work for our everyday lives. The Conversation is a news platform that is tailored for that purpose. It aims to provide the public with a scientific perspective on current issues by giving academic authors the opportunity to contribute with articles in a more journalistic style. These authors need to have proven expertise in the range of topics they are writing about. Articles can be directly accessed on the platform for free, but may also be republished by other news outlets. This makes The Conversation a unique open platform for discovering and more easily accessing scientific research.

                Launched in Australia in 2011, The Conversation has since then grown further. Other regional outlets followed, focusing on the continent of Africa, the US, the UK, Canada, Spain, France, Indonesia, and New Zealand. A global edition exists as well. All these editions operate on a non-profit basis, funded by several research organizations and foundations.

                The considerable attention that COVID-19 has received in scientific research and the media is also reflected in the selection of topics covered by The Conversation. By the end of April 2020, we web-scraped all articles from The Conversation website published in 2020 (returning 5,318 articles until week 17). Among those, we identified all articles that include a direct mention of “COVID-19”, “Coronavirus”, or “SARS-COV-2” in the article keywords. This resulted in a total of 1,979 articles. Figure 1 compares the number of articles overall to the number of articles about COVID-19. The uptake of articles on COVID-19 is quite remarkable. In the later weeks of March and of early April, more than half of the articles have directly referred to the disease.

                Figure1 theconversation
                Figure 1. Total number of articles in 'The Conversation' and number of articles related to COVID-19. Time frame: Jan 01-Apr 19, 2020.

                This large volume of articles referring to COVID-19 turns The Conversation into a unique source for studying the broader dissemination and impact of research conducted in the context of the disease. This made us wonder: What are the most prominent topics in the discussion of COVID-19 that have been put forward in The Conversation?

                Exploring the words in the full texts of articles referring to COVID-19, we took into account articles in English and focussed on two regional editions: The UK (354 articles), and Africa (108 articles). Based on the terms extracted, we created term maps with the help of VOSviewer. Visualizations made with this software reveal the connectedness of terms: The distance of two terms in the visualization represents how often they co-occur in articles. On the other hand, the overall presence of a term is represented by the size of its label. Furthermore, VOSviewer groups terms into thematic clusters.

                What did we find? Figure 2 shows a visualization of all terms from the UK subset.

                UK Figure 2 nolines downsized
                Figure 2. VOSviewer term map based on COVID-19 related articles in the UK edition of 'The Conversation'.

                Four clusters become apparent in the UK edition. Starting with the green cluster on the left, we find terms related to the virologic and epidemiologic aspects of COVID-19 (see figure 3), including terms like “infection”, “patient”, or “immunity”.

                Figure 3 1200
                Figure 3. Stand-alone image of the 'virologic & epidemiological cluster', UK edition.

                The blue cluster on the right is concerned with the economic impact of COVID-19 and the national lock-down – see figure 4; it includes terms such as “business”, “money”, or “economy”.

                Figure 4 blue 1200
                Figure 4. Stand-alone image of the 'economic cluster', UK edition. 

                Spread in between the blue and the green cluster is the yellow one – which may be related to the political discourse around COVID-19 (see figure 5), with terms such as “governance”, “leader”, and “party”.

                Figure 5 yellow
                Figure 5. Stand-alone image of the 'political cluster', UK edition.

                This placement of the ‘political cluster' between the other clusters seems quite plausible, given the role of politics as a broker between the medical and clinical necessities required due to the disease, and the ensuing socio-economic implications. Finally, the red cluster at the top of the map contains terms that are related to the more social aspects of COVID-19 and the effects of the lock-down on people (see figure 6), with terms such as “friend”, “interaction”, or “mental health”.

                Figure 6 1200
                Figure 6. Stand-alone image of the 'social cluster', UK edition.

                Interestingly, the picture evident with the UK changes when conducting the same analysis for the African edition of The Conversation (see figure 7).

                Figure 7 Africa all
                Figure 7. VOSviewer term map based on COVID-19 related articles in the African edition of 'The Conversation'.

                Here, we also find four clusters, but the cluster focusing more on the disease itself (in red, on the left, figure 8) and the economic cluster (in green, on the right, figure 9) are more dominant than in the case of the UK.

                Figure 8 Africa red
                Figure 8. Stand-alone image of the 'disease cluster', African edition.

                Furthermore, the more social aspects of the measures taken against COVID-19 are more strongly interwoven into the economic terms (see figure 9) than is the case with the UK, where the social aspects formed into a cluster of its own.

                Figure 9 green
                Figure 9. Stand-alone image of the 'economic cluster', African edition.

                One should keep in mind, though, that the African edition has issued fewer articles than the UK edition in the time period observed. Thus, the results described may (also) be artifacts of the activity of the different editions.

                Finally, we can also inspect when which terms were most prominent over time (see figure 10). While terms directly related to COVID-19 and its outbreak dominated earlier this year, we observe that the focus has later on shifted to the socio-economic implications.

                Figure 10 time
                Figure 10. Prevalence of terms over time (days from 2020), visualized with the VOSviewer overlay visualization. Darker colours indicate that the average publication day in 2020 on which a term has occurred in articles has been earlier; lighter colours indicate more recent days. African edition.

                What can we learn from all this? The different clusters that became apparent in the analysis show that COVID-19 brings about challenges in different contexts – and it shows: these challenges found their way into a science-oriented discussion, at least in The Conversation. Furthermore, the differences in the coverage of the UK and the African edition call attention to account for the different needs raised by different communities in the wake of the pandemic. We plan to further investigate this, possibly spotting some of the hot/cold topics that may become apparent when taking different geographical perspectives. Finally, the dimension of time may further provide insights into the development of the discussion.

                We believe this inquiry holds value in two ways: First, we learn about the medium The Conversation itself. Which topics are covered, how does it react to, adopt and contribute to the ongoing scientific discussion around COVID-19? Such an understanding could constitute a powerful use case for contemporary science communication. Then, novel perspectives on science (as, e.g., disseminated around COVID-19) may be expected as well: As far as The Conversation articles include references to scientific publications, we may learn more about these studies, given how they are contextualized here. But that is up to another blog post…

                ]]>
                Jonathan Dudekhttps://orcid.org/0000-0003-2031-4616Rodrigo Costashttps://orcid.org/0000-0002-7465-6462
                Comparing bibliographic data sources: Q&Ahttps://www.leidenmadtrics.nl/articles/comparing-bibliographic-data-sources-q-a2020-05-29T12:00:00+02:002024-05-16T23:20:47+02:00Last week CWTS researchers Martijn Visser, Nees Jan van Eck, and Ludo Waltman published the paper 'Large-scale comparison of bibliographic data sources: Scopus, Web of Science, Dimensions, Crossref, and Microsoft Academic'. In this post, the authors answer ten questions about their work.Your paper is based on a huge amount of data. How did you manage to get access to so much data?

                In the internal database system of CWTS, we have access to the raw data of Scopus, Web of Science, Dimensions, Crossref, and Microsoft Academic. CWTS is probably the only center in the world that has access to all this data, so we are in a unique position to compare the different data sources. Getting access to data from Crossref and Microsoft Academic is easy, since their data is openly available. Anyone can get access to their data. In the case of Scopus and Dimensions, CWTS is in the fortunate situation to receive their raw data for free for research purposes. (Note that Scopus and Dimensions both offer possibilities to scientometric researchers to get free access to their data. See here for Scopus and here for Dimensions.) Web of Science is the only data source for which we pay. CWTS has a paid license that enables us to use Web of Science data in our research.

                Why don't you have access to the full Web of Science database?

                Web of Science comprises a number of different citation indices. The Web of Science license of CWTS covers the Science Citation Index Expanded, the Social Sciences Citation Index, the Arts & Humanities Citation Index, and the Conference Proceedings Citation Index. It doesn’t cover other citation indices, such as the Emerging Sources Citation Index and the Book Citation Index. To get access to these citation indices, CWTS would have to pay more to Clarivate Analytics, the producer of Web of Science. For future comparative analyses of bibliographic data sources, we hope that Clarivate is willing to grant us free access to the full Web of Science database.

                In addition to scientific documents, Dimensions also covers grants, data sets, clinical trials, patents, and policy documents. Why didn’t you include this content in your analysis?

                The focus of our analysis is on scientific documents. While we recognize the value of other types of content, this content falls outside the scope of our analysis.

                Why didn’t you include Google Scholar, OpenCitations, and the Lens in your analysis?

                Google Scholar was not be included because data at the scale required for our analysis is impossible to obtain from Google Scholar. We refer to recent work by Alberto Martín-Martín and colleagues for a comparison of Google Scholar with other data sources. OpenCitations currently obtains most of its data from Crossref. For the Lens, our understanding is that most of the data is obtained from Microsoft Academic. Since Crossref and Microsoft Academic are included in our analysis, the added value of including OpenCitations and the Lens seems limited. However, this is likely to change in the future, when OpenCitations and the Lens become more independent data sources. In future analyses, OpenCitations, the Lens, and others, such as the OpenAIRE Research Graph, definitely deserve close attention.

                In your paper, you analyze documents published in the period 2008-2017. Why didn't you include more recent documents in your analysis?

                Processing all data required for our analysis was a huge effort that took a lot of time. The first steps of the analysis were taken in 2018. This explains why documents from the most recent years are not included.

                In your paper, you acknowledge feedback from the various data providers. How much influence did they have on your work?

                We invited all data providers to offer feedback on an earlier draft of our paper. This is a standard policy of CWTS for studies in which we analyze and compare scientometric data sources. By inviting data providers to give feedback, we offer them the opportunity to clarify misunderstandings and misinterpretations and we improve the quality of our work. Our paper has benefited significantly from the feedback received from data providers. The interpretation of our findings has become more nuanced, and a number of ambiguities have been resolved. Of course we make sure that data providers don’t influence our work in problematic ways. Of the comments made by data providers, we use the ones that we agree with to improve our paper. We disregard comments that we do not agree with.

                You report a number of competing interests in your paper. Are you sufficiently independent?

                As reported in our paper, CWTS has commercial relationships with a number of data providers. However, we believe this has had no influence on our paper. We have been able to work in a completely independent way.

                CWTS supports the Initiative for Open Citations (I4OC). What do we learn from your paper about the successfulness of this initiative?

                CWTS indeed supports I4OC, an initiative that aims to convince publishers to make the reference lists of articles in their journals openly available in Crossref. The figure shown below, taken from our paper, shows that I4OC has only partly been successful. While Web of Science, Dimensions, and Microsoft Academic have a large overlap with Scopus in terms of citation links, Crossref can be used to obtain only 42% of the citation links in Scopus (for citing and cited documents that are indexed both in Scopus and in Crossref). This is partly due to publishers that do not deposit reference lists in Crossref. It is also partly caused by publishers such as ACS, Elsevier, and IEEE that do deposit reference lists in Crossref but that choose not to make these reference lists openly available.

                The main focus of the comparative analysis presented in your paper is on the number of documents covered by the different bibliographic data sources. Is this the right way of comparing data sources?

                In our paper, we focus on the coverage of bibliographic data sources and the quality of citation links. Coverage is an important aspect in a comparison of bibliographic data sources. However, as we acknowledge in our paper, there are many other important aspects as well, such as the completeness and accuracy of the data, the speed of updating, the way in which the data is made available (e.g., web interfaces, APIs, data dumps), and the conditions under which the data can be used (e.g., paid or free, with or without restrictions on reuse). Some of these aspects were discussed in a recent special issue of Quantitative Science Studies.

                Based on your work, which bibliographic data source do you recommend to use?

                It is not possible to provide a general recommendation. Each data source has pros and cons. Which data source can best be used needs to be decided on a case-by-case basis. Comprehensiveness and selectivity often play a key role in such a decision. On the one hand, we like the focus of Dimensions and Microsoft Academic on comprehensiveness. However, sometimes there is a need to be selective, and therefore we believe there is value in filters such as those provided by Scopus and Web of Science. A key question for any data source is how a comprehensive coverage of the scientific literature can be combined with a flexible set of filters that enable users to make selections of the literature.

                ]]>
                Martijn VisserNees Jan van Eckhttps://orcid.org/0000-0001-8448-4521Ludo Waltman
                Elsevier and the Dutch Open Science goalshttps://www.leidenmadtrics.nl/articles/s-de-rijcke-cwts-leidenuniv-nl2020-05-20T15:37:00+02:002024-05-16T23:20:47+02:00The VSNU, NFU, NWO and Elsevier have announced a national deal that bundles Open Access and data services. Is the deal consistent with Dutch Open Science goals, and will undesirable platform effects be avoided?Yesterday it was announced that the Association of Universities in the Netherlands (VSNU), the Netherlands Federation of University Medical Centres (NFU), the Dutch Research Council (NWO) and Elsevier have reached a national deal that includes Open Access publishing and reading services. The deal had been long in the making, and the road was bumpy. An important feature of the deal is that it moves beyond Open Access: it is also an agreement about the joint development of new research intelligence services. The bundling of Open Access and data services was formally announced in December, but the news leaked a month earlier. The contract with Elsevier has been made publicly available, except for the financial agreements made.

                Because of this link between access and research intelligence services, the VSNU, NFU and NWO installed an expert Taskforce at the beginning of 2020 to “address issues around the responsible use of research information and the role of commercial third-party providers in particular.” I am a member of the Taskforce. The relevance of the Taskforce is explained in our assignment:

                “There is an emerging market for third party providers offering services to satisfy the growing demand for research information and evaluation. Using large scale data collection, aggregation and analysis, these services provide new prospects for assisted decision making on, for example: - funding opportunities, - publishing venues, - identifying upcoming research fields, - alternative metrics. As critical functions of the scholarly enterprise become increasingly dependent on such services, it is critical that the academy itself carefully considers risks involved in becoming too dependent on specific market players and their tightly integrated solutions. The increasing interwovenness of information about research (research intelligence) and research itself raises a number of challenging issues both for users and for producers of this information.”

                Two important aims of the Taskforce are to:

                • Establish a set of terms and conditions under which metadata of public research output can be (re)used and enriched by public and private organizations, in accordance with research ethics and public values and avoiding undesired network or platform effects
                • Describe the concept of an Open Knowledge Base (OKB), in which an open infrastructure is developed in cooperation with private parties for the responsible management of research information and data, consistent with Dutch Open Science goals

                An open consultation is currently underway on the Guiding Principles the Taskforce formulated for collaboration between Dutch research institutions and third-party organizations in developing new services based on (meta)data use. We have formulated principles on 1) Ownership of (meta)data; 2) Enduring access; 3) Trusted and transparent provenance; 4) Interoperability as part of community owned governance; 5) Open collaboration with the market; and 6) Community owned governance. These principles have also been offered to the steering committee of VSNU, NFU and NWO, who were responsible for the negotiations with Elsevier.

                In cash, or in kind?

                So what exactly does Elsevier get with this deal? And how does the deal hold up when compared to our Guiding Principles?

                To begin with, it is definitely laudable that Elsevier committed to a set of collaboration principles, including data ownership (researchers and/or institutions own their own research data), interoperability, and institutional discretion on the use of the services. But there is also cause for concern.

                The contract mentions examples of potential pilots to develop research intelligence services. The first potential pilot, for example, aims to “[i]mprove findability and visibility of NL research outputs by aggregating and deduplicating separate CRIS systems into a Pure Community module available to all institutions which can serve as a building block to a NL open knowledge base.” (p. 103)

                As part of a community-owned Open Knowledge Base, such a pilot does not seem acceptable to me. I can well imagine the interest research institutions may have in such a pilot; an enrichment of metadata is interesting for them. But it would basically let a public infrastructure be controlled by Elsevier modules by building them in from the start. The research institutions should first carefully consider whether or not a pilot with a Pure Community Module is truly in line with Dutch Open Science goals. They should also more carefully consider whether or not this pilot would undermine plans for a community-owned OKB.

                There is a simple solution though. This is to disconnect the Pure Community Module from the contract for now. Subsequently, a tender could be issued for a Current Research Information Systems (CRIS) module that does something similar, and that can also process (meta) data from other sources. Elsevier can then tender for this contract. This would also give research institutions the opportunity to make an inventory of what alternatives are currently available for the Pure Community Module. If Elsevier wins the tender and their proposal is implemented, it will have been properly weighed against alternatives.

                A crucial difference is that Elsevier is then paid in cash for their services, and not in “kind” by giving them an insurmountable competitive advantage in terms of access to research intelligence. This is a very important point of principle.

                Enduring access

                All the pilots that Elsevier wants to commit to as well as the OKB itself aim to establish relationships between items, mainly by linking metadata. The Guiding Principles of our Taskforce stipulate that universities and other relevant institutions must have access to Dutch research information (metadata), including "derived" information. Therefore, a very important point is whether sustainable access is negotiated to relationships between entities established by third parties, in this case Elsevier. If I read the negotiation agreement carefully, I wonder if this is the case. Will Elsevier deposit proper metadata to Crossref? Will this metadata be made fully open, also in the case of citation data?

                Limited financial means

                This agreement will obviously give Elsevier a competitive edge, because they have already secured a number of pilots. And this agreement also implies that universities will have less money left for issuing contracts to other parties. The financial ramifications are especially relevant now that we are confronted with major economic consequences as a result of the COVID-19 pandemic. Should the competitive advantage be seen as a compensation for Elsevier’s willingness to engage in a read and publish deal? I am not persuaded. It would have been far more preferable if the research institutions would have first formulated general principles for collaboration with private parties, and only then had started to engage in projects and look for third-party interest. It seems sensible to me to stick to such a model as much as possible, for example by decoupling certain projects from the agreement and putting them into a general tender. In my view, funders would do well to also consider this model for the Funder Information pilot mentioned in the agreement, which has the stated aim to “link NL research outputs to grants and funders (EC, ERC, NWO, RVO, ZonMw), to allow for improved tracking / assessment of impact of funded research.” Here, too, it is crucial to avoid vendor lock-in. And of course, Elsevier should be given the opportunity to apply for these tenders. The option of issuing a tender per pilot has been left open in the contract with Elsevier.

                Value-extraction from public-sector information

                It is evident that Elsevier has quite a lot to gain from this deal. What is in store for them is a unique research intelligence infrastructure, because it is not only a national-level arrangement, but on top of that, the information that goes in is also validated by the institutes and research funders themselves. Obviously, Elsevier wants to manage a wide range of research intelligence to offer analyses from the perspectives of multiple stakeholders. Therefore, the company aims to establish a comprehensive linkage of metadata related to institutions, researchers, output, funding, and other resources. The Open Knowledge Base that the research institutions are themselves considering has similar ambitions. What remains to be seen is whether our research institutions are willing and able to ‘step up to invest in home-grown research infrastructures’. It is also an open question whether Elsevier systems will be made open and inclusive enough to comply with the Guiding Principles we formulated on behalf of the research institutions. I am not persuaded by the contract, and still find it disconcerting that this deal may effectively transfer crucial means to influence Dutch science policy to a monopolistic private enterprise.

                ]]>
                Sarah de Rijcke
                Going back to normal?https://www.leidenmadtrics.nl/articles/going-back-to-normal2020-05-14T10:00:00+02:002024-05-16T23:20:47+02:00With Covid-19 forcing university staff to work from home, there is ample opportunity for rethinking all the commuting we were doing in ‘normal' times. However, staying all at home is not so enjoyable, either. Could there be an alternative?This blogpost is a follow-up of the post by Carole de Bordes. She discusses a pre-covid19 workshop she attended on virtual meetings and conferences.

                Due to the Covid-19 crisis, we are currently experiencing a new way of working at CWTS. All staff needs to work from home. And besides the difficulties some colleagues are facing in this transition because of their home situations, most of the normal work could be taken up quite fast again. The main factor is the type of work we do, of course. A university research institute with hardly any teaching tasks can manage almost all things remotely. On top of that, we have excellent ICT facilities and staff to guide us in this process.

                In early April 2020, the Dutch prime minister warned us that it will be a long way back to the life before the outbreak. This statement, in particular, made me think about the way CWTS may adapt to this situation. We are able to deal with the current situation, but would we be fit to enter a new way of working in the longer term? On the other hand, I actually consider the current course of affairs to hold an opportunity.

                At present, all CWTS staff works from home. The university has appropriate facilities for almost all of us to stay in our homes and do the job we are supposed to do. We access data from a distance, we have online meetings and online conferences, we can write and share texts, etc. In that sense, we hardly need an office in Leiden. Commuting has become obsolete.

                Does this mean we can continue in this way once the crisis is over? Is working from home the new ‘normal’ to us? Obviously not. For many of us, working from home is complicated, due to housing issues. You don’t want to work all the time in the place where you eat, watch television, or sleep. And maybe even more importantly, we miss the social contacts in real life. CWTS café at 10 AM staring at a screen does not make up for that.

                But there is an alternative that deserves consideration. In 1999, I defended my PhD thesis in Leiden. In the Netherlands, PhD candidates are supposed to add a separate leaflet to their dissertation which includes 10 theses (stellingen in Dutch), relating to the subject or the candidate. The list I handed in at the time included one particular thesis, the last one, which has remained unnoticed to many but may hint to the opportunity for a new ‘normal’.

                Ed thesis

                Reducing commuting issues by traveling less

                The snapshot above shows the bottom of the list of theses. The last one, number 10, states (in English): 

                The solution for traffic jams in the Netherlands can only be reached if we are able to make a distinction between colleagues within the organization and those in one’s working place

                In other words: to reduce the problem of traffic jams, we should have offices near staff members’ residences, hosting people from different organizations or companies. Such offices are what my colleague Carole de Bordes has referred to as (meeting) hubs. With people living in many other places than Leiden, we could have such hubs. This would significantly reduce the commuting of our staff. We would not only contribute to less contact with fellow travelers but also save many, many hours sitting in a train (or car). I am not saying that traveling time is lost time but after more than thirty years of commuting between Utrecht and Leiden, I do consider over 12,000 hours a bit silly. Thinking of all the things I could have done during that time…

                On top of that, it will be easier to accommodate the 1.5-meter distance policy with fewer people in the office at the same time.

                What is the proposition?

                For instance, currently, five CWTS staff members live in Utrecht. They could take up quarters in an office with a proper infrastructure during the week, and travel only to Leiden when they need to be there physically. Many meetings and talks could be done via online-conferencing. For the rest, meeting in these hubs would offer the possibility of not having to work from our living rooms or bedrooms anymore and enable us to socialize with colleagues. In fact, the one thing we are most desperately missing at the moment is meeting colleagues in person during breaks and in the hall, all those informal encounters. With hubs in Utrecht, Amsterdam or Rotterdam, though, this would be covered. We could cover the extra costs of having these hubs by saving traveling costs or with support from the faculty, which will also save expenses when the building is used less. Considering the lack of office space at the university, this would be beneficial as well.

                Finally, the above proposition will lead to a more convenient way of working. This will contribute to happiness. And happiness is the key value to success, as stated in thesis number 9: 

                Money does not make [you] happy. It is happiness that makes money.

                ]]>
                Ed Noyons
                The bright side of the lockdown: the experience of conducting PhD studies remotelyhttps://www.leidenmadtrics.nl/articles/the-bright-side-of-the-lockdown-the-experience-of-conducting-phd-studies-remotely2020-05-11T13:13:00+02:002024-05-16T23:20:47+02:00Beyond the lockdown: COVID-19 forces change in remote learningFor years I had been moving towards a long-cherished dream: pursuing a PhD. In my academic publishing role, the Leiden Manifesto, Leiden Ranking, and CWTS journal indicators had played an important part. The Centre for Science and Technology Studies (CWTS), seemed the most suitable place. However, I was wondering if this would be possible for a middle-aged mother of four living in a small Eastern European country.

                I know that if you want to be accepted, you should express your willingness first. So, after several emails and conversations with Sarah de Rijcke and Ludo Waltman, it was agreed that I could do a PhD with remote supervision by Ludo Waltman and Vincent Larivière.

                Remote studies before the pandemic

                When my journey as a PhD candidate started in November 2018, Leiden University was already prepared well for distance learning. I was satisfied and comfortable with the remote workspace provided by the CWTS team, the university library catalogues, and monthly Skype meetings with my supervisor Ludo Waltman.

                The library is the heart of any university, and the Leiden University Library exceeded my expectations. Not only because of the richness of e-journals, databases and e-book collections, but also because of features implemented by the smart and ever helpful librarians. The Leiden Search Assistant plugin allows you to search the Leiden University library catalogue, Web of Science, Google Scholar, WorldCat, and PubMed instantly, without having to navigate to these respective websites first. The browser extension ‘UBL Get Access’ provides immediate access to subscribed scholarly articles and e-books.

                I feel profoundly grateful to Ludo Waltman, a generous and supportive supervisor. His calm guidance helps me steer my intended research projects. Ludo treats me like a colleague, gives me self-determination, and tolerates my limitations, spending hours reading my drafts, discussing, and showing better ways to communicate the findings.

                The Centre for Science and Technology Studies (CWTS) offers a range of exciting possibilities for developing various skills in scientometrics. Remote access and newsletters keep me in touch. But, deep inside, I knew I had not fully explored many possibilities the university offered.

                Quarterly trips to Leiden for several days each made remote studies more pleasant, and discussions in person foster the learning process and ongoing research. Also, PhD coordinator at CWTS Inge van der Weijden talked to me about research projects and the progress in my studies. I chatted with other PhD candidates. When I asked Wout Lamers advice on learning Python, he emailed me a comprehensive list of step-by-step suggestions. I realised that every visit to CWTS and in-person meeting accelerated my progress. Still, these short visits did not coincide with meetings of the Quantitative Science Studies group I belong to.

                Meanwhile, attendance at university events such as The Inaugural Lecture by Ludo Waltman, or Life after the PhD made me feel a fierce pride in the university traditions.

                Thus, after the first year, I decided to physically visit CWTS more often, which Ludo gladly accepted. Like many around the world, we did not expect a pandemic. My next trip was scheduled for March 17–20: the first week everyone at Leiden University started to work remotely.

                How remote learning has changed since coronavirus struck

                Breaking news a week before my next trip to Leiden: the situation was changing rapidly. On Thursday, March 12, the subject of an email received from the university said: “CORONA: teaching AND exams cancelled on Friday”. Several days later, the Lithuanian Government banned any travel abroad, and flights were cancelled.

                I felt gutted to miss the arranged meetings. No one knows when it will finish. But Leiden University and CWTS were amazingly prompt to arrange entirely remote workspaces for all staff and students.

                It was such a surprise: “You have been added to a staff team in Microsoft Teams”. This came right when my flight to Amsterdam had been expected to land. It made my day! I immediately installed Microsoft Teams and checked over its features. Over the next few days, all of CWTS, including the Quantitative Science Studies group, moved online with weekly, monthly, or occasional meetings. I have been invited to participate in any activities I could contribute to!

                The lockdown has brought me closer to colleagues in the Netherlands than I expected. Who would have thought? Online features have also helped to bridge some gaps.

                For instance, at next online Friday meeting, after a presentation delivered by Dr Ismael Rafols, I was curious about his and Professor Loet Leydesdorff’s discussion on the term ‘uncertainties’. Unfortunately, I had missed the title of a book suggested by the professor. Luckily, Vincent Traag posted it in the chat: The Honest Broker. This means nobody missed it. I was even able to download it immediately after the meeting from the library.

                Another example comes from the CWTS virtual bar, such a great place to chat and exchange experiences. The following week with my non-virtual cup of coffee, I met Ismael Rafols and Thed van Leeuwen. After a short talk, they shared even more useful publications with me! To be honest, when I was in Leiden, I did not dare to disturb senior researchers.

                The most exciting illustration arose from the weekly Quantitative Science Studies meetings moderated by Vincent Traag, where we share what we have recently discovered and discuss different topics and papers. This gave me the chance to present my research to colleagues, receive their feedback, and prepare an article for submission. I so much enjoy being part of this research group.

                It is incredible how the lockdown changed my life! I am getting closer to colleagues and busier with my research. I do believe the pandemic has changed some of our habits forever. Hopefully, we can participate in all meetings virtually, as an option, even after CWTS staff return to their physical workplaces.

                Even so, I do long to visit Leiden again soon, meeting people in person I have virtually shared with, and enjoying a coffee together.

                ]]>
                Eleonora Dagienehttps://orcid.org/0000-0003-0043-3837
                COVID-19: What do funders consider relevant research?https://www.leidenmadtrics.nl/articles/covid-19-what-do-funders-consider-relevant-research2020-04-30T12:00:00+02:002024-05-16T23:20:47+02:00As emergency calls for research funding are made to tackle the COVID-19, some difficult questions come to mind: What types of knowledge are relevant? What types of research should be prioritised?In this blog we review a sample of funding calls and find out some contrasting research agendas supported in different agencies; however, biomedical research seems dominant in many calls. We suggest that more public debate on research priorities is needed given high uncertainty and the broad social consequences of the pandemic.

                Mapping how funding agencies understand COVID-19 related research

                Governments and funding agencies across the globe are currently funding large amounts (possibly billions of Euros) in research calls aimed at addressing the COVID-19 pandemic. Their goal is to quickly produce knowledge that helps provide solutions and supports decision making.

                However, since the pandemic is affecting so many facets of society, what exactly is understood as research to address the COVID-19 crisis? There are areas of research that are obviously relevant, such as virology, immunology, clinical research and epidemiology.

                Yet, there are also other forms of knowledge which are relevant regarding the effects of the virus in its environment and the social world. This is the case for knowledge on hospital management, on risk communication, on the use of scientific evidence in policy, and at a broader level, on the wider effects of the pandemic on the economy, pollution, etcetera.

                Therefore, the collective response to COVID-19 and its consequences should not be based only on medical considerations, but also on broader social, economic and environmental understandings. Jochem Zuijderwijk made the argument in a previous Madtrics blog that ‘we should be careful not to overlook inputs from different scientific fields that could provide important insights in the current crisis.’ While there are no effective therapies, some of the most effective ‘treatments’ so far have been behavioural (‘social distancing’) and resource management (distribution of ventilators). Hence, it would be strange not to rely on the social and behavioural sciences.

                Under limited resources and time pressure, which types of research should be funded? Past experiences suggest that without explicit effort and strategies to consider various forms of knowledge, attention ends up concentrated in narrow forms of expertise to the exclusion of the others. Indeed, this analysis provides some preliminary evidence that COVID19 funding is concentrated in biomedical approaches. It is therefore important to pay attention to diversity in the types of knowledge mobilised for facing the crisis.

                Different framings in funding calls for COVID-19

                In order to find out what forms of research are being considered for funding, we have gathered and analysed emergency COVID-19 calls of various funding agencies across some countries. This is an exploratory analysis based on a sample of calls, using mainly the texts in the funding calls rather than the funded projects. Although we are not domain experts, the primary concerns of funders seem relatively clear, and this partial sample already shows revealing differences across calls.

                The summary of the calls examined is available in this table:

                Open Tableau table in a new tab

                For the sake of simplicity, we have divided the funding calls into three classes, depending on which aspects of the COVID-19 pandemic they focus on:

                • Focus on health responses, such as vaccines, diagnostics and epidemiological models.
                • Broader public health considerations, such risk communication and misinformation, social dynamics and prevention of stigma.
                • Studies on the social consequences of the crisis.

                Dominant framings focused on health responses

                The first and most prevalent framing of calls for funding conceptualizes COVID-19 as a technical problem in need of biomedical solutions or healthcare policies. This can be seen for example in the calls by the European Commission, in Catalonia or Brazil.

                These calls support, on the one hand research in therapies, vaccines and diagnostics, i.e. solutions based on biomedical expertise; and on the other hand, they also fund epidemiological work, modelling and clinical studies. Scientometric mapping suggests a strong contrast between these two perspectives (biological vs. clinical/epidemiological), but many funding agencies include both in the same call. Other funding agencies, such as the US National Institutes of Health, make more specific calls for technological development or public health interventions.

                A key question in research priority setting in pandemics is the relative investment in technical biomedical solutions versus research on healthcare policy and systems. The balance between these options in COVID-19 cannot yet be assessed since few calls have released details of projects funded. From the information available, it seems likely that biomedical (vaccine and drug) development will capture the lion’s share of public funding. For example, a coalition of large charities has set up a COVID Therapeutics Accelerator with a US$125 million of seed funding to support drug development.

                Experts point out that delivery of new therapies or vaccines may take at least 12 or 18 months and that pharmaceuticals’ investments in this area are far larger than public investments (e.g. amounting to 75% of vaccines). Therefore, there is room for debate on whether public funding should support more research, in relative terms, on healthcare policy and systems -- which have proved crucial in the emergency response, in lockdown policies.

                Opening to broader public health considerations

                A broader interpretation of the relevant knowledge to address COVID-19 sees the pandemic as more than just a biological, technical or managerial issue, acknowledging that socio-political contexts are as much a component of the pandemic as the disease itself.

                A first broadening step, while keeping within a health-centred framing, is to study how social environments have an effect on health outcomes during a disease. Consider, for example, the response of the Canadian Institutes of Health Research. This funding call also includes research in the categories of vaccines, therapeutics, diagnostic and healthcare management. However, it also funds many projects that focus on issues such as social dynamics, risk communication, and trust. For example, some projects look at how forms of discrimination against Chinese-Canadians may be exacerbated due to the COVID-19 pandemic; others at sociological considerations of trust in public spaces or at the propagation of false or faulty information within media in response to COVID-19. This is a noticeably broader interpretation of what forms of research are deemed important within the COVID-19 pandemic.

                Framings beyond health: on the social effects and responses to COVID-19

                Finally, there are also funding calls for research focused on the social and economic dimensions of the COVID-19 crisis, the effects of policy responses, and the overall consequences for other aspects of societal – including educational, economic and psychological – well being.

                Some research councils, such as the Dutch Research Council (NWO) or the US National Science Foundation (NSF) have general ‘response mode’ calls which have included a few projects studying the effects of the pandemic beyond health. The NWO has funded research both on wider health issues (as discussed above), as well as on the effects on family life, on the emotional wellbeing of adolescents and on social inequalities. The NSF is supporting a project which is addressing the pandemic through science education in primary school.

                The Mexican funding agency (CONACYT) has made, besides the usual call with a health framing, a call dedicated to universal access to knowledge. This call aims to fund the development of public science communication to be used during the COVID-19 pandemic, in order to improve social appropriation of knowledge. The call funds contents for various forms of science education ranging from infographics to performing arts and music, especially on problems such as domestic violence, addictions, sexual health and lifestyle habits that may be under stress during the pandemic.

                More debate is needed on funding priorities

                In the last 20 years, pandemic outbreaks have been followed by sudden surges in targeted funding. During these funding surges, there has been rather limited systematic thinking about the research priorities in the face of urgency. Given the breadth of the COVID-19 crisis, the funding research reaction has been extremely fast and large. Since social life has been disrupted in many diverse ways and sectors, a variety of research agendas are relevant to understand and address consequences of the COVID-19 crisis.

                This preliminary analysis has shown that most research calls on COVID-19 are framed in terms of quick health responses aimed at technical biomedical solutions (drugs, vaccines and diagnostics) and studies on epidemiology and healthcare policies. We have also found some funding calls with a substantial budget for projects on broader public health issues such as risk communication, misinformation and stigmatisation. A few agencies have also provided funding to study and respond to the broader consequences of COVID-19, such as through science communication programmes.

                In spite of the diversity of research options observed, the overall funding landscape seems strongly focussed on biomedical approaches. Yet, the relative investment that other options need is seldom discussed in public. This is a shame since priority setting in public R&D is likely to benefit from more openness.

                This week, the Nuffield Bioethics Council published critical considerations regarding the use of expertise for COVID-19 policies. We believe that they apply to calls for funding as well. In particular, funding decisions might improve by showing the goals and ethical considerations behind the calls, by engaging with wider expertise and stakeholders, and by thus broadening the range of perspectives gathered.

                ]]>
                André BrasilSoohong EumWouter van de KlippeIsmael Rafolshttps://orcid.org/0000-0002-6527-7778
                Reminiscence: A note by two former internshttps://www.leidenmadtrics.nl/articles/reminiscence-a-note-by-two-former-interns-at-cwts2020-04-28T11:30:00+02:002024-05-16T23:20:47+02:00In 2015 and 2017, we were interns at the Centre for Science and Technology Studies (CWTS), and it was a valuable experience. Let us tell you about it, and why you may consider applying there.Through our master’s programme MARIHE (Master in Research and Innovation in Higher Education), we were supported by the staff members at Tampere University in the selection of internship hosts, but we were also encouraged to suggest our own internship hosts around the world. Since several interesting research topics for our master’s studies were carried out in Leiden, such as innovation studies, evaluation studies, and altmetrics, we came to choose and apply at CWTS.

                What did we gain from the internship? It provided the opportunity to get to know an international research environment, and its rigorous yet informal training finally led us to work in research. Since both internships took place a few years ago during our master’s studies, we are able to reflect on their effects. At that time, we were able to prepare parts of our master’s thesis at CWTS, namely on the use of altmetrics in research funding and Chinese PhDs in the Netherlands.

                We were exposed to an international research environment with support from senior researchers. We were introduced to many experts in the field via our colleagues at CWTS and we attended a few workshops, conferences, and other events relevant to our research. For example, the launch event of the Leiden Manifesto for Research Metrics at Leiden University and several research seminars at CWTS.

                CWTS dinner
                Summer 2017 farewell dinner with interns and supervisors. Top left: Evan de Gelder (research assistant), Ingeborg Meijer, Ingeborg van der Ven. Top right: Inge van der Weijden, Tung Tung Chan, Johan Jan Beukman.

                We met talented, friendly colleagues from all around the world and made long-lasting contacts via the internship. Colleagues at CWTS come from a wide diversity of countries, and the visiting researchers that came to CWTS throughout the year were - just to name of few - from Brazil, China, Chile, France, Iran, Mexico, Spain, Sweden, and Turkey. We were introduced to several research projects, in-house databases and have had the opportunity to present and publish research, but were also given full autonomy to conduct our own master’s thesis research.

                An internship at CWTS is a useful way to get exposed to ­­research and learn from peers. Dr. Ingeborg Meijer, Dr. Inge van der Weijden, and Dr. Cathelijn Waaijer’s supervision and network were crucial to the academic success of Tung Tung as she travelled all across the Netherlands (from Maastricht to Groningen) to speak to PhD coordinators and Chinese PhD candidates. Grischa received valuable feedback on mixed-methods research from Dr. Ingeborg Meijer, and was able to learn SQL with the help of Dr. Rodrigo Costas and Dr. Zohreh Zahedi. This learning provided several new opportunities to collect, structure, and analyse research data. We both received support in carrying out literature reviews, building a research design and a theoretical framework, and on how to choose research methods. All staff members of CWTS were very approachable and supportive. Furthermore, it was possible to publish research carried out at CWTS together with supervisors.

                Looking back at our internships in Leiden, we believe they have had long-lasting effects on our careers. We learned how to conduct research responsibly and gained knowledge and skills that we needed to flourish. Furthermore, the possibility to talk to colleagues at any time and to get advice on any topic made this experience even more enriching. After the internship, Grischa continues to be a visiting researcher at CWTS while being a research assistant at TIB Leibniz Information Centre for Science and Technology. Tung Tung was later hired as a researcher at CWTS for the Horizon 2020 funded NewHoRRIzon project and Open Science Monitor.

                We would encourage master’s students and doctoral researchers with an interest in the research themes of CWTS to apply for an internship or a research stay in Leiden. CWTS has three research groups, namely Quantitative Science Studies, Science and Evaluation Studies, and Science, Technology and Innovation Studies and also four thematic hubs: Academic Careers, Engagement and Responsibility in Research and Innovation, Open Science, and Responsible Evaluation. Depending on the location of your university, funding for such internships or research stays is, for example, available from the German Academic Exchange Service (DAAD), Erasmus+ or other funding organisations. However, we understand that doing an internship abroad might not be an option now due to COVID-19. Both our internships began after several emails and Skype calls, so please do not hesitate to initiate contact, you might just get a reply!

                ]]>
                Grischa FraumannTung Tung Chan
                Delineating COVID-19 and coronavirus researchhttps://www.leidenmadtrics.nl/articles/delineating-covid-19-and-coronavirus-research-an-analysis-of-the-cord-19-dataset2020-04-21T11:11:00+02:002024-05-16T23:20:47+02:00Many initiatives are keeping track of research on COVID-19 and coronaviruses. These initiatives, while valuable because they allow for fast access to relevant research, pose the question of subject delineation. We analyse here one such initiative, the COVID-19 Open Research Dataset (CORD-19).As the COVID-19 pandemic unfolds, researchers from all disciplines are coming together to contribute their expertise. The COVID-19 Open Research Dataset (CORD-19) is a growing, weekly-updated dataset of COVID-19 publications, capturing new as well as past research on “COVID-19 and the coronavirus family of viruses for use by the global research community.” The reason to release this dataset is “to mobilize researchers to apply recent advances in natural language processing to generate new insights in support of the fight against this infectious disease.” The initiative is a partnership of several institutions including the Chan Zuckerberg Initiative, Georgetown University's Center for Security and Emerging Technology, Microsoft Research, the National Library of Medicine of the National Institutes of Health, and Unpaywall. CORD-19 is released together with a set of challenges hosted by Kaggle, mainly focused on automatically extracting structured and actionable information from such a large set of publications. The release of CORD-19 is a call for action directed towards the natural language processing, machine learning, and related research communities. This call has been taken up. For example, the ACL conference has announced an emergency NLP COVID-19 workshop, and a TREC-COVID challenge has been released, both using CORD-19.

                CORD-19 contains over 47,000 articles, of which about 36,000 are equipped with full text, as recorded on April 4, 2020. Before the SARS outbreak in 2003, there were only few publications on the subject. The number of publications steadily increased in the years afterwards. In 2020 it reaches a peak, with thousands of publications in the first few months alone.

                Trend in the number of publications in CORD-19.


                To get a high-level overview of the CORD-19 dataset, we used VOSviewer to create a term map of the publications in this dataset. The size of a term reflects the number of publications in which the term occurs. The proximity of two terms in the map indicates how strongly related the two terms are, based on how frequently they co-occur. The closer two terms are located to each other, the stronger they are related. The map shows a clear divide between biologically focused topics in the left part of the map and clinically focused topics and health research in the right part. In the visualization of the map, presented below, the colour of a term reflects the average publication year of the publications in which the term occurs.


                Four large clusters of the CORD-19 citation network (see also the interactive term map).

                Using topic modeling we further characterised these four largest clusters. The largest cluster (top-left) mainly contains publications on coronaviruses and their molecular biology. The second-largest cluster (top-right) focuses on molecular biology and immunology. The third-largest cluster (bottom-left) represents research on influenza and related viruses. Finally, the fourth-largest cluster (bottom-right) contains publications on coronavirus outbreaks, their clinical features and epidemiological impact. These areas of research are interrelated, yet also contain specialised information, highlighting distinct research topics within CORD-19: coronaviruses, molecular biology research on viruses, public health and epidemics, other viruses (such as influenza) and other related topics (immunology, diagnosing, trials and testing).

                We also analysed CORD-19 publications using Altmetric data, with the aim of exploring the reception of these publications on social media. Overall 60% of the publications in CORD-19 have received some mention in Altmetric, and for publications from 2020, this is the case for more than 80%. Twitter is the leading Altmetric source for CORD-19 publications, especially in 2020. As shown below, CORD-19 publications mentioned on Twitter can be found mainly in the right part of the term map, focused mostly on the epidemics and clinical characteristics of the current COVID-19 outbreak.


                Twitter attention of CORD-19 publications (see also the interactive term map).

                Our most important finding is that CORD-19 contains research not only on COVID-19 and coronaviruses but on viruses in general. In fact, only approximately 11,500 of the 47,000 CORD-19 publications include coronavirus-related terms in their title or abstract. While we fully endorse the initiative that led to CORD-19, it is important to be aware of the relatively broad content of the dataset. In addition, there also seems to be research on coronaviruses that is missing in CORD-19. We were able to identify almost 5,000 publications in the Web of Science that are not included in CORD-19 even though they explicitly mention coronaviruses or related terms. Many of these publications can even be found in PubMed, but are nonetheless not included in the CORD-19 dataset.

                In this blog post, we just started to scratch the surface of the potential of the CORD-19 dataset. There are many open scientometric challenges on this dataset, and on COVID-19 and coronavirus research more broadly. For example, there is a need for a more comprehensive and multidisciplinary map of COVID-19-related research, going beyond biomedical research. CORD-19 also provides a virtuous example of open data sharing, and the scientometric community can contribute by creating and maintaining additional datasets on COVID-19 research. Furthermore, we showed that there is a lot of social media attention for COVID-19 research, which calls for more advanced analytics on the reception of this research in social media . Understanding the mechanics behind the online dissemination of COVID-19 research can inform science communication strategies, and provide valuable advice to experts and governments during the current and future pandemics.

                Related content

                Pre-print
                Repository

                Interactive term map

                ]]>
                Giovanni ColavizzaRodrigo Costashttps://orcid.org/0000-0002-7465-6462Vincent TraagNees Jan van Eckhttps://orcid.org/0000-0001-8448-4521Thed van LeeuwenLudo Waltman
                Precarious careers: postdoctoral researchers in the Netherlandshttps://www.leidenmadtrics.nl/articles/precarious-careers-postdoctoral-researchers-in-the-netherlands2020-04-21T11:00:00+02:002024-05-16T23:20:47+02:00As the number of postdoc researchers grows, studies in the Netherlands reveal that they experience high stress levels. This post discusses mental health and the main stressors: a lack of academic career prospects, publication and grant pressure, work-life imbalance and lack of institutional support.Academic organisations have changed substantially in recent decades in terms of their tasks, structure and culture due to increased internationalisation, lower government influence and funding, and larger influence from external stakeholders. Like other public organisations, universities are increasingly financed in an output-oriented manner, and therefore emphasis on performance has grown. The altered financial structure of universities has changed employee relationships extensively and at different levels. Because of these developments, the number of postdoc researchers is growing. Postdocs are highly educated professionals with a doctorate, contributing directly to the primary process of the university, particularly research output, but with no long-term perspectives and little opportunity to obtain a tenured contract.

                Studies on postdocs in the Netherlands

                The purpose of our research is to understand how, in the context of labour market instability, postdoctoral researchers experience their working conditions and their prospects and opportunities, in relation to their wellbeing. In a first study (2015), we found that nearly all postdocs (85%) wanted to stay in academia, but less than 3% were offered a tenure track position. The postdoc population is substantial and growing; the average duration of postdocs’ employment is approaching the length of the doctorate trajectory. In a follow-up study (2019), we conducted a survey among postdocs from eight Dutch universities. A sample of 676 postdocs, 51% male, 48% female and 1% gender neutral, responded. The average age of the respondents was 34 years. Forty-six percent had Dutch nationality, and 54% were from different countries. The postdocs worked in different fields: natural sciences (32%), social sciences and humanities (30%), medical and health sciences (21%), engineering and technology (17%). The average postdoc duration was 31 months.

                Job satisfaction

                Postdocs were generally quite satisfied with their research, their colleagues and their superiors. However, they were generally unhappy about their academic career prospects and the support they received from their organisation. Respondents think that their chances of acquiring a stable job in academia in the near future is very small, and they mention the shortage of available positions and dependence on insecure external research funding as the most important worries.

                Training and career preparations

                Sixty percent of the postdocs participated in several training modules or courses, mainly orientated on academia, such as grant writing, learning foreign languages and teaching. However, 40% had not yet participated in any training course at all. Postdocs are aware that networks are critical in preparation for the labour market; half of the respondents are actively networking in and outside the university. However, only one in three postdocs spent time during their postdoc position further developing additional transferable skills in order to expand their eligibility for career options beyond research. Even fewer postdocs (13%) developed some degree of management experience, such as being a member of a research council or board. Interestingly, nearly half of the postdocs did not feel encouraged by their supervisor to follow any additional training.

                Mental health

                To measure the postdocs’ mental health, we used the General Health Questionnaire-12. This is a validated and widely used screening instrument to identify psychological distress and the risk of a common psychiatric disorder. Experiencing four or more symptoms in the questionnaire indicates risk. Thirty-nine percent of the postdocs surveyed were at risk of developing serious mental health challenges, which can lead to anxiety and depression. The most frequently reported issues were: feeling under constant strain (47%), concentration problems (35%), and sleeping problems (33%). Experiencing lack of career prospects in academia, publication and grant pressure, work-life imbalance and feelings of lack of career support from supervisors and/or their organisation, negatively impact the mental health of postdocs.

                Call for action

                It is urgent that universities take postdocs more seriously into account within their current employment organisation. Below are recommendations that should be adopted by the sector and universities.

                1. Postdocs require more formalised visibility that can be accomplished through their recognition as a separate staff category in the Dutch national classification system of functions within universities.
                2. It is important to raise awareness among various stakeholders concerning the complexity of the postdocs’ position, since they must combine a variety of tasks and responsibilities with insecure career prospects. Maintaining this precarious balance causes considerable stress.
                3. Universities should foster more support for postdocs by developing appropriate, focused, and pragmatic human resources policies. Examples of instruments include:
                  1. Launching a postdoc community or network, as has been done by Ghent University, consequently improving the contacts among the postdocs more actively.
                  2. Providing career guidance by designing training modules for the personal and professional development of postdocs, including mentorship programs. Encourage supervisors to discuss career preparation activities with their postdocs.
                  3. Establishing contacts with organisations that employ (former) postdocs or are interested in doing so in the future. This way, postdocs will be encouraged to reflect on their future prospects and career paths, either in academia or outside the university.
                  4. Diversifying and vitalising career paths of postdocs in co-creation with postdocs themselves.

                The results of the mental health questionnaire call for action: universities need to take the initiative to prevent mental health challenges, to increase wellbeing and to offer adequate support to postdocs who are already experiencing challenges. Of importance is, among other steps, the training of supervisors to recognize mental health issues, to increase awareness of the importance of mental health, to build resilience and to decrease stigma on mental health challenges in academia.

                Note

                This blog was first published as an article on EUA-CDE doctoral debate on 18 March 2020.

                ]]>
                Inge van der WeijdenChristine Teelken
                Broadening the perspective on Covid-19https://www.leidenmadtrics.nl/articles/broadening-the-perspective-on-covid-192020-04-16T11:00:00+02:002024-05-16T23:20:47+02:00While the pandemic has led many to first seek biomedical and epidemiological expertise, we should be careful not to overlook inputs from different scientific fields that could provide important insights in the current crisis. Here are some early academic responses you might have missed.Many scholars at CWTS are now working hard, as they are elsewhere, to make some meaningful and helpful contribution in the current crisis. Being neither biomedical specialists, nor specifically engaged in topics related to disease or epidemics, a Science and Technology Studies research center like CWTS might not be the most logical of places to start doing Covid-19 related research projects. Surprisingly, however, a host of quite different but promising ideas are actually being developed by many CWTS researchers as we speak. These projects are very diverse, envisioned for either the short or long term, with some more scientometrics-based while others rely on qualitative research methods, and all variably focused on looking at the past, present, and/or future of funding, literature and research relevant to Covid-19 and its multidimensional contexts. I hope that more of them will soon follow my example and share with you all the (very!) interesting stuff they have already uncovered.

                In the meantime, however, a plethora of other institutes and disciplinary communities - just as far removed as we are from the typical biomedical and epidemiological research and literature that many now turn to in these trying times - are already way ahead of us, and have already started building academic responses, providing meaningful commentaries, and compiling relevant syllabi and literature lists. Our own small project, part of an ad hoc Covid-19 research group brought to life by Ismael Ráfols entitled ‘Broadening the Perspective’, is meant to gather some of this literature about Covid-19 - or more generally the relevant literature on epidemics, the interaction between crises and socio-cultural inequalities, social distancing, loneliness and so forth – that originates outside of the expected biomedical and epidemiological fields, and which stems from areas that are usually not included in a first selection of relevant expertise when responding to this type of crisis.

                This latter selection criterium is, as I am well aware, a vague one. However, the point is exactly that: to look to places where things might indeed become a little vague and seek out the scientific literature that our scientometric sisters and brothers might not find as easily when first scouring the landscape for Covid-19 relevant literature and knowledge. To see where and how others - in fields in the social sciences and humanities (SSH) for example - might provide potentially crucial and valuable responses that could otherwise be overlooked by those not connected to these fields.

                This idea of ours appeared to be not only a reasonable one, it was in fact (of course!) already being done. Indeed, it didn’t take long for us to find (in our immediate circles no less) ever-expanding syllabi and literature lists being created at high speeds in a lot of different areas. Rather than providing a broader perspective on issues and knowledges related to Covid-19 ourselves, we are still very much trying to play catch-up and getting some perspective on this seemingly vast and expanding network of files, fora and lists that are already doing much of that work for us.

                This blog post is in many ways simply meant to be another link in that network as it is coming into being: providing readers with some links to the work of others, who can in turn provide you with more interesting links to more interesting work of others. However, it is also to force ourselves (as was rightly suggested by a blog editor) to maybe step outside of our collective comfort zones and automated academic responses, which often drive us to try and work towards some sort of finished project or end product before sharing our thoughts, and instead communicate in the here and now about what we’re seeing. Thus, what I present below is both a list under development of an already amazing amount of links to Covid-19 responses, compiled literature lists and more, all stemming from various corners of academia, and my own initial and brief notes on their content, written while I have been searching for and looking through all of this as we try to ‘broaden the perspective’ on Covid-19, its related crisis (crises) and possible responses.

                The list starts with several links to syllabi and literature lists made and continuously updated by collectives of academics working in different areas of the social sciences or humanities, which each provide enormously rich lists of sources relevant to the social and cultural aspects of disease and epidemics in often unexpected ways. Some prominent themes here include plagues and epidemics of the past; the role of expertise in governance and society; misinformation and media; psychological strain and mental health; social distancing and solidarity; COVID-19 as ‘syndemic’; relations with economics, biopolitics, capitalism and neoliberalism; the Risk Society; ‘outbreak narratives’; comorbidity and social inequalities, ableism and gender relations as co-determinant in disease spread and burden, and much, much more.

                List 1. Continuously updated and crowdsourced academic syllabi and online collections of sources related to COVID-19.

                SyllabiDateDescription
                Teaching COVID-19: An Anthropology Syllabus ProjectMarch 6, 2020 - OngoingSyllabus specifically started to collect resources for anthropologists (connected to the 'Teaching and Learning Anthropology journal), but clearly useful to social scientists in general, as well those seeking to teach on themes in connection to COVID-19. Sources are categorized in very specific topics and themes. (Initiative/editing by Nina Brown, Angela Jenks, Kartie Nelson and Laura Tighman)
                Humanities Coronavirus SyllabusMarch 12, 2020 - OngoingSyllabus 'which focuses on literary, historical, philosophical/religious, and cultural aspects of the current health crisis and its history'. Has a strong list of literary, history, as well as relevant popular culture suggestions. (Initiative/editing by Sari Altschuler and Elizabeth Maddock Dillon).
                #coronavirussyllabus | a crowdsourced cross-disciplinary resourceMarch 12, 2020 - OngoingSyllabus based on literature initially gathered through the use of the twitter hashtag #coronavirussyllabus. No sub-categorizations of books/articles, but it contains full and standardized bibliographical info and links to all works, info on open/closed access for each item, as well as an expanding list of podcasts, films, music, etc. (Initiative/editing by Alondra Nelson)
                Teaching Coronavirus—Sociological Syllabus ProjectMarch 13, 2020 - Ongoing(mostly) Sociological literature arranged according to themes, which more or less correspond to prevalent topic categories in sociology and, like the anthropology syllabus, useful to social scientists in a broad sense. Especially strong in connecting issues to critical perspectives. (Initiative/editing by Siri Colom)
                Coronavirus Readings by The SyllabusMarch 15, 2020 - OngoingIndex of Corona related content with daily updates made by 'The Syllabus'. Based on a combination of "algorithmic and human curation": "each week, our algorithms detect tens of thousands of potential candidates – and not just in English. Our human editors, led by Evgeny Morozov, then select a few hundred worthy items". Useful for keeping track of new contributions in a variety of outlets/channels, rather than finding past relevant publications. Also available as a newsletter.
                A COVID-19 Syllabus: An Interdisciplinary Exploration for Students, Faculty and Staff in Higher EducationMarch 2020 - OngoingSyllabus meant to gather sources to help students 'make sense of what to do, how to think, and how to cope in a world upended by COVID-19'. Contains the widest variety of disciplines in its listings, including visualizations, artist responses and accessible literature suggestions arranged in themes. (Initiative/editing by Kimberly Poitevin)
                COVID-19 Reader ProjectMarch 2020 - Ongoing"Reading materials include scholarly works from the history of science, technology and medicine, medical anthropology, and STS, as well as newspaper articles, letters from the universities, images and videos, and even memes capturing what it is like to live in the time of a pandemic". Includes a particular focus on learning from past epidemics and links to some great digital archives. (Initiative/editing by Yeonsil Kang)
                The Coronavirus Tech HandbookOngoing"The Coronavirus Tech Handbook is a crowd-sourced library for technologists, civic organisations, public and private institutions, researchers, and specialists of all kinds working on responses to the pandemic. It is a rapidly evolving resource with thousands of expert contributors". Impressive scale of information, providing 'tools' meant to find information on wide scale of techical, social, economic, etc. issues
                Treating Yellow Peril: Resources to Address Coronavirus RacismOngoingA collection of resources to map out, teach on and discuss racism in relation to the coronavirus outbreak (Initiative/editing by Jason Oliver Chang)
                Centre for Feminist Foreign Policy (CFFP) - Feminist Resources on the PandemicOngoingImpressive collection of old and new works and commentaries on the intersection between COVID-19 and gender politics, arguing for a feminist COVID-19 policy

                But, next to these collections of old and recent relevant literature, there is also a host of more direct academic responses to the COVID-19 outbreak. Although our dominant infrastructures of communication through peer-reviewed journals prove very ill equipped to move at the speed of a virus, academics from all across the spectrum have sought to respond and share knowledge through opinion pieces, blogs, curated forum discussions and so on. My list therefore also includes both a set of curated collections of academic forum posts, blogs and essays (see list 2), mostly centered around a specific discipline or theme, as well as a more extensive list of individual contributions I have gathered and selected myself (see list 3). This latter list also includes things like short essays, individual blogposts and contributions to some more popular science journals, but excludes (with maybe one or two exceptions) everything published in more regular news media outlets (which means I may have missed some very valuable contributions made by scholars in newspapers and the like). Moreover, the selection is unquestionably subjective, and probably relies more heavily on sociological and anthropological contributions than on those from any other fields due to my own disciplinary backgrounds. Nevertheless, I am still very happy that it actually includes some singular contributions from fields as diverse as economics, psychology, classical studies, literary studies, history, art, art history, philosophy, theology, journalism and communication, and environmental studies. Though each contribution is thus coupled to some notes that I hope might guide you in choosing things of interest to you, I have ordered all of them chronologically (unless it entails a direct response or follow-up) rather than according to something like discipline or theme. This is primarily due to the practical issues of maintaining such strict classifications here, but at the same time I’m hoping it might also arouse some curiosity, entice some readers into investigating something unexpected, or ‘broaden someone’s perspective’ as they move through the lists.

                List 2. Themed or disciplinary collections of (short) essays, papers, blogposts and discussions on COVID-19.

                Covid-19 Response CollectionsDateDescription
                Somatosphere - Series: Dispatches from the pandemicFebruary 28, 2020 - OngoingTag for collection of COVID-19 articles published on Somatosphere, which covers ''the intersections of medical anthropology, science and technology studies, cultural psychiatry, psychology and bioethics". Includes the below fora, but also more extensive pieces on a broad range of interrelated topics well worth the read
                Somatosphere - COVID-19 Forum - introductionMarch 6, 2020Forum presenting series of early academic responses to COVID-19 outbreak presented by 'Somatosphere'.
                Somatosphere - COVID-19 Forum II - introductionFollow-up: April 6, 2020Follow up to the well received first forum series of Somatosphere
                CEPR Press: Richard Baldwin and Beatrice Weder di Mauro (Eds.) - Economics in the Time of COVID-19March 6, 2020Collection of articles from economists writing on COVID-19 published by the Centre for Economic Policy Research (CEPR) in a free VoxEU.org eBook
                Leiden Anthropologists Reflect on the COVID-19 PandemicMarch 23, 2020Collection of blogposts from anthropologists responding to the COVID-19 crisis
                Corona Times: Understanding the world through the Covid-19 pandemicMarch 26, 2020 - Ongoing"Corona Times is a blog written and curated by engaged scholars from across the world, coming together across multiple disciplinary and interdisciplinary perspectives, with a strong grounding in humanities and social sciences, and in dialogue with public health knowledge".
                European Journal of Psychoanalysis - Coronavirus and philosophers
                March 2020Collection of old and new philosophy writings on, or relevant to, the COVID-19 outbreak, from M. Foucault, G. Agamben, J.L. Nancy, R. Esposito, S. Benvenuto, D. Dwivedi, S. Mohan, R. Ronchi, M. de Carolis
                The National Bureau of Economic Research (USA) - NBER StudiesMarch - April 2020Working papers from the NBER on COVID-19 and related topics
                Contexts (Rashawn Ray and Fabio Rojas) - Covid-19 impact on Asia and beyondApril 1, 2020Collection of short sociological essays on COVID-19 (contexts.org also has other indivual relevant essays on COVID-19)
                MAT Virtual Issue: Outbreaks, Epidemic, and Infectious DiseasesApril 6, 2020Special virtual issue of Medical Anthropological Theory, with a retrospective collection of crucial & relevant publications
                American Anthropological Association (AAA) - COVID-19 ResourcesOngoingCollection of webinars, responses, observations and other resources hosted by the American Anthropological Association
                STS-Disaster Research Network (Duygu Kasdogan, Pedro de la Torre III, Tim Schütz and Kim Fortun) - TRANSnational STS COVID-19 ProjectOngoing"The TRANSnational-STS Covid-19 Project brings together researchers in the interdisciplinary field of Science and Technology Studies (STS) to follow and analyze COVID-19 as it plays out in different settings". (See more at disaster-sts-network.org)

                Before finally coming to my last (highly tentative) list, an important note: All of what you see here is built on the hard work of others (as academia generally is) and they deserve all the credit. They have on the whole been sharp and quick to respond in variable meaningful ways in what will undoubtedly also have been hard times for them, as it has been for the rest of us. All I hope to have added here for now is to share some of this relevant and compelling literature with those that may not have come across it yet. It is in no way meant to be comprehensive nor complete; you will undoubtedly disagree with my decisions on the usefulness or relevance of what I have in- or excluded; what is included is without any doubt extremely biased as it has been collected via mostly personal and disciplinary networks (and many disciplines so far still lack any representation); and much of it may very well become outdated in a week’s time (though I doubt it!). However, rather than presenting the final conclusions on what SSH can say about Covid-19, this blog post is meant as a tiny contribution in linking thoughts and ideas to people, and as such I hope very much you will be joining me in doing the linking. So please: look through it, add and recommend more, criticize me for all the important things I’ve obviously overlooked, but by all means also share it with those that may find it useful! 

                List 3. Written commentaries, projects and responses to the COVID-19 outbreak by scholars or scholarly collectives.

                Individual responsesDateDescription
                Katherine Hirschfeld - Microbial insurgency: Theorizing global health in the AnthropoceneOctober 23, 2019Article in the journal The Anthropocene Review actually predating the COVID-19 outbreak, but assessing the relevance of multidimensional macro-level shifts for current global pandemic responsiveness
                Julie Smith - Gender and the Coronavirus OutbreakFebruary 4, 2020Argues for the inclusion of relevant knowledge on gender inequities in formulating outbreak response
                Gideon Lasco - Why Face Masks Are Going ViralFebruary 7, 2020Exploration of reasons why people wear facemasks
                Gideon Lasco - Could COVID-19 Permanently Change Hand Hygiene?Follow up: April 8, 2020"An anthropologist tackles the slippery subject of hand sanitization in a world torn between concerns over contagion and antibiotic resistance"
                UC Berkeley - Ivan Natividad - Coronavirus: Fear of Asians rooted in long American history of prejudicial policiesFebruary 12, 2020On anti-Asian prejudice at UC Berkeley and its historical precedents
                Choujun Zhana, Chi K. Tseb, Yuxia Fuc, Zhikang Laic & Haijun Zhangd - Modeling and Prediction of the 2019 Coronavirus Disease Spreading in China Incorporating Human Migration DataFebruary 19, 2020Medxiv preprint on modeling disease spread and human migration, written by engineers using Chinese app data
                Joshua Neves on the Coronavirus (COVID-19), anti-Chinese racism, and the politics of underglobalizationFebruary 21, updated March 11, 2020Brief comment on contradictory political understandings of China & Chinese response to the outbreak
                Robert Peckham: The covid-19 outbreak has shown we need strategies to manage panic during epidemicsFebruary 21, 2020Opinion piece by historian Robert Peckham on the phenomenon of 'panic'
                Georgio Agamben - L’invenzione di un’epidemiaFebruary 26, 2020Critical theorist Georgio Agamben on 'The Invention of an Epidemic' - Translation is present here: https://www.journal-psychoanalysis.eu/coronavirus-and-philosophers/
                Anastasia Berg - Giorgio Agamben’s Coronavirus CluelessnessResponse: March 23, 2020Critical response to Agamben
                The Chuang collective - Social Contagion: Microbiological Class War in ChinaFebruary 2020Elaborate academic and critical political article by anonymous collective writing on capitalism in China
                Robert Peckham - COVID-19 and the anti-lessons of historyMarch 2, 2020Brief response by historian Robert Peckham on COVID-19, similarities and differences with historical precedents
                Isaac Chotiner - Interview with Frank Snowden - How Pandemics Change HistoryMarch 3, 2020Interview with Frank Snowden, history professor and author of 2019's “Epidemics and Society: From the Black Death to the Present"
                Joey S Kim - Orientalism in the Age of COVID-19March 4, 2020Critical comments on the reproduction of orientalism in crisis periods
                Geoffrey Gertz - The coronavirus will reveal hidden vulnerabilities in complex global supply chainsMarch 5, 2020On relations between COVID-19 and international trade
                Karin Fischer - With Coronavirus Keeping Them in U.S., International Students Face Uncertainty. So Do Their Colleges.March 6, 2020Discussion of the effects of COVID-19 for international students in the US
                Clare Wenham, Julia Smith, Rosemary Morgan (on behalf of the Gender and COVID-19 Working Group) - COVID-19: the gendered impacts of the outbreakMarch 6, 2020Lancet article on the gendered impact of disease outbreaks, COVID-19
                Sandro Galea - The Poor and Marginalized Will Be the Hardest Hit by CoronavirusMarch 9, 2020How COVID-19 and its effects relate to public health policy and specific social groups
                Zuzanna Stanska - Plague in Art: 10 Paintings You Should Know in the Times of CoronavirusMarch 9, 2020Discussion of plague related art works by art historian Zuzanna Stanska
                David Evans & Mead Over - The Economic Impact of COVID-19 in Low- and Middle-Income CountriesMarch 12, 2020Early analysis from the Center for Global Development on the economic impact of COVID-19
                Jeffrey Sachs interview - Capitalism Versus CoronavirusMarch 12, 2020"Columbia professor and economist Jeffrey Sachs joins Mehdi Hasan to discuss American capitalism’s failure to deal effectively with the coronavirus"
                Zheng Jiawen - How COVID-19 Changed the Conversation About Chinese JournalismMarch 12, 2020Piece on Chinese journalism by Zheng Jiawen, researcher in Journalism and Communications
                Joel Christensen - Plagues follow bad leadership in ancient Greek talesMarch 12, 2020Classical Studies perspective on ancient plagues
                David Jones - History in a Crisis — Lessons for Covid-19March 12, 2020Article in the New England Journal of Medicine on the history of epidemics
                Thomas Nail - Why a Roman philosopher’s views on the fear of death matter as coronavirus spreadsMarch 12, 2020Philosophicsal perspective on the relevance of Lucretius for the current crisis
                Joseph Baines and Sandy Brian Hager - COVID-19 and the Coming Corporate Debt CatastropheMarch 13, 2020Political economy blog on COVID-19
                Naomi Klein interview - Coronavirus Is the Perfect Disaster for ‘Disaster Capitalism’March 13, 2020Interview with Naomi Klein
                Liesl Schillinger -What We Can Learn (and Should Unlearn) From Albert Camus’s The PlagueMarch 13, 2020Literary studies perspective on epidemics through discussion of Camus' The Plague (1947)
                Urban Political Podcast - The Urbanization of COVID-19March 14, 2020"Three prominent urban researchers with a focus on infectious diseases explain why political responses to the current coronavirus outbreak require an understanding of urban dynamics".
                Mike Davis on Coronavirus: “In a Plague Year”March 14, 2020Political critique of capitalism in the context of COVID-19
                Eric Klinenberg - We Need Social Solidarity, Not Just Social DistancingMarch 14, 2020Widely shared opinion piece by sociologist Eric Klinenberg
                Karen Kendrick - Is This What Sociology is for?March 15 2020Reflective piece by sociologist Karen Kendrick
                Slavoj Zizek - Monitor and Punish? Yes, please!March 16, 2020Philosopher Slavoz Zizek's critical response to earlier comments made by Georgio Agamben
                Katherine A Mason - Gasping for Air in the Time of COVID-19March 18, 2020Closer examination of the Chinese response, relating to air polution
                Rupert Beale - Wash Your HandsMarch 19, 2020Partially reflexive piece by clinician scientist Rupert Beale
                The Point - Quarantine JournalMarch 19, 2020 - OngoingCollection of literary and philosophical reflections on quarantine conditions
                David Harvey - Anti-Capitalist Politics in the Time of COVID-19March 20, 2020"As Marxist geographer David Harvey argues, forty years of neoliberalism has left the public totally exposed and ill prepared to face a public health crisis on the scale of coronavirus"
                Jennifer Beam Dowd, Valentina Rotondi, Liliana Andriano, David M. Brazel, Per Block, Xuejie Ding, Yan Liu, Melinda C. Mills - Demographic science aids in understanding the spread and fatality rates of COVID-19March 20, 2020Short paper on the relevance of demographic data & research for COVID-19 and governmental responses
                Julia A Thomas - The Blame Game: Asia, Democracy and COVID-19March 25, 2020Historian Julia Thomas critiques reproduction of false East-West dichotomies in Western media commentaries
                Dimitris Xygalatas - Why people need rituals, especially in times of uncertaintyMarch 25, 2020Anthropologist comments on the emergence of rituals in new COVID-19 context
                The COVID19 Mobility Monitoring working group - The reduction of social mixing in Italy following the lockdownMarch 25, 2020Presentation of early data from Northern Italy on the effects of mobility restrictive policies, by Emanuele Pepe, Paolo Bajardi, Laetitia Gauvin, Filippo Privitera, Brennan Lake, Ciro Cattuto, Michele Tizzoni
                Bruno Latour - Is This A Dress Rehearsal?March 26, 2020Bruno Latour in Critical Inquiry on relating COVID-19 to the climate crisis
                Joshua Clover - The Rise and Fall of Biopolitics: A Response to Bruno LatourResponse: March 29, 2020A critical response to Latour
                Emily Mendenhall - Why Social Policies Make Coronavirus WorseMarch 27, 2020On Covid-19 as a syndemic & its relation to (US) social policy
                Adrian Ivakhiv - Pandemic politics: on disaster capitalism, socialism, and environmentalismMarch 30, 2020Discussion of COVID-19's relation to ecology and environmental governance
                Andrea Vicini - Life in the Time of CoronavirusMarch 31, 2020Reflections and discussion on Corona virus from Professor of Moral Theology and Bioethics Andrea Vicini
                Jeff Roy & Drake Paul - The Art of QuarantineMarch 2020Collection of iconic art remade to relate to social distancing
                Giacomo Lee Interviews J Roy on The Art of Quarantine - What if subjects of iconic paintings practised social distancing?Follow-up: April 2, 2020Accompaniment to the above 'The Art of Quarantine'.
                A Journal of the Plague Year: An Archive of COVID19March 2020 - OngoingA 'curatorial consortium' project: Repository meant for 'future historians', which asks visitors 'to share your experience and impressions of how CoVid19 has affected our lives, from the mundane to the extraordinary, including the ways things haven't changed at all. Share your story in text, images, video, tweets, texts, Facebook posts, Instagram or Snapchat memes, and screenshots of the news and emails--...'
                Nawil Arjani interview with Sheila Jasanoff - Science Will Not Come on a White Horse With a SolutionApril 6, 2020STS scholar Sheila Jasanoff comments on the lack of attention to social ramifications of COVID-19 and governmental response
                Liz Kimbrough - Field research, interrupted: How the COVID-19 crisis is stalling scienceApril 9, 2020How COVID-19 affects forms of field research
                Dinesh Sharma - Coronavirus Unmasks Global InequalitiesApril 12, 2020Examination of the multifaceted effects of COVID-19, framed in relation to the UN's Sustainable Development Goals
                ]]>
                Jochem Zuijderwijk
                Beyond Open Access articles: briefs can provide wider and faster access to scientific knowledgehttps://www.leidenmadtrics.nl/articles/beyond-open-access-articles-briefs-can-provide-wider-and-faster-access-to-scientific-knowledge2020-04-09T13:00:00+02:002024-05-16T23:20:47+02:00Many journals are making research on COVID19 publicly available. This is valuable, but studies on usability of research suggest scientists need to develop media to quickly reach professional stakeholders. Diego Chavarro explains how briefs helped address faster the bud rot disease in palm oil.Open Access (OA) is key to achieve a greater dissemination of knowledge among scholars. Its benefits are acknowledged and advocated by many researchers, universities, and funding agencies internationally. They have produced global manifestos and implemented collective actions to make publicly-funded research open. Latin America is an example of how OA can contribute to the dissemination of knowledge through OA journals and bibliographic databases such as Scielo and RedALyC.

                However, access by itself does not guarantee a closer engagement between science and society at large, which it is the aim of Open Science (OS). In this post I reflect on a previous case study (Chavarro 2017; Chavarro, Tang, & Ràfols2018), reinterpreted here to show how OA could be enhanced to increase its social impact. I also reflect on some challenges that the social impact of OA pose to science policy1.

                The need for alternative publication formats

                The Budapest Open Access Initiative understands OA as “world-wide electronic distribution of the peer-reviewed journal literature and completely free and unrestricted access to it by all scientists, scholars, teachers, students, and other curious minds”. Many initiatives – such as OA databases and institutional repositories – provide access to this peer-reviewed literature, mainly to research articles.

                However, it is well-known that research articles are written in technical language that is not “accessible” to everyone. In many cases, these articles are too technical for the people who could benefit the most from the research, such as farmers and other stakeholders. If we take into account that a lot of the academic literature is published in English, even if those stakeholders had free access to the papers they would face a big linguistic barrier to use that knowledge.

                Such is the case of bud rot disease research. This disease affects the African oil palm, which is grown in countries in the equatorial belt such as Colombia, Malaysia, Indonesia, Thailand, and Nigeria. It is a large-scale crop that provides employment comparable to crops such as soybeans. Due to its economic importance, diseases that affect the plant have large consequences for employment. For this reason researchers on bud rot need to make sure that their findings reach people outside academia.

                Bud rot kills the plant completely and leaves it unproductive. One of the main problems is that there is uncertainty about the cause of the disease. In Colombia, researchers at Cenipalma – a research institute for the study of Palm – found evidence that bud rot is caused by a type of mould called phytophtora palmivora.

                An analysis of this research on the causes of the disease by Cenipalma’s researchers showed that it was first published as briefs for farmers instead of academic publications. The following figure shows this team published results about bud rot early as a brief and it was only later that they published in OA and later to paywall journals.

                Figure 1 diego chavarro
                Figure 1. Chronological publication of findings on the causes of bud rot disease by Cenipalma’s researchers. The arrows show flux of citations. Head of arrow indicates citing source.

                When asked about the reasons why the results were published initially as briefs, a researcher said that their priority is “contributing to the improvement of farmers' quality of life”. Another researcher said:

                An interviewee deepened in the explanation for their choice of publication media:

                Therefore, in this case the researchers published briefs because of their proximity to the readership they wanted to reach and also because they do not have the pressure to publish in high-impact journals. They chose an accessible – in the sense of non-formal scientific communication – format to ensure use of their knowledge beyond academia.

                Some policy challenges

                The case of bud rot disease shows some demands of researchers from Open Access (OA) in an age of Open Science (OS). Basically, researchers need venues to publish research that can be accessed, understood, and used by stakeholders beyond academia. The case indicates that OA – understood as access to peer-reviewed literature – is necessary but not sufficient to improve the use of scientific knowledge in society, which is an aim of OS. OS, then, poses important communication challenges.

                These challenges extend to public policy for OA. Although many public institutions promote free availability of research papers, this promotion is based on a generic understanding of the readers. Basically, OA policies assume that the readers of scientific research are scientists with the same capabilities and interests as those who publish the papers. This assumption is incorrect, because from an OS perspective the readership of scientific research includes not only scientists, but also people in governments, companies, and other social groups – as shown by the case in this post. It also overlooks the imbalances that exist within the global scientific community, in which some countries concentrate high capabilities and resources while others lie at the periphery in many fields.

                For instance, researchers in Colombian universities will face barriers to reproduce OA results and methodologies published by researchers in the pharmaceutical industry in the USA and Germany because they lack key equipment, reagents, proximity to suppliers, etc. Therefore, scientific capabilities are not uniform across regions.

                Readership and disparities within the scientific community point out the need to develop a more comprehensive approach to OA. If OA policies are to contribute to OS, they need to explicitly support the production of information for different types of readers (scientists and non-scientists), ensure that research on relevant subjects find suitable publication venues, and complement OA policy with support for infrastructure, international collaboration, and capabilities development. Otherwise the benefits of OA for many countries, especially those with low investment on science, technology, and innovation, will be yet another unfulfilled dream.

                From the point of view of journal promotion, the cases show the need to identify and foster communication channels and local journals that are underestimated by current research evaluation systems (Chavarro, Ràfols, & Tang 2018). Given that these systems are mainly based on standardized – as opposed to diverse – ways of valuing contributions to knowledge, OS can be hindered, contradicting stated governmental intentions to support it. Therefore, if OS is to be fostered, research evaluation systems should be transformed to be in agreement with these intended policies.

                A way to support the development of journals and alternative communication channels that contribute to OS is by better understanding in which ways they can contribute to the economy, the environment, and social issues. This requires research on the communicative functions of science that go beyond academic prestige and scientific impact, especially in the applied and social sciences. For instance, neglected diseases is a subject of clear importance for many countries in which fostering new communication functions is needed. Therefore, regions such as Latin America could allocate funding for research on the communicative functions of science to foster OS.

                One can think of other demands related to the above: diversity of languages, gender, geography, among others, play an important role in achieving a closer engagement between science and society. Recognizing and promoting this diversity as part of scientific communication goes in the direction of OS, and provides a way to reinterpret OA from a business model for academic diffusion to an integral mode of knowledge production and communication.

                1 The data was gathered through interviews with researchers from agricultural sciences, chemistry, and business & management in Colombia. The interviews were aimed at understanding their motivations to publish in journals that are not considered part of the mainstream, specifically journals in Spanish or Portuguese managed mainly by universities instead of publishing houses.

                ]]>
                Diego Chavarro
                Pre-COVID-19 workshop on virtual meetings and conferenceshttps://www.leidenmadtrics.nl/articles/pre-covid-19-workshop-on-virtual-meetings-and-conferences2020-04-07T12:44:00+02:002024-05-16T23:20:47+02:00While attending a workshop on virtual meetings in academia, our author Carole de Bordes would not have expected how relevant this topic would soon be. This blog post gives insights into some solutions for more sustainable conferencing and collaboration from today’s perspective.At CWTS, many researchers travel around the world to attend conferences, meet with relevant stakeholders, give lectures and/or provide trainings. But what are the costs of all these travels? There are many reasons to avoid flying and to facilitate virtual conferencing, including climate change, work pressure, and seeking to include a diverse audience. Well, in addition to that, we can add the rapid spread of a pandemic for several weeks now…

                On the 20th of February, I followed – physically – a workshop at the Leiden Centre for Innovation and Entrepreneurship (organized in partnership with Leiden University) on virtual meetings and conferences. This fruitful event was organized as a Design Thinking afternoon where participants met and interacted to come up with solutions for sustainable (digital) events. One must say: what a bizarre coincidence to attend such a workshop just a few weeks before the COVID-19 crisis really hit the Netherlands – implying social distancing and remote working.

                In this blog post, I will present the most relevant outcomes of the workshop for our institute and will follow up with a short discussion of the impact of the COVID-19 crisis on our daily (new) routines at CWTS.

                Before attending this workshop, I set two main goals for myself:

                • To learn from best practices to help in convincing my colleagues to organize conferences and meetings in a sustainable way, including flying less;
                • To be able to provide input on possible improvements of the available technology for virtual conferencing and remote working.

                  In the workshop, we discussed the use of tech-solutions as well as non-tech solutions concerning three different cases. 

                  1. If you cannot or do not want to attend a conference (or meeting) physically, a few options are available:

                  • Attending the meeting virtually by using a digital tool such as Skype for Business, Microsoft Teams meeting, etc.
                  • Organizing and/or attending “hub meetings”: instead of travelling to the other side of the world, you can set a hub in your region to avoid flying and to enjoy the benefits of meeting physically with other people.
                  • Using and piloting a telepresence robot: the chance to try and "beam" yourself into a distant robotic body is an exciting idea. However, would you get the same experience as being there physically? Considering that most interactions between people occur during informal moments such as coffee breaks, the robot would hardly be able to replace you!

                  2. If you decide to organize a digital meeting yourself, one important step to take is to define some rules of engagement for the people who participate virtually. It is important to communicate in advance how to access the meeting and to make sure that everyone has the digital tool available on his computer. Then, you need to decide: Who will chair the meeting? Who will take notes? You also need to make sure that virtual attendees are able to participate, for example by using a chat option. You need to ask people to mute themselves to prevent sound disruptions unless you have agreed before starting the meeting that participants can contribute to the discussion by asking questions at any time. Such rules seem to be implicit, but they are necessary for the smooth running of the meeting. Additionally, some tips were suggested by the audience to keep people online and awake for a full day of conference:

                  • With the “carrot” incentive, you get something if you stay until the end of the day.
                  • Everyone gets a “buddy” to check on regularly. This enhances interaction and accountability.
                  • Being creative during lunch or coffee breaks. For example, someone could organize a live Spanish cooking class (i.e., from a Spanish participant) to virtually share a tapas lunch.

                  One-third of the workshop participants attended virtually. Like that, we got live experience in what it means to have 16 people connected and being able to interact with us. Personally, I found it impressive and well organized but also distractive… My focus was mostly on the chat appearing on the right side of the screen instead of the speech given by the lecturer.

                  3. If you wish to attend a conference (or meeting) in person or plan to organize an event yourself, you might want to find sustainable solutions to limit your carbon footprint. To think further about this, participants were divided into groups (with all the virtual participants forming one single group) and asked to discuss and come up with a list of tips. Below are a few examples:

                  • Travelling by train instead of plane if possible.
                  • Selecting a venue that already supports sustainable practices.
                  • Choosing a catering supplier that offers a meat-free diet, uses reusable eco coffee cups made from a sustainable material like bamboo, offers tap water in jars instead of plastic bottles, uses seasonal and/or local products, etc.
                  • Asking participants in advance if they would like a full portion or half portion for the meals to avoid food waste.
                  • Handing out reusable goodie bags.

                  All in all, this workshop was a very enriching experience for me. I learned a lot and more importantly, it made me realize that moving towards virtual conferences and meetings is not only an option anymore but a necessity. Virtual meetings are powerful tools to ensure organizational continuity in emergency situations.

                  In the time of the COVID-19 crisis, more and more countries around the world take extreme measures to prevent the spread of the virus. It results in universities, public administration, and private companies being closed. The “ordinary” practices of our daily work routines have changed considerably. We have to rethink how we structure our work, how we can be creative when sustaining productive interactions with colleagues through alternative channels and at the same time even keep up-to-date with research related to the current crisis. To do so, CWTS has been developing new ways of communication and working strategies over the past weeks:

                  • Use of a new platform “Microsoft Teams” to exchange information.
                  • Meetings are replaced by virtual meetings including a virtual plenary meeting every week with all employees.
                  • Coffee chat every day at 10h and Friday afternoon drinks at 16h via Microsoft Teams.
                  • Weekly email updates regarding the current working situation and the measures by the university.
                  • Formation of project groups investigating research on COVID-19 to bundle efforts and ideas.

                  To make sure that our remote work is being done in an efficient way, our managerial and ICT teams have been working amazingly hard. If we look back at these past weeks, we can be proud of our new way of working, with all the efforts, challenges and opportunities that come with it.

                  Even though I believe that virtual meetings can never entirely replace face-to-face meetings, there is hope that things can change and that our daily work practices can contribute to a more sustainable world! And maybe, in the end, this current experience will have made us rethink the ‘normalcy’ we are so used to.

                  ]]>
                  Carole de Bordes
                  Scholarly Knowledge Graphs: A Call for Participationhttps://www.leidenmadtrics.nl/articles/scholarly-knowledge-graphs-a-call-for-participation2020-03-23T17:11:00+01:002024-05-16T23:20:47+02:00The scholarly community has worked hard to make its publications machine-findable, but not the knowledge within these publications. This is changing thanks to projects such as the Open Research Knowledge Graph, and you can participate!How scholarly knowledge is communicated – using natural language, data in tables and images as digital PDFs – severely limits the extent to which machines can help us in searching, exploring and exploiting scholarly knowledge. In the age of modern information infrastructures and digitalization, it is unsatisfactory to continue presenting scholarly knowledge solely as text-based documents. To address this, the TIB-led project Open Research Knowledge Graph (ORKG) advocates for the production of machine-actionable representations of as much scholarly knowledge published in the scholarly literature as possible.

                  Thanks to the FAIR (Findable, Accessible, Interoperable, Reusable) Data Principles, machine-actionability of research data has been receiving considerable attention. Research Infrastructures have attained a high degree of professionalism in regards to implementing ICT best practices in data curation and publication of analysis-ready data. I am thinking in particular of those on the ESFRI Roadmap such as the Integrated Carbon Observation System (ICOS) and the European Research Infrastructure for the observation of Aerosol, Clouds and Trace Gases (ACTRIS) but also comparable continental-scale infrastructure outside Europe such as the US National Ecological Observatory Network (NEON) and infrastructure in Social Sciences and (Digital) Humanities and other non-STEM disciplines.

                  Data published by Research Infrastructures typically conform to community standards in syntax (format) and increasingly semantics, as community-agreed terminology is used to describe the meaning of data. Also, data access is no longer only available through a download link but increasingly supported programmatically via a Web-based API1. The result is dramatically increased machine-actionability of data published by Research Infrastructures: given a Persistent Identifier, such as a DOI (Digital Object Identifier), machines can directly access data, load them into data analysis environments, and even perform some data integration tasks, say convert data to a common unit of measurement.

                  The same cannot be said for the scholarly information and knowledge (possibly derived from primary data published by Research Infrastructures) published in the scholarly literature. Take for instance a statistical hypothesis test with input ‘dataset’ and output ‘p-value’ reported as result in a scholarly article as text and supported by a figure. Such information is hardly FAIR for machines. Indeed, machines cannot easily find and access this information, let alone read and process it. Since it materializes as a PDF document, scholarly knowledge is not machine interoperable and reusable.

                  What if scholarly knowledge communicated in the scholarly literature would be FAIR, also for machines? What if the global scholarly knowledge base would be more than a repository of digital documents? How would this change the global access to as well as the reuse of scholarly knowledge?

                  We invite the scholarly communication, information science and related research communities to contribute to the vision and the ORKG, specifically, and help to shape the future of scholarly communication. You may find several opportunities to collaborate here.

                  1 An API (Application Programming Interface) is an interface that supports querying, retrieving or posting data from/to another system.

                  ]]>
                  Markus Stocker
                  Launch of Platform for Responsible Editorial Policieshttps://www.leidenmadtrics.nl/articles/launch-of-platform-for-responsible-editorial-policies2020-03-17T10:00:00+01:002024-05-16T23:20:47+02:00We are happy to announce that, as of today, the Platform for Responsible Editorial Policies (PREP) is available via www.responsiblejournals.org.What is PREP?
                  PREP is an online platform contributing to the responsible organisation of editorial procedures by scholarly journals. It facilitates journal editors to become transparent about their editorial procedures, advises journal editors and publishers on potential improvements of their peer review procedures, and presents integrated information about the variety of review procedures currently in use. PREP also maintains a database of journals’ current peer review formats and provides information and tools for journals to use journal metrics in a responsible way.

                  Screenshot of a part of PREP’s statistics page showing percentages of the level of anonymity of reviewers of journals in PREP.

                  Why do we need PREP?
                  The editorial assessment of journal submissions and the embedding of peer review in this assessment is becoming increasingly complex and diverse. Some journals are experimenting with radically new ways to judge whether manuscripts are fit for publication, such as mega journals abandoning importance or expected impact as a selection criterion. Other journals are moving beyond the idea that manuscripts reporting on research projects should constitute the nexus for assessment. Traditionally, peer review takes place between submission and publication of a manuscript. However, recently, two new forms of peer review timing have emerged; post-publication review, and pre-submission, in the form of registered reports.

                  The arrival of these innovations in an already diverse set of practices of peer review and editorial selection means we can no longer assume that authors, readers and reviewers simply know how editorial assessment operates. A recent call for more transparency of peer review procedures underlines the relevance of PREP, since PREP wants to contribute to editorial transparency by making information available on how journals organise the assessment of submissions. PREP also wants to help journal editors to document and make transparent their own assessment procedures. In addition, PREP wants to provide better knowledge of whether and how the various forms of editorial assessment contribute to improvements in the research publication system. To achieve these goals, PREP provides a database, support to clarify journals’ editorial assessment, and an overview of evidence of strengths and weaknesses for various forms of peer review and other editorial assessment procedures.

                  Database
                  First and foremost, PREP provides insight into specific journals’ peer review procedures in the form of a database based on a dozen questions. The answers to these questions characterise the editorial procedures of a journal, including the type of peer review used. This includes the anonymity level of authors and reviewers, whether digital tools such as plagiarism scanners are used, or the timing of peer review in the research and publication process. PREP displays which journals are using which procedures and presents aggregate statistics of their occurrence across journals. The answers of 353 journals to the dozen questions on their editorial procedures form the start of the openly accessible editorial procedures database.

                  Screenshot of PREP’s database.

                  The twelve questions on the journals’ editorial practices concern:

                  • Timing of the review process in the publication process
                  • Selection criteria
                  • Type of reviewers
                  • Author anonymity
                  • Reviewer anonymity
                  • Accessibility of review reports
                  • Interaction between actors
                  • The extent to which the review tasks are structured
                  • Statistical review
                  • The extent to which reviews from external sources are used
                  • Digital tools
                  • Facilitation of reader commentary as a form of post-publication review

                  Become transparent
                  PREP invites editors to provide the relevant information for their journals and thereby include them in the database. With this information, editors can facilitate transparency of review procedures and contribute to open science. Based on the answers to the twelve questions, PREP will include tailored suggestions for potential improvements to editorial procedures, including issues particularly relevant to the journal’s research area (such as the specialised review of statistics, if relevant).

                  PREP also suggests possible improvements on the journal’s transparency of peer review procedures and editorial policies such as policies on corrections and retractions, in line with the transparency declaration. To further help journals to become transparent about their editorial policies, PREP generates textual material that can be used on a journal’s webpage to foster transparency about its peer review procedures.

                  Information about peer review
                  With so many different shapes and flavours in editorial procedures, it might by now be difficult for journal editors to get a good and comprehensive overview of the possibilities for their editorial process. To address this, PREP provides web-friendly information about different review procedures. It explains the difference between various procedures, e.g. single-, and double-blind procedures, open review, or registered reports, including the rationale for their development and the evidence-base for their effectiveness in the literature. This information including infographics is freely accessible and can thus be used for information, training, and educational purposes.

                  With these features, PREP aims to contribute to more responsible journal management and to open science. By supporting authors, reviewers and editors in obtaining information about the editorial process of academic journals, it addresses well-known issues with one of science’s central institutions. By facilitating journal editors and publishers to transparently share their review procedures and by providing suggestions on alternative review options, it additionally aims to support some of the key stakeholders in academic publishing. This should ultimately lead to more open and responsible publishing.

                  Screenshot of a part of PREP’s information page on different peer review policies.

                  The PREP website was constructed by Henri de Winter, Patrick Kooij and Nees-Jan van Eck, together with the authors of this blog.

                  ]]>
                  Wytske HepkemaSerge HorbachWillem Halffman
                  PIDapalooza 2020, Lisbonhttps://www.leidenmadtrics.nl/articles/pidapalooza-2020-lisbon2020-03-13T12:30:00+01:002024-05-16T23:20:47+02:00At the end of January, I went to the PIDapalooza festival: the open festival of persistent identifiers. You can read everything about my experience in this post.Taking place in the beautiful sunny Lisbon, PIDapalooza 2020 feels like a festival from the start. With free festival t-shirts, wrist bands and a Nails and Instant Tattoos corner, participants easily got into the fun mood of the event. Some of those who have attended the previous editions of the event were wearing festive hats and t-shirts from the previous edition of the festival. I also picked up my first PIDapalooza merch.

                  Zeynep Shirt

                  Maybe some readers are not familiar with what PID stands for, so I will give a brief explanation. PID or PI, persistent identifier, is a long-lasting reference to a digital item. Some examples could be ISBN, ISSN and DOIs. PIDapalooza is a festival that has been organized by experts from California Digital Library, Crossref, DataCite and ORCID. The event responds to the need for a platform where researchers and stakeholders working on PIDs can gather and exchange ideas.

                  The welcome speech on the first day was accompanied by Salvador Sobral’s Eurovision winning song Amar Pelos Dois, played live on stage with a guitar. This lovely treat was followed by the organizing board lighting an Olympic torch while Eternal Flame by The Bangles played in the background. That torch stayed lit in the main conference hall throughout the event as a light-hearted symbol of the festival.

                  The first keynote address, given by Maria Fernanda Rollo, provided us with valuable insight on the use of persistent IDs within the education system of Portugal. Parallel sessions continued to reflect the lively spirit of the festival. To give a couple of examples, it was a pleasure to follow the FAIRytale presentation of Stephanie van de Sandt with delightful drawings, interactive multiple-choice questions and captivating narratives. Gaelle Bequet’s presentation featured a jazz quiz and the audience had to guess the musician and name of the track. The Research Organization Registry (ROR) team wore lion masks as they organized a group drawing activity for the audience.

                  In the second half of the first day, the presentation of European Open Science Cloud (EOSC) FAIR1 Working Group, part of the European Open Science Cloud Governance, was quite insightful as they are developing a policy concerning the use of PIDs to support FAIR research. In the second keynote of the day, Beth Plale, from the National Science Foundation, talked about persistent IDs in relation to open science. The day ended with a lively reception, a group photo and a quiz.

                  Group photo

                  On the second day, morning presentations focused more on methodologies and tools specifically designed for data harmonization, while the afternoon presentations included more group activities, interactive participation and a party attitude. In the morning, I attended the presentation of Richard Wynne, who introduced the tool Rescognito which concentrates on researcher recognition and the presentation of Tommi Suominen, who showed us PID examples and methodologies from the Finnish Research Information Hub. Both were quite insightful and informative.

                  The last keynote of the festival, given by Kathryn Kaiser, lifted the post-lunch mood of the audience. Kaiser threw a glittery unicorn beach ball into the audience and we played with it until everyone touched it.

                  The keynote, with its unique sense of humour we don’t usually see at conferences, came to an end with a couple of volunteers dancing on stage: a Librarian, Publisher, Repository, Funder and, last but not least, Science.

                  In the end, it was the Funder that won and the prize was going home with the unicorn beach ball!

                  After the keynote, we listened to the history and the future of the DOI from Jonathan Clark in yet another entertaining presentation. Afternoon presentations did not lose any momentum and the audience was as energetic as the first morning. Two more interesting presentations followed in the parallel sessions I attended. Mohammed Hosseini presented the browser plug-in he is developing, MyCites. This plug-in confirms or rejects the accuracy of citations, making the process more transparent and easier to handle in the case of a large number of citations. Presented by Josh Brown and our CWTS colleague Clifford Tatum, the presentation about the SURF Infrastructure ID was very promising in linking together three different PIDs. Making use of ORCID, Crossref’s Grant ID, and ARDC’s Research Activity ID (RAiD), this PID aims to provide a more efficient and accurate evaluation of infrastructures that are used.

                  Just like the welcome speech, the closing remark was accompanied by music. The organizers were still full of energy and happy about organizing such a successful event. We participated in giving feedback to the organizing team and voting for the location of the next festival. Amsterdam was among the cities that received the highest number of votes. Who knows what the future holds for us?

                  PIDapalooza was a very different conference experience for me and probably for most people who participated for the first time. It was a gathering where serious topics were discussed but we also had so much fun. With my blog post, I would also like to congratulate the organizing team for organizing such an awesome event and I look forward to seeing many such successful editions!

                  Note: I would like to thank Ludo Waltman and Clara Calero Medina for letting me represent CWTS in Lisbon.

                  ]]>
                  Zeynep Anli
                  Sorbonne declaration on research data rightshttps://www.leidenmadtrics.nl/articles/sorbonne-declaration-on-research-data-rights2020-03-12T13:30:00+01:002024-05-16T23:20:47+02:00Earlier this year, representatives of nine university networks met at the Sorbonne to issue a declaration for the promotion of Open Data. But what, exactly, is Open Data, and how does it relate to the larger Open Science discussion?Walking through the halls of Sorbonne University last month, I find an announcement on a wall that would catch the eye of anyone interested in Open Science (OS): it was the Sorbonne Declaration on Research Data Rights. Signed at this very university a few weeks ago, the Declaration was published on January 28 at the LERU website, and it is an important document to promote Open Data. But what exactly is Open Data?

                  When we talk about Open Science, most people think about Open Access (OA). This is probably the most discussed dimension of OS within the academic community. Not everyone knows that there is much more to OS, especially if you consider the five schools of thought proposed by Fetcher and Friesike (2013). From this perspective, OA is part of the Democratic School, one that calls for equality in the distribution and access of knowledge. Even though Open Data also exists in the same school, it can relate to other distinct and important ones:

                  1. Pragmatic school: scientists working together, and sharing their research data, can be more efficient in the creation of knowledge;
                  2. Infrastructure School: efficient research depends on proper tools and applications that, for instance, can make data FAIR (Findable, Accessible, Interoperable and Reusable);
                  3. Measurement School: access to research data can be a pivotal part of peer-review and other types of evaluation to guarantee the quality of science and its reproducibility.

                  With all of these Open Data perspectives in mind, we can see the Sorbonne Declaration as a necessary call to action directed towards the international research community, funding bodies, and governments. The authors, from nine University networks1 (representing over 160 institutions worldwide), deliver an unequivocal message: everyone should be talking about sharing research data and, more than that, it’s time for people to put their money where their mouths are. In other words, the signatory universities declare their willingness to share their research data, and that they are committed to work for that to happen. But, it also says that this cannot happen successfully unless every other player in the game can deliver on their parts as well.

                  Thinking of all that from the CWTS perspective, our centre is currently developing its own Open Science policy, and our team has had the chance to discuss concerns and desires quite in line with those expressed by the Sorbonne Declaration. From the fruitful debate I have been involved over the past months, I can think of some critical challenges to make Open Data a reality and, for now, I want to share two of them for reflection and discussion:

                  1. It takes time to open a data set and to document it properly. Will universities and funders acknowledge the time researchers dedicate to that activity in future rewards and incentives schemes?
                  2. A researcher that makes “fresh data” available to the community helps accelerate scientific discoveries, as more people can work on the data at the same time. Will the sharing of such data be adequately rewarded to compensate for possible opportunity losses (since someone else may use your data to investigate and publish about something you had planned to do but did not have the time for)?

                  So, what is your opinion? What do you think it would take to make Open Data a reality? Do you believe the Sorbonne Declaration might be an important step to further the debate?

                  1 Association of American Universities (AAU), African Research Universities Alliance (ARUA), Coordination of French Research-Intensive Universities (CURIF), German U15, League of European Research Universities (LERU), RU11 Japan, Russell Group, The Group of Eight (Go8), U15 Group of Canadian Research Universities.

                  ]]>
                  André Brasil
                  Gender inequalities in science: Evidence and ideas from bibliometricshttps://www.leidenmadtrics.nl/articles/gender-inequalities-in-science-evidence-and-ideas-from-bibliometrics2020-02-13T14:00:00+01:002024-05-16T23:20:47+02:00Leiden University hosted the Gender Inequalities in Science workshop in October 2019 - organized by CWTS and Elsevier’s International Center for the Study of Research - where researchers from around the world discussed the gender gap in science and possible ways to counter this problem.The Gender Inequalities in Science workshop took place at Leiden University on 7th-8th October 2019, organized jointly by CWTS and Elsevier’s International Center for the Study of Research (ICSR). For two days, researchers from different research institutions, universities and science stakeholders discussed issues concerning gender in science from diverse perspectives and contexts. The workshop started with a reflection from Ludo Waltman about the much-needed diversity in science and the inclusion of a gender indicator in the Leiden Ranking. He also underlined how controversial and challenging gender in science can be as a topic of scholarly discussion. The workshop included presentations from various backgrounds, followed by discussions starting with discussants who introduced some questions to the presenters for a constructive and lively debate.

                  Looking beyond publication counts

                  During the workshop, studies that focus on important themes such as citation gap, distribution of researchers, leadership, career trajectories and collaboration were presented from the perspective of bibliometrics and gender.

                  The first question that was raised concerned the notion of gender bias in citations. Jens Peter Andersen and Jesper Schneider showed some studies supporting and rejecting this idea. In their paper, they identified the gender of all authors in biomedical fields and performed a robust statistical analysis showing small differences in citations in favor of male researchers. However, they claim that this difference is of little or no significance due to the extensive overlap in the distribution of citations. There are also other factors that play a role, such as the circulation of a few highly cited papers, women being deliberately less cited, men self-citing more, the tendency of gender-based topic specialization and women engaging more in interdisciplinary research that statistically shows fewer citations. On top of all these factors, prestige undoubtedly attracts more citations. Men are usually more established in their fields and are at more prestigious positions compared to women of the same age group. These are some of the implicit and under-researched biases that publication counts may not directly show.

                  Looking at career trajectories and time trends between 1996 and 2018, Hanjo Boekhout and Inge van der Weijden identified the gender of their researchers based on their first names and countries of origin in order to understand the coverage of female authors in science, their dropout rate and career development per country and per field. Their study showed that while women’s career development is slower and men have a higher probability of staying in academia, there is also a gradual trend toward broader gender parity. This trend is also supported by the analysis published in Elsevier’s global gender report, presented by Holly Falk-Krzesinski. In line with the tenets of Horizon 2020, Elsevier’s report seeks to answer the demand of data to help close gender disparity in science. Even though gender parity is on the rise, the report shows that there is still a wide gender gap in science in many countries.

                  Presentations led to some suggestions for methodological changes, such as moving the focus from a paper-based approach to a researcher-based approach to have a better understanding of researcher performance. Different coverage of fields in databases and large differences between field citation behaviors were highlighted. In addition to quantitative methodological challenges, there were also concerns about certain dimensions, such as broader societal impact of gender equity, which could not be captured through citation studies.

                  It was also discussed that in applied fields, such as nursing and clinical areas, papers written by women have higher download rates. This could be explained by teaching activity which does not always translate into publication/citation data. Qualitative methods were proposed to understand the reason why women do more teaching while men concentrate more on pure research. Some ideas on women being less competitive and more connected to societal outcomes were also put forward at this point.

                  Seeing that clinical and non-academic research outputs are not distinguished in databases and are not equally valued in career trajectories, redefining the concept of “being an academic” was proposed as a theoretical starting point. Discussions continued on the necessity of employing robustness analyses to check for validity and being meticulous about the interpretation and dissemination of these results.

                  A very interesting question was raised about rejected papers. Holly Falk-Krzesinski answered that at this moment there isn’t much information available about rejected papers as Elsevier doesn’t capture the gender of the authors at the point of entering their system -to avoid bias- but Elsevier is trying to get gender data at the phase of article submission.

                  Lidwien Poorthuis from the Dutch Network of Women Professors[1], and Margot Schel along with Alexandra Vennekens, from Rathenau Institute, presented some findings in the context of Dutch academia. It was concerning to hear that the Netherlands has the lowest proportion of female researchers in academia within Europe, even when half of the PhD candidates in the Netherlands are women. Even though the numbers are gradually improving, women still receive less salary despite the results being adjusted by position and age. Regarding research grants, female academics also report less access to academic and financial resources when compared to their male counterparts. Researchers from the Rathenau Institute also expressed their worries about the lack of transparency and data to thoroughly monitor the career development of female researchers in the Netherlands.

                  Yifang Ma discussed studies showing that women receive fewer and less prestigious prizes; however, they are represented well in awards for advocacy and teaching. Numbers also show that the application rate of women is lower than that of men. When female academics do apply, it is shown that they often receive as many awards as their male counterparts. On the other hand, there is no research based on textual analysis that would show whether women ask for less funding than men. More qualitative research is needed in order to understand why women do not apply for grants as much as men do.

                  Demographic examples from Norway, China, and Brazil

                  Some of the presentations in the workshop were based on the context of Dutch academia; therefore, having information on the contexts of Norway, China, and Brazil offered a welcome opportunity for comparison. The presentations showed that the phenomenon of leaky pipeline, which refers to the decrease in women’s presence at higher levels of academia, is observed in both Norway and China. The Norwegian project, led by Dag Aksnes, aimed at getting quantitative data on productivity, citation impact, networking, international collaboration, parental or sick leave, to understand factors that can explain disparities, making use of bibliometric databases, national statistics, and staff registers. The Chinese project, led by Lin Zhang, on the other hand, focused on careers and contexts that influence researcher development, such as the hierarchical model of the Chinese higher education system and cultural pressure concerning maternity. In both countries, demographic factors, such as the age of entry into academia, were suggested to explain the imbalance as the highest positions at the moment are occupied by academics who had received their PhD degrees in the 80s and 90s when there were fewer women in academia at large.

                  In André Brasil’s presentation, the context of Brazil stands as a good example among the others, as policy has a strong influence on gender equity in academia. In Brazil, public research is conducted at universities, where people are hired through a national selection process. This selection process is considered to be unbiased and everyone at the same professional level receives the same salary across the country. Even though there are more women in academia compared to many other countries, the high concentration of male academics at higher levels is still a trend. This difference was also explained by demographic reasons. One interesting note to mention is that in Brazil women receive more grants than men (60%) and these grants are not only related to research but also teaching.

                  Starting a family as a limitation on women

                  An interpretation of the ages and dropout periods of female researchers could point to the idea that they may be taking breaks in their careers in order to take care of their children. This particular cost of parenting as a factor that affects gender disparity in science was introduced in Gemma Derrick’s presentation.

                  According to the survey 'Models of parenting and its effect on academic productivity', which collected data on parenting practices, the number of publications by researchers of both genders decreases in the event of having children. Parental leave, both maternal and paternal, is aimed as a facility to ease the burden of parenting; however, it is also considered within implicit bias against female researchers. The possibility of women taking parental leave decreases their likelihood of getting hired for certain positions. In some countries, as in the Netherlands, men do not get as much parental leave, which systematically pushes the parental leave burden and bias toward female researchers. On the other hand, women are also criticized for using parental leave as free time for writing more articles or grant proposals. Still, there is no doubt that parenting delays the careers of researchers, but especially the careers of women.

                  Difference or bias?

                  One of the questions that were raised was whether there was a real difference or bias in terms of gender disparity. Alessandro Strumia introduced this question in his presentation about gender bias in the field of physics. He presented a bibliometric study showing no significant differences between genders in giving (self-)citations, hiring rates and timing, career breaks, and abandonment rates in this field. He suggested some controversial interpretations and possible explanations, which were criticized during the following discussion. Strumia emphasized the value of large-scale data analysis, and he seemed to dismiss political, sociological or psychological approaches to the interpretation of his results. His approach was to explain differences using the idea of higher male variability as well as ideas about essentialist tendencies on diversification of interests and attitudes. Strumia mentioned political ideology behind positive discrimination in academia, but he did not seem open to suggestions on the usefulness of feminist theory for understanding of gender differences in science, although the audience pointed to its critical importance.

                  Why gender? Diversity to improve science

                  One of the approaches commonly employed to fight gender disparity is positive discrimination in hiring and grant distribution practices. However, this approach can sometimes be perceived as a way to diminish the merits of women who receive privileges from such discrimination. On the other hand, merely increasing the number of female researchers would fall short in the struggle against gender disparity. A more comprehensive change would be needed for sustainable gender equity in science. If scrutinizing and improving the system is not a priority, adding more female researchers into the same mix would not create lasting change. On this point, Margot Schel and Ingeborg Meijer advocated for changing the approaches typically associated with male-dominant environments. Qualitative studies of early career grant receivers (Meijer and van der Weijden, 2016) reveal that women are less interested in focusing their careers only on the race for publications and grants applications. Instead, they concentrate more on teaching, public outreach, policy writing, and academic practices that advance their career in a much broader sense. Discussants also underlined the idea that a redefinition of excellence would be a step in the right direction. The shortcomings of bibliometrics alone in determining the root of gender issues point to the importance of collaboration with other fields and disciplines.

                  The final presentation by Holly Falk-Krzesinski focused on how publishers can influence policy to promote diversity and change in science. The relevance of this change can be seen in a Lancet study which shows that “[d]iversification in the scientific workforce and in the research populations—from cell lines, to rodents, to humans—is essential to produce the most rigorous and effective medical research". In line with this study, Elsevier provides data to shed light on gender disparity and boost gender diversity in scholarly communications. In 2015, Elsevier started to study the diversity of conference panels, concentrating on the gender bias in the formation of panel members. Elsevier started to emphasize the importance of increasing the presence of women in panels, not only as chairs or moderators but also as researchers. In the end, Falk-Krzesinski underlined the importance of collecting data with an awareness of the consequences and implications of such data. The role publishers and editors have in this process is also very central to the system of science and responsible research, as these crucial actors can implement policies to include more variety of perspectives and research populations in science.

                  Conclusions

                  At the end of each day, small groups were created in the concept of the World Café, where participants discussed questions proposed by organizers, based on the research presented, wrapping up the themes of the day in an interactive way.

                  Photo Andre Brasil Zeynep post

                  The questions of the first day concentrated on methodology for studying diversity. A major challenge identified during this discussion was the difficulty of getting comparable data, which may also include largely hidden pieces of information such as rejection and dropout data from funders and publishers. Other challenges included determining which dimensions to measure, finding suitable indicators and the interpretations of the final data. At the heart of all the challenges also lied the cultural, traditional, biological and societal background concerns regarding gender disparity. Cross-sectional approaches, mixed methods, and text analyses were suggested as attempts to overcome these challenges. More research into integrating perspectives from the disciplines of ethics and feminist theory was also among the suggestions.

                  Second photo Zeynep post

                  On the second day, the questions focused on how research could contribute to developing evidence-based policies to increase gender diversity in science. Increasing the number of female applicants/employees by quota to increase diversity, providing equal treatment and opportunities, and giving female researchers continuous support to maintain their valuable contribution to science were among the propositions of this discussion. On both days the discussions peaked around the limitations to measure implicit biases against women in science, which are by far the most challenging to get reliable data on.

                  Gender Inequalities in Science workshop was a fruitful gathering with vibrant discussions and different suggestions that could lead to new ideas and maybe new research. The workshop took place right after the 17th Gender Summit in the Netherlands, creating a week-long exchange of ideas on gender themes. The upcoming 2020 gender report of Elsevier can be reached here.

                  1 For more information, please see the studies and reports of the Network:Women Professors Monitor 2018
                  Women Professors Monitor 2019Pay gap reports:Part I
                  Part II

                  ]]>
                  Lidia Carballo-Costahttps://orcid.org/0000-0003-3674-2789Zeynep Anli
                  The quackathon: quantitative and qualitative hackinghttps://www.leidenmadtrics.nl/articles/the-quackathon-quantitative-and-qualitative-hacking2020-02-03T11:30:00+01:002024-05-16T23:20:47+02:00Last September we organised the first research retreat at CWTS. Away from our normal workplace and usual thinking patterns we spent two days full of pitches, workshops, presentations, and fun of course. One special element of the research retreat was the so-called "quackathon"."Welcome to the quackathon!". That is how we invited researchers from the CWTS to an afternoon workshop during our yearly first research retreat. But what on earth was that supposed to mean? The reference to a hackathon is fairly obvious. In a hackathon, programmers come together to jointly work on a computer problem and try to solve it during the meeting. We have programmers at our centre. But we have also researchers studying scientific research and its relation to society – both qualitatively and quantitatively.

                  In the previous months, while preparing our research retreat, we discussed the possibility of doing something around the theme of research methods. We did not want yet another abstract discussion about the respective merits and pitfalls of qualitative and quantitative research. Neither did we want a sterile exercise with clearly defined questions. What we aimed for was to let people actively collaborate on a relatively open research problem that had to be 'solved' at the end of the meeting. That is how the quackathon was born.

                  By the way: a quack is also an imposter who does things under the pretence of science – like the alchemist of earlier days. We distance ourselves fully from any negative connotations. But why not find out where a little methodological alchemy could lead us?

                  Organising the quackathon required some preparatory work. We needed a theme that was broad enough to speak to people with different backgrounds and interests, we had to find qualitative and quantitative research material to explore during the event, and we would have to provide some guidance on possible research questions.

                  Thematically, we decided to focus on displacements in science. Goal displacement springs to mind here (an organization might start with one goal but find itself pursuing another later on). But we could just as well speak of linguistic displacement in cases where it was once common to write in one language but where another language now dominates. Or of methodological displacements when there are shifts in the way certain scientific objects – say, 'oceans' or 'the economy' – are studied.

                  Preparing the material was an iterative process. We selected some qualitative material on economics on the one hand and ocean science on the other hand. In an interview setting, for instance, a policy-oriented economist reflected on the way politicians used economic knowledge and on the public engagement of economists. In another example, a marine biologist reflected on the place of impact factors and the distribution of prestige in his field. To complement the interview excerpts we collected bibliometric data of the two fields. We prepared some science maps, providing an overview of various characteristics, highlighting for example what topics were researched by a certain institution, or what topics were published in high-impact journals (see the visualization below for an example). We also just provided the tabular data, allowing for more quantitative analyses. And we went back to the qualitative data: should we perhaps add more to clarify the perspective of the interviewees?

                  Vos Viewer


                  Visualization of publications in economicswith different citation scores

                  We split up all participants in four teams, each of which had an even mix of quantitative and qualitative scholars. We then asked participants: what can you do on the spot – discuss, code, analyse, count, calculate, model – with the provided material? How would you design a new research project in which qualitative and quantitative methods feed back into one another? What have you learned along the way in terms of your own limits and the insights you gained from others? Each team freely pursued their own interests and ideas. Some came up with ideas of how to use quantitative results to direct future interviews. Others constructed interactive visualizations or even wrote a blog post on the spot. There were even a few cases of digital ethnography taking off.

                  Group 3

                  The interview excerpt with the marine biologists gave enough food for thought: Was taxonomy indeed on the demise? Was mathematised science more highly valued? The bibliometric data did not provide any definitive insights, and most teams quickly learned that some of the data was heavily biased by selective data gathering. Searching further, one team found online discussion forums about scientific career prospects in marine biology, where people were worried about ending up in a job where the of fish was all there was to it. And it was acknowledged that a more scientifically rewarding career required "someone who can write code, who is great with stats, or who is handy at signal processing." Though the evidence was (naturally) inconclusive it was possible to tentatively carve out relations between quantitative and qualitative findings (see the poster to the left).

                  Poster

                  The policy-oriented economist suggested in the interview that national knowledge about the economy was floundering. The bibliometric record showed that authors seemed to discuss their own countries more frequently. At the same time, the number of different countries mentioned only increased, suggesting a broader orientation, instead of a narrower focus on for example the US economy. Zimbabwe and Venezuela were for example frequently mentioned, possibly because of their economic predicaments.

                  Did the quackathon lead to transformative new insights? Did it integrate all of our approaches and are we now on a joint path towards studying science? No. However, nor do we consider this a failure of the exercise. Bridging the quantitative-qualitative divide is not a matter of resolving all our differences and finding that one unique pathway to enlightenment. Both approaches should remain viable and valid scientific methods of inquiry in their own right. However, we can enrich our understanding and sharpen our thinking by regularly exchanging our views, contrasting our evidence and confronting our own assumptions. Our first quackathon was successful in opening this discussion. And we are confident that quackathon 2.0 will play a part in keeping it going.

                  ]]>
                  Vincent TraagGuus Dix
                  Juan reads a paper part 2: The experiencehttps://www.leidenmadtrics.nl/articles/quantitative-researcher-reads-qualitative-paper2020-01-16T15:40:00+01:002024-05-16T23:20:47+02:00Quantitative and qualitative scientists write, work and think differently. This division creates an intellectual rift between scientists, but we still need each other! I am a quantitative scientist, will I be able to read a qualitative paper?I love quantitative research, because it gives me the feeling that I understand what I am doing and I can explain it clearly to anyone. On the other hand, I like qualitative research just as much as cats like water. Just thinking about analyzing a round of interviews gives me a headache. My mind imagines a scene of researchers arguing over the meaning of the words in the interview. What a nightmare! But I believe that these fears are unjustified, and I just need to read more qualitative research to get familiar with it. An opportunity for such a reading came from my colleague Thomas Franssen, who is far more acquainted with qualitative research.

                  Thomas and I argued about whether the university rankings producers are responsible over how the public uses these rankings (he said yes and I said no). To support his point, he suggested me to read the social science paper Rankings and Reactivity: How Public Measures Recreate Social Worlds, which just happens to contain 14,000 words, no figures or tables, and results based on interviews. When I realized this, I closed my eyes, grabbed the arms of my chair tight and let go a long sigh of frustration. After silently cursing the authors, and the world in general, I recalled that I was about to read a qualitative paper. - “After all, let’s make this a learning experience!” - I thought. I will now narrate my experience of reading this paper, but if you want to know what I took away from the paper, read my other post here.

                  First of all, I refused to read all 14,000 words of the paper, so I searched on the internet for reading strategies and found a video course series on study skills from the YouTube channel Crash Course. As a footnote, I was happily surprised to see that the teacher of the course was Thomas Frank, a YouTuber that I had been following since the last year. What a small world! Anyhow, I followed the course and learned three tricks to read less and understand more:

                  • Have a purpose: The course suggested to know beforehand what you want to know from the paper, so I read the abstract of the paper and got interested in a method they mentioned. - “Maybe I could apply this method in my own data” - I wondered. I had imagined that the method would measure something, but, to my disgrace, the method analyzed the interviews with students. - “I will never understand social sciences” - I lamented, dishearten, and stand up for a glass of water.
                  • Read the subtitles: The course suggested skimming the subtitles to get an idea of the structure of the paper. To my happy surprise, the authors had taken extra care in writing good subtitles, and I understood clearly which parts of the paper I could skip.
                  • Discard paragraphs: The course suggested reading the first and last sentence of a paragraph before committing to read the full paragraph. Using this technique, I realized that about two thirds of the paragraphs that I didn’t skip yet were about context. I mean, I know that context is important, but two thirds? Later, a colleague told me that this volume of context is common in social sciences when introducing a new idea. - ”This is so different from the papers I usually read” - I grumbled, and then read the other third of the paragraphs.

                  After reading the paper I made a scheme of ideas based on the subtitles of the paragraph, and finally understood what was the paper all about. -”Hey, this wasn’t that hard!” - I thought, swell with pride, and wrote to Thomas about my impressions on the paper. I guess, the first step is always the hardest.

                  ]]>
                  Juan Pablo Bascur Cifuentes
                  Juan reads a paper part 1: The blamehttps://www.leidenmadtrics.nl/articles/university-rankings-misuse2020-01-06T15:46:00+01:002024-05-16T23:20:47+02:00University rankings are frequently misused by the public, but is it their fault or the fault of the ranking creators? Join me as I discover a paper that could answer this question.Some universities love to boast about their positions in university rankings, almost as if they were part of a football championship. However, these rankings were never intended to be used this way. This is common knowledge within the science and technology studies community, but the causes are open for debate. For example, who is to blame for the misuse? Are the producers of the rankings guilty of negligence or are the consumers of the rankings guilty of a long shot mentality? I was just debating this issue with my colleague Thomas Franssen, who argued that the producers have a responsibility in how their rankings are used while I argued that they have not. To support his argument, he suggested me to read the paper Rankings and Reactivity: How Public Measures Recreate Social Worlds. In my other blog post called Juan reads a paper part 2: The experience, I described my experience of reading this paper but now I will give a short overview of my impressions after reading it because I believe that this paper is quite relevant for anyone interested in the misuse of university rankings.

                  The paper proposes to frame the misuse of rankings through the concept of Reactivity, which, in the field of sociology, means the phenomenon that happens when the measurement of an object of study also changes that object. I believe that Reactivity is useful for thinking about the consequences of misusing a ranking. The paper identified two mechanisms for Reactivity to manifest:

                  • Selffulfilling prophecy: A false assessment about the university makes that assessment to become true. This mechanism can happen in four ways:
                    • The Effects of Rankings on External Audiences: The students think that the university is good, therefore good students go to the university, and therefore the university becomes good.
                    • The Influences of Prior Rankings on Survey Responses: The evaluators of a university know that the university was evaluated positively in the past, so in the absence of relevant knowledge they evaluate it positively again.
                    • Distributing Resources by Ranking: Positively evaluated universities receive more money, therefore they become better universities.
                    • Realizing Embedded Assumptions: The universities want to perform better in rankings, therefore they focus on improving the attributes that the ranking measures.
                  • Commensuration: An assessment about universities changes how the public assesses universities. This mechanism can happen in three ways:
                    • Simplifying Information: The ranking measures few attributes of the universities, therefore the public thinks that only these attributes matter.
                    • Commensuration Unites and Distinguishes Relations: The ranking includes different types of universities, even though the public might think that these universities are of the same type. For example, if you make a ranking of law schools, the users of the ranking would naturally think that the schools are comparable, when in reality they have totally different focuses (e.g. penal, business).
                    • Commensuration Invites Reflection on What Numbers Represent: The attributes that the ranking measures are supposed to represent something that they don't actually represent. For example, number of papers published is supposed to represent productivity, but it ignores other forms of productivity (more information on this example can be found in this other paper published by our institute).

                  With these new concepts I could think and express myself more clearly on the misuse of university rankings. Now I have a new position on my debate with Thomas: I believe that the producers of rankings are responsible of Simplifying Information, and if they make more rankings that measure different attributes of the universities then the people will make their own judgments about which university is better according to the attributes they value the most. For example, I am currently working with my colleague Rodrigo Costas on a paper about analyzing the researchers of universities (i.e. their workforce), as in how much the researchers of a university collaborate with each other or how much the university production depends on its most productive researchers. We expect that these new perspectives will provide more contextualized insights on how universities perform.

                  My take away message for you is to remember the concept of Reactivity: the next time you think about university rankings, it will give you a clearer vision and you might be more critical.

                  ]]>
                  Juan Pablo Bascur Cifuentes
                  Happy holidays!https://www.leidenmadtrics.nl/articles/happy-holidays2019-12-20T11:00:00+01:002024-05-16T23:20:47+02:00This is our last blog post of the year. 2019 has been a very fruitful year for us, and we are looking forward to what 2020 will bring. For now, we would like to wish you a Merry Christmas and a new year full of scientific discoveries. We are already busy preparing some exciting new content to share with you...

                  Stay tuned!


                  ]]>
                  Blog team
                  Local Citation Network and Citation Gecko: making literature discovery funhttps://www.leidenmadtrics.nl/articles/local-citation-network-and-citation-gecko-making-literature-discovery-fun2019-12-19T11:00:00+01:002024-05-16T23:20:47+02:00Literature review can be tedious and often involves manually checking a paper's references. Two recent web apps, Local Citation Network and Citation Gecko, aid this process by constructing and visualizing citation networks that help to identify the most influential papers in a given topic or field.I'm sure the following scenario is familiar to most of the readers: You're writing a new scientific paper and are scanning the reference lists of your most important sources to see if you've missed anything interesting, maybe even a seminal paper cited by several of your current sources.

                  Recently, a couple of web apps have come up to simplify this process by constructing and visualizing the underlying citation networks. I've personally developed Local Citation Network but have since also discovered the great Citation Gecko. In this blog post I'd like to introduce and contrast the two with a simple example.

                  (The powerful VOSviewer also supports citation networks and is available as a Java web app but deserves a separate blog post due to its complexity.)

                  Local Citation Network

                  Let's say I'm currently writing a paper on genetics and have exported my current sources (58 in total) with my reference manager of choice (Zotero) as a BibTeX file (RIS, JSON, etc. also work). Then, I've opened Local Citation Network and scanned this text file for DOIs (Digital Object Identifiers, a unique identifier for papers), instructing the web app to retrieve the reference lists of these input articles from Microsoft Academic and to construct their citation network. The papers are ordered by year from top (newer) to bottom (older) and the edges / arrows indicate citations. The locally most-cited papers have the largest node diameter.


                  The currently highlighted paper by Westra et al. from 2013 got the most citations from the remaining 57 input articles (7 in total, all of them above – this number is called “in–degree”) and cites two older input papers below. However, you'll notice it cites a third, star–shaped article by Hindorff et al. from 2009: This is a suggested article, a highly cited paper not yet among the set of input articles.

                  In the overview tables of input and suggested articles you can read the abstracts and sort or filter by title, abstract, author, year and journal. The co–authorship network (not shown) helps to identify the most influential authors among the current articles. You can also open the list of global citations in Microsoft Academic or the complete reference list of a paper in a new tab in Local Citation Network itself, creating a new citation network for them.


                  This brings us to the second mode of operation for Local Citation Network: Instead of scanning a text file for DOIs, you can supply a single DOI (which can easily be found in the small print of most scientific publications) and have the web app treat it as a “source article”, constructing the citation network based on all of its references. This way you can get a quick overview of the scientific literature used by a single paper.

                  Citation Gecko

                  The second web app I'd like to introduce is similar in spirit but different in implementation: Citation Gecko by Barney Walker. It is older than my Local Citation Network and to be honest, if I had known it, I wouldn't have seen any need to create something myself. Be that as it may, now there are two open source web apps that complement each other very well! I'll briefly walk you through Citation Gecko and then I'll highlight the differences and strengths of each of the two.

                  Citation Gecko has a more incremental approach: You start with a few “seed papers” (5 or 6 are recommended) and then the web app includes all of their references and even global citations in the citation network, obtained from Crossref and OpenCitations. Including global citations has the advantage that you can also identify papers newer than all of your seed papers, making it bidirectional in time. Next, you can add any recommended paper to your set of seed papers, incrementally increasing the size of your network.

                  To stick with my example–paper on genetics, I've imported a BibTeX file containing the 6 most important papers from my 58 input articles in Citation Gecko. These seed articles are highlighted in yellow and the node size of the grey recommended articles depends on how many seed articles they cite / are cited by. Again, the article “Systematic identification of trans eQTLs as putative drivers of known disease associations” by Westra et al. from 2013 is highlighted. It only cites one other seed article (the dark yellow node from 2010), the highlighted dark grey articles above it are all recommended because they cite it and the two highlighted dark grey articles below it are recommended because they are cited by it.


                  In fact, all articles referenced by the seed papers or referencing them are recommended and you can scroll for a long time in all directions in the timeline view. If this is too tedious, you can also switch to a pure network view (where the gecko has got its name from). Here you have to decide whether you want the edges to represent incoming or outgoing citations. Below is my genetics example and as you can see, the number of global incoming citations can be quite huge with seminal papers (as visible by the big point–clouds around the seed papers). The most interesting recommended papers are now the ones in between, citing more than one of the seed papers. These papers can potentially be added to the pool of seed papers, incrementally increasing the network size.


                  Comparison

                  Local Citation Network and Citation Gecko each have unique strengths that potentially make them interesting to researchers. Given that Citation Gecko starts with a small number of seed articles and quickly gives hundreds of recommendations, I would recommend using it at the beginning of the literature discovery process. Local Citation Network on the other hand prefers much larger input lists and only gives a few recommendations. I would thus recommend it more at the end of the literature discovery process or to gain a quick overview of the reference list of an already published paper.

                  Citation Gecko

                  • Starts with a small number of seed articles (5-6 are recommended) and incrementally increases network size.
                  • Crossref and OpenCitations are primary data sources. Global incoming citations are fetched and included in recommended articles, not just outgoing references.
                  • You can export current sessions and recommended papers as BibTeX files.
                  • Zotero and Mendeley reference libraries are integrated and can be interacted with.

                  Local Citation Network

                  • Easily handles dozens of input articles (10-200 are recommended), either defined by importing a text file containing DOIs or by obtaining the reference list of a single article.
                  • Microsoft Academic is the primary data source, which in many disciplines is more comprehensive than Crossref (also supported). Abstracts are available for most articles.
                  • Co-authorship network allows you to identify influential authors and filter by them in the current set of articles.
                  • Estimated data completeness is calculated.
                  ]]>
                  Tim Wölfle
                  The challenge of categorizing researchhttps://www.leidenmadtrics.nl/articles/the-challenge-of-categorizing-research2019-12-03T18:00:00+01:002024-05-16T23:20:47+02:00Assigning publications to research fields can be a challenge. While the demarcation of fields can be supported by algorithms, labeling fields properly requires to know what holds them together. I investigated this problem and discovered interesting reasons for publications to form a research field.I recently visited CWTS to discuss and present my PhD project, which is about the algorithmic classification of research publications. My previous experiences when working with this topic and the discussions during my week at CWTS led me to further consider the question about what holds a research field together.

                  In my work as a bibliometric analyst researchers frequently ask our bibliometric group for analyses within some particular field of research. The complexity of identifying the publications that belong to a research field is a problem rarely considered by the user. Sometimes the publications are relatively easy to identify, for example when corresponding well to a Medical subject heading. But even in those cases, the user may perceive the field differently than what is expressed by the retrieved set of publications.

                  If we look into the fantastic tree of terms provided by the Medical subject headings (MeSH), we find terms expressing different properties of a publication. Some branches contain terms that correspond to what we would perceive as research disciplines, e.g. Philosophy or Psycholinguistics while other branches include physical objects, such as chemicals or medication. There is also a branch for geographic locations, one for Diseases and another for Phenomena and processes. MeSH terms are manually assigned to publications and are mainly created to improve search systems, rather than categorizing research publications. Publications can be categorized by combining MeSH terms, however, this requires preconception of the research category since not all combinations are meaningful.

                  Map of science peter
                  The image shows a map of science based on 28 million publications and their citation relations. 234 disciplines are shown. The image is for illustrative purposes only. Certain data included herein are derived from the Web of Science ® prepared by Clarivate Analytics ®, Inc. (Clarivate®), Philadelphia, Pennsylvania, USA: © Copyright Clarivate Analytics Group ® 2019. All rights reserved.

                  When creating classifications based on citation networks, classes are obtained based on the formal communication taking place in the form of citations. Thereby, such classifications reflect the formal communication practices of the research society, rather than the organizational division of research into disciplines. In this case, no preconceptions of research categories are needed. It is not an easy task to understand what holds together the different classes created by such classification, not the least since the publication set can be very large (currently we cluster about 28 million publications at Karolinska Institutet where I work).

                  To this point I can at least conclude two things from my experiences: First, the kind of properties that hold together a research field differ from field to field, and second, research fields are formed by a combination of properties. I will give three examples:

                  1. Some years ago we studied the research field of nanocellulose materials at my former workplace at KTH Royal Institute of Technology. Nanocellulose can be used to create strong, thin materials from natural fibers or bacteria. We could identify three sub-fields within the field, all of which focused on different methods to obtain nanocellulose. In this case, the research field is defined by different methodologies.
                  2. In a study of mine and minerals research, also at KTH Royal Institute of Technology, we noticed that fields were centered around the combination of geographic locations and topical properties. This is not very surprising since the geography is of importance for mineral extraction. Also within the medical field, I have found research fields that focus on particular geographic areas, for example, the primary care in Mexico.
                  3. Third, a research field may also reflect the combination of diseases and treatments. A single treatment may be applied to several diseases. For example, hydroxyurea is a medication that is used to treat several different conditions, among others, sickle cell disease and cervical cancer. Both cases of application can be identified as distinct research fields. Interestingly, even a different kind of combination is possible: another field identified focuses on the causal relation between hydroxyurea and leg ulcers.

                  In my current work, I improve methods for labelling algorithmically obtained publication classes. This work actualizes what defines a research field, and how a field can be described. The examples above show that a combination of several terms is sometimes necessary to describe a research field accurately. Further, different kinds of properties may hold a field together and this must also be expressed by class labels.

                  Of course, a perfect classification will never be obtained. On the contrary, I believe that the availability of different classifications and different methods to delineate research is useful when answering different questions about research activities. Algorithmic classification gives some information about what kind of properties form a research field, at least if we have proper labels that make it possible to interpret the contents of classes. I hope to further contribute to this problem of labelling classes with my ongoing PhD research.

                  ]]>
                  Peter Sjögårde
                  Recommendations to Crossref from a Science Studies Perspectivehttps://www.leidenmadtrics.nl/articles/recommendations-to-crossref-from-a-science-studies-perspective2019-11-21T11:30:00+01:002024-05-16T23:20:47+02:00In a recent talk at a Crossref meeting, Ludo Waltman spoke about open citations and made three recommendations to Crossref.Last week I had the pleasure of participating in Crossref LIVE19 and of giving a short flash talk on ‘the value of Crossref’. Crossref LIVE19 took place in Amsterdam and was attended by over 100 participants, many of them representing scholarly publishers and other Crossref member organizations. I was invited to give my perspective as a science studies researcher making use of the metadata that Crossref collects for research articles and other scholarly outputs.

                  Open citations

                  As I emphasized in my talk, the scholarly community should be extremely grateful to Crossref and many publishers for the efforts they have made over the past years to increase the open availability of metadata of scholarly publications, especially data on the references included in publications. Thanks to all publishers that have joined the Initiative for Open Citations (I4OC), about 60% of all citations in Crossref have become openly available. This can be increased in the direction of 100% if Elsevier, ACS, and IEEE, the only large publishers that do not yet support I4OC, decide to join as well. The photo below shows how I4OC has enabled me to carry a network of hundreds of millions of open citations inside my gown. Thanks a lot to Crossref and all publishers participating in I4OC for making this possible!


                  Although this was not part of the formal program, various Crossref LIVE participants informally asked me about the ongoing negotiations between the Dutch universities and Elsevier. According to a recent news article, a combined deal is being discussed in the Netherlands for open access publishing in Elsevier journals and for pilot projects with Elsevier software tools for managing scholarly metadata. Crossref LIVE participants told me, rightfully I believe, that it would be ironic if Elsevier’s reluctance to join I4OC is ‘rewarded’ with such a deal. A serious commitment by Elsevier to open science would require not only support for open access publishing but also support for open citations.

                  After celebrating the impressive steps that have been taken in increasing the open availability of scholarly metadata, I used the rest of my talk to make the following three recommendations to Crossref:

                  Recommendation 1: Make sure your basic infrastructure works well

                  Crossref’s basic infrastructure sometimes suffers from significant technical problems. Earlier this year, it was discovered that millions of references had not been properly linked to cited publications. (In the meantime, this problem has been fixed.) More recently, Crossref’s metadata API faced technical challenges causing the title search feature to be disabled. This for instance affects users of the VOSviewer software, who are no longer able to search for publications in Crossref based on their title. Given the severity of these technical problems, my first recommendation to Crossref is to put additional effort into improving the stability and reliability of its basic infrastructure.

                  Recommendation 2: Work together with publishers to increase completeness of metadata

                  My second recommendation to Crossref is to actively engage with publishers to increase the completeness of scholarly metadata. To illustrate why this is important, I focused on abstracts of publications. Statistics kindly provided to me by Bianca Kramer reveal that of all journal articles in Crossref in the period 2016–2018, just 15% has an abstract (see the figure below). Many publishers do not yet deposit abstracts in Crossref. Interestingly, for the same set of journal articles, it turns out that 61% has an abstract in the Lens (which relies strongly on data from Microsoft Academic). This suggests that, if publishers do not deposit metadata in Crossref, the data will become available anyway, but without publishers being able to guarantee the quality of the data.

                  Recommendation 3: Participate in initiatives for improving and enriching metadata, and develop fair models for funding and sustaining such initiatives

                  In my third recommendation, I encourage Crossref to participate in collaborative projects and initiatives focused on improving and enriching scholarly metadata, such as ORCID, FREYA, and ROR. In my talk, I discussed ROR (Research Organization Registry) in more detail. The aim of ROR is to create identifiers for research organizations, similar to the way ORCID offers identifiers for researchers. ROR is a challenging but extremely important project. It may for instance help to increase the transparency of university rankings and to spur innovation in the design of these rankings. CWTS is committed to actively contribute to ROR, and hopefully other organizations will offer support as well, for instance by contributing to ROR’s fundraising campaign. At the end of Crossref LIVE19, it was great to see that there is a lot of interest in ROR. In fact, when the Crossref LIVE participants were asked to vote for different priorities for Crossref, ROR ended up as the single most important priority.


                  While ROR and other similar infrastructure projects are of clear importance, they also raise complex questions about the best way of organizing governance, funding, and sustainability of such projects. Crossref is largely funded by publishers that pay membership and content registration fees. However, publishers are not necessarily the main beneficiaries of projects such as ROR. It seems fair to expect the main beneficiaries (e.g., research analytics providers, research funders, and research institutions) to contribute more to the funding and sustainability of these projects. In return, they should then also be involved in the governance of these projects. Organizing funding for infrastructure projects such as ROR represents a collective action problem in which a large number of stakeholders need to jointly take their responsibility to contribute.

                  Science studies research

                  This was the first time I attended Crossref LIVE. For me this provided a great opportunity to meet the Crossref community. I am thankful to Crossref for the invitation to give a talk and to share my perspective as a science studies researcher. Crossref has a lot to offer to science studies research. Hopefully the science studies field will increasingly engage with Crossref and its members and benefit from their important work.

                  ]]>
                  Ludo Waltman
                  New interactive website to visualize Big Pharma’s publication landscapehttps://www.leidenmadtrics.nl/articles/new-interactive-website-to-visualize-big-pharmas-publication-landscape2019-11-19T13:00:00+01:002024-05-16T23:20:47+02:00This blog post presents and describes a newly created interactive website on the publication activity of some of the most important pharmaceutical companies worldwide.How does the research profile of pharma companies look like? What diseases are these companies investigating? What are their main research partners? Where are their laboratories and collaborators located? These are relevant questions for those interested on R&D dynamics in the pharmaceutical sector. However, this type of information is often not publicly available and, when it is available, it is often fragmented. We have developed an interactive website, which aims to provide information around these issues, as reflected in scientific publications produced by pharmaceutical companies.

                  Interactive visualisations: publication trends and beyond

                  This Big pharma website offers various visual analyses to browse different aspects of Big pharma’s R&D activity.

                  Scientific publication trends can be explored for Big pharma, considering the 23 companies at the same time, or for specific pharma companies individually.

                  The overall trends for Big pharma are provided together with two relevant benchmarks: Baseline 1 includes all publications worldwide, and Baseline 2 includes the publications produced by key developed countries (United States, United Kingdom, France and Germany).

                  Img 1
                  Figure 1: Number of publications per year of Big Pharma.

                  When analyzing publication trends for specific companies, the website allows for the visualization of up to ten different companies. By selecting a specific company in a combo box, the corresponding series will appear in the chart, representing the number of publications of that particular company over time. By clicking in a specific line, the clicked series will disappear, so that the chart will only show the companies of interest.

                  Img 2
                  Figure 2: Number of publications per year of specific Big Pharma companies.

                  The website also provides a breakdown of scientific publications by disease, allowing the visualization of the therapeutic areas in which companies are focused. The figure below shows the main diseases in the portfolio of two companies, Novo Nordisk and Gilead Sciences. While Novo Nordisk focuses primarily on diabetes, the portfolio of Gilead Sciences appears to be slightly more balanced, with a marked emphasis on HIV/AIDS, but also covering other diseases, such as Ischaemic heart diseases and Hepatitis C.

                  Img 3
                  Figure 3: Number of publications on specific diseases by Big Pharma companies.

                  In this blog post we have highlighted some features of the new tool. Additional analyses, including the evolution of Big pharma’s clinical versus non-clinical research, the country of location of both Big pharma companies as well as their research partners, or the list of companies with the highest number of publications devoted to specific selected diseases can be found in the CWTS’ Big Pharma website.

                  Pharma companies included in the website

                  The interactive website includes 23 of the largest pharmaceutical companies worldwide, which are among the main private investors in R&D. In 2017/18, this small group of companies invested almost €100bn in R&D. This amount represents roughly 70% of the total R&D investment by the almost 400 companies in the 2018 EU Industrial R&D Investment Scoreboard integrating the pharma/biotech sector.

                  Underlying data and sources

                  Publications were obtained from the CWTS in-house version of the Web of Science (WoS) for the period 1995-2016. The assignment of publications to companies was done considering its complete corporate structure (structure as of 2017, recent mergers are not yet incorporated). By doing so, we considered not only those publications produced by the parent companies, but also those produced by any of their subsidiaries. The corporate structures were identified combining information of merger and acquisitions from various sources, including Bureau van Dijk’s Orbis and several websites.

                  We have considered a number of disease groups and specific diseases within these groups, in order to get some insights on the therapeutic areas of activity for these companies. We selected diseases and disease groups considered by the World Health Organisation (WHO) in the global burden of disease estimates 2000-2015 (WHO, 2017). The WHO lists diseases accompanied by the corresponding codes of the International Classification of Diseases (ICD-10). We then identified the MeSH terms that best correspond to each of these ICD-10 codes, so that for each specific disease we were able to find the relevant scientific publications through MEDLINE.

                  Limitations and next steps

                  While acknowledging that many R&D developments in the private sector cannot be captured through scientific publications, we believe the analysis of this type of information provides some relevant insights on the research undertaken by Big pharma, on their research focus and on their research partners. For a more extensive description of the limitations associated to the use of scientific publications as a proxy of R&D developments in the pharmaceutical industry, see Section 2 in Ràfols et al. (2014).

                  This sector-specific website is a first step for CWTS in offering information on private R&D developments. In the coming months we will offer new insights on private R&D, by covering companies from different sectors.

                  cwts.nl/bigpharma

                  ]]>
                  Alfredo YegrosIsmael Rafolshttps://orcid.org/0000-0002-6527-7778
                  Welcome to Leiden Madtrics!https://www.leidenmadtrics.nl/articles/welcome-to-leiden-madtrics2019-10-31T13:00:00+01:002024-05-16T23:20:47+02:00Madtrics is a portmanteau, a blend of words between mad and metrics. We hope that Leiden Madtrics serves as a way to inspire and educate about topics such as the (mis)use of research metrics, indicators, and rankings in academia. Here are 5 reasons why you should frequent our blog!1. Find out about meta-science

                  Have you ever wondered how science is organized and measured? If scientists are studying their own topics, then who are studying the scientists and the knowledge that they produced? We at the Centre for Science and Technology Studies (CWTS) are one of the few research centers in the world who study this. We conduct research on a wide range of topics, including but not limited to scientific governance, research evaluation, research management and research careers across a diverse set of stakeholders.

                  2. Expand your knowledge on a variety of topics!

                  Leiden Madtrics not only will cover a broad range of topics, but will do so in varied and accessible ways. Feel free to dive into all of the categories below to see for yourself:

                  • Science and society: Response to a current event that affects the (scientific) world and vice versa (e.g. Burning of the Amazon forest, Brexit, misconduct)
                  • How-to: A how-to guide on doing science, tutorials on tools or services, tips and tricks (e.g. how to use VOSviewer, how to write a literature review, how to create a conference poster)
                  • CWTS development: what it’s like to work at CWTS, what do we do, why do we do it, work/research-in-progress, projects
                  • Opinion and commentary: response to…
                  • Summary and review: books, journal articles, conferences, seminars, retreats, summer schools that contribute to scientific discussions
                  • For dummies: Scientometrics 101, history of scientometrics…
                  • Long read: any post above 1,000 words

                  3. Be the first to know what’s happening and have a say

                  Leiden Madtrics gives you a timely insight into our work. This blog is a space where CWTS researchers discuss ideas far before they get published. We invite you to provide your comments and criticisms on our work, so these issues and potential blind spots of our work can be brought into light. Through such interactions, we hope that it is not only you who will be inspired or impacted by our work, but we in turn, will be inspired by your views and comments as well.

                  4. Kill some time while you are working, maybe you will find your friends!

                  Intellectual companionship is essential to your wellbeing in academia. We at CWTS are committed to making user friendly and useful tools to explore, classify, and visualize the research landscape. If you ever wonder how we perform bibliometric mapping and network analyses, and how you can do it for yourself, please save our blog to your bookmarks bar now. We hope that you can discuss our work and findings with your colleagues!

                  5. Connect and network with us!

                  When you come across a blog post that intrigued you, please feel free to reach out to our authors. The editorial team provides a photo and description of our authors because we are proud of them, so you can know the face behind the post! Our bloggers attend and participate in a plethora of events, conferences, workshops and seminars. If you bump into any one of us, please feel free to strike up a conversation simply by mentioning Leiden Madtrics!

                  Don’t miss out! Subscribe now to receive email notification on every new blog post!

                  ]]>
                  Tung Tung Chan
                  Reflections on the Impact of Science Conference 2019https://www.leidenmadtrics.nl/articles/reflections-on-the-impact-of-science-conference-20192019-10-31T12:59:00+01:002024-05-16T23:20:47+02:00How is impact perceived and evaluated in national and regional science systems nowadays? Which stakeholders are involved and what examples exist on a national and international level? In this post, Grischa Fraumann reports on the Impact of Science conference from 5 until 7 June 2019 in Berlin.The conference

                  The impact of science is discussed in different formats and venues nowadays, and an example that stands out is the Impact of Science conference that was organised by the Network for Advancing and Evaluating the Societal Impact of Science (AESIS Network). The importance of impact of science becomes obvious, by taking into account, that this conference has been held six times before coming to Berlin.

                  The conference offered plenary sessions and several parallel sessions with a smaller number of participants, such as those on international collaboration (chaired by Beverley Damonse) and social media (chaired by Tamika Heiden, Knowledge Translation Australia and Ger Hanley, Write Fund, Ireland). Over two hundred fifty conference participants from more than thirty countries came from a wide range of institutions: researchers in several academic disciplines from research institutes and universities; representatives from public foundations, research funders, librarians, publishers, representatives from industry and governmental institutions.

                  What I liked about the Impact of Science conference was the fact that examples from Europe were accompanied by many non-European examples, such as initiatives in: Australia, Canada, Egypt, Japan, Kenya, South Africa, Uganda, and the US. For example, the presentations covered case studies in the South African (by Beverley Damonse, South Africa's National Research Foundation, NRF), American (by Toby Smith, Association of American Universities, AAU) and Australian (by Sarah Howard, Australian Research Council, ARC) science systems.

                  Ios panel picture
                  Chairs of the parallel sessions provide summaries to the audience at the Impact of Science conference 2019 in Berlin Photo: AESIS Network (Ana Torres Photography // CC BY-NC-ND 2.0)

                  Talking about some impactful presentations

                  Sarah Foxen (UK Parliament) discussed knowledge exchange within the Parliament, a project that brings together researchers and policy makers. A related initiative was presented by Susanne Baltes (Citizen-Centred-Government, Federal Chancellery of Germany), who leads studies on evidence-based policy making together with citizens in Germany so that policies are designed more aligned with the needs of citizens. Volker Meyer-Guckel (Stifterverband) presented an approach on Strategic Openness. Research impact tools, such as Researchfish, were discussed in several sessions. Vera Hazelwood (Researchfish) mentioned that Researchfish initially started as an initiative by the UK’s Medical Research Council, and is now used by several research funders around the world to track the impact of funded research. Ongoing projects funded by the EU Framework Programme for Research and Innovation, Horizon 2020, were also presented, such as Data4Impact by Vilius Stančiauskas (Public Policy and Management Institute, PPMI). The consortium’s members plan to use big data to assess the societal impact of EU and national research projects that relate to health, demographic change and wellbeing.

                  The conference also included the opinions of funders, such as Wolfgang Rohe (Stiftung Mercator), who looked at the impact of funded projects through case studies on successful interactions with policy makers, among others. This formed part of a broader session reflecting on Key Performance Indicators (KPIs), which was chaired by Paul Wouters (Leiden University). Research funders, such as the German Research Foundation (DFG), also took part in other sessions. Roland A. Fischer (DFG), for example, described DFG’s position on research funding as a focus on excellence without impact as an assessment criterion. Discipline-specific examples formed part of a presentation by James Wilsdon (University of Sheffield) on social sciences and humanities. In the same panel, Richard van de Sanden (Eindhoven University of Technology) presented an advisory reportby the Royal Netherlands Academy of Arts and Sciences (KNAW) on how impact is assessed within the Dutch science system.

                  Some challenging topics were also discussed, such as blockchain for science, technology and innovation funding by Luc Soete (Maastricht University). Additionally, the role of open access in generating impact was mentioned several times during the conference and was also addressed in a separate session on ‘Open Science and Governance’, which was chaired by Benedikt Fecher (Alexander von Humboldt Institute for Internet and Society, HIIG) and Hans de Jonge (Dutch Research Council, NWO). Some sessions were held in a workshop format, and recommendations were formulated for the panel at the end. The audience was asked to rank the recommendations in a wrap-up session. The best recommendation was from the ‘Understanding Impact’ session by Dietmar Harhoff (Max Planck Institute for Innovation and Competition), Wiljan van den Akker (Utrecht University), Isabel Roessler (Centre for Higher Education, CHE) and Toby Smith. The recommendation is: ‘Speak the language of the group that you want to reach’.

                  Small group
                  Group picture of the conference participants at the Impact of Science conference 2019 in Berlin Photo: AESIS Network (Ana Torres Photography // CC BY-NC-ND 2.0)

                  Reflecting on the conference

                  What can we learn from such a conference? While conducting a research internship at the Centre for Science and Technology Studies (CWTS), Leiden University, in 2015, I first heard about AESIS. It is interesting to see, how the network has developed over time. To sum up, the Impact of Science conference was an educating event where delegates could get an overview on current opinions on the concept of impact in the German science system and best practices on an international level, as well as network with peers. It remains to be seen how the impact of science in Germany and internationally is evaluated in future, but the topic is definitely on the agenda.

                  The final discussion was chaired by Luc Soete and the panellists were Matthias Graf von Kielmansegg (German Federal Ministry of Education and Research, BMBF), Dietmar Harhoff, Sarah Howard and Paul Wouters. For the German science system, it was suggested during the concluding discussion that Germany finds its own way to experiment with an approach that reflects the characteristics of the national and regional system(s) of Germany. At the same time, there are also many critical opinions on this kind of new assessment criterion, and differences between types of higher education institutions and academic disciplines need to be taken into account. How researchers engage with the wider society is an area that should be investigated; for example, in case studies on open science. This is a solution that could gain momentum.

                  During the panel discussions, questions were also raised about the limits of impact assessments; for example, by David Kaldewey (University of Bonn). In that vein, Gabi Lombardo (European Alliance for Social Sciences and Humanities, EASSH) mentioned that researchers are also impacted the other way around; for example, by policies. This might also be related to academic research that generates negative impact, a concept known as Grimpact that was introduced at the 23rd International Conference on Science and Technology Indicators (STI) 2018 in Leiden. The statement ‘science is an endless frontier’, referenced during the conference by Paul Wouters, goes back to a 1945 report by the US National Science Foundation (NSF). I believe that this principle of science is still valid today, and it will hopefully remain so in the future. Reflecting on the conference, I would recommend to everybody with an interest in the impact of science to attend next time if possible.

                  Acknowledgement: I would like to thank Humboldt-Universität zu Berlin and the VolkwagenStiftung for providing me a fellowship to attend the Impact of Science conference. For another blog article about the conference, see Ger Hanley's report as part of EARMA (European Association of Research Managers and Administrators).

                  ]]>
                  Grischa Fraumann
                  The Pain of Labeling Thingshttps://www.leidenmadtrics.nl/articles/the-pain-of-labeling-things2019-10-31T12:58:00+01:002024-05-16T23:20:47+02:00Labeling things is hard, but labeling groups of things is harder! At CWTS we automatically group publications and label them with an algorithm, but these labels can be puzzling for human minds. In this post, I find out how the same group of publications can have the labels "queer theory" and "home".This week, as I was browsing the CWTS fields of science (as used for the Leiden Ranking), just for fun, I found a field with the following labels:

                  • Feminism
                  • Politic
                  • Queer theory
                  • Space
                  • Home

                  There is something weird with these labels, I thought. Feminism,Politic and Queer theory have nothing to do with Space and Home. You see, the CWTS science fields are created by an algorithm that clusters papers that cite each other. To label the fields, the algorithm uses the most representative terms from the titles and abstracts of these papers. The details for this process are explained in Waltman & Van Eck (2012). The question is, then, why did the algorithm use these labels in particular?

                  To discover the reason, I knew I had to read the papers of this field. But the field contains 4154 papers! I didn’t feel like reading them all, so I tried other approaches.

                  My first approach was to get the most frequent journals of the papers, which were:

                  • GLQ-A Journal of lesbian and gay studies
                  • Sexualities
                  • Journal of homosexuality
                  • Gender place and culture
                  • Journal of the history of sexuality

                  Okay, I thought again: this field is about sexuality. But then why does it have the labels Space and Home?

                  My second approach was to get the titles of the most cited papers, and there I saw that the label Space actually refers to Queer space. Now the only mystery left was the word Home.

                  My third approach was to search for the titles and abstract that contained the word Home, and there I saw that many of the papers are on queer sexuality at home.

                  I did it, I solved the mystery! But still I was left with an uneasy feeling about the labels. Clearly, the topic of the field was queer sexuality, but the labels were so confusing! I dream of a day when the algorithm will be smart enough to create unambiguous labels. Until then, I will have to take every label with a grain of salt.

                  ]]>
                  Juan Pablo Bascur Cifuentes
                  Mapping science using Microsoft Academic datahttps://www.leidenmadtrics.nl/articles/mapping-science-using-microsoft-academic-data2019-10-28T11:35:00+01:002024-05-16T23:20:47+02:00This blog post discusses the emergence of new data sources in the field of bibliometrics, and how to use them to map science. One of the most exciting developments in the past few years in the field of bibliometrics is the emergence of a number of important new data sources. Dimensions, created by Digital Science and made openly available for research purposes, is a prominent example. Other examples are Crossref and OpenCitations, which provide data that is fully open. The launch of Microsoft Academic in 2016 also represents a significant development. In this blog post, we discuss the data made available by Microsoft Academic and we show how the most recent version of our VOSviewer software can be used to create science maps based on this data.

                  Microsoft Academic

                  Like Google Scholar, Microsoft Academic combines data obtained from scholarly publishers with data retrieved by indexing web pages. However, unlike Google Scholar, Microsoft Academic makes its data available at a large scale, both through an API and through the Microsoft Azure platform. Moreover, the data is released under an ODC-BY open data license, which allows the data to be used under minimal restrictions. Microsoft Academic data is for instance used by the Lens, an increasingly popular website for searching and analyzing scholarly literature and patents.

                  At the moment, the bibliometric community has only a limited knowledge of the coverage of Microsoft Academic and of the completeness and accuracy of its data. A study by Anne-Wil Harzing published earlier this year reports that in the field of business and economics Microsoft Academic has a larger coverage than Web of Science, Scopus, and Dimensions. Likewise, a recent study by a research team at Curtin University finds that Microsoft Academic outperforms Web of Science and Scopus in terms of coverage. However, this study also reports that Microsoft Academic has less complete affiliation data. Other issues with the quality of Microsoft Academic data have also been reported, for instance related to incorrect publication years or incorrect journal names (e.g., see this recent presentation by one of us).

                  At CWTS, we are currently working on a large-scale comparison of the coverage of bibliometric data sources, including also Microsoft Academic. Our colleague Martijn Visser has developed an algorithm for matching publications in Microsoft Academic with the corresponding publications in Scopus. Provisional results for the period 2014–2017 show that Microsoft Academic covers a much larger number of publications than Scopus (see the figure below). However, Scopus also covers a substantial number of publications that seem to be missing in Microsoft Academic. We also found that for some content covered by Microsoft Academic and not by Scopus the scholarly nature can be questioned. Microsoft Academic for instance covers wedding reports like this one.

                  Mapping science

                  Because we see Microsoft Academic as a promising data source for bibliometric analysis, we now offer support for Microsoft Academic data in our VOSviewer software for creating and visualizing bibliometric maps of science. In the most recent version of the software, maps of science can be created based on data from Microsoft Academic. After obtaining an API key, users of VOSviewer are able to query Microsoft Academic. Data is retrieved through the Microsoft Academic API. An important feature of this API is its speed. The API of Microsoft Academic is much faster than the APIs of many other data sources.

                  VOSviewer’s support for Microsoft Academic data was used in a recent VOSviewer tutorial organized as part of the workshop Open Citations: Opportunities and Ongoing Developments at the ISSI2019 conference in Rome. In this tutorial, participants for instance used Microsoft Academic data to create the following term co-occurrence map based on titles and abstracts of publications in Journal of Informetrics.

                  6bf55519d2a27f7fe1b15f5b2b3e360c large

                  Participants also created a map of the citation network of publications in Journal of Informetrics.

                  9ead031e5874028f09c7f4b6335999f5 large

                  Interestingly, the above two maps cannot be created based on data from Crossref, another open data source supported by VOSviewer. Elsevier, the publisher of Journal of Informetrics, does not make abstracts available in Crossref, while abstracts of publications in Elsevier journals are made available in Microsoft Academic. Likewise, Elsevier is unwilling to support the Initiative for Open Citations, and reference lists of publications in Elsevier journals are therefore not made openly available in Crossref. Microsoft Academic does make these reference lists available. This illustrates some of the advantages of Microsoft Academic over other open data sources.

                  For further illustrations of science maps created using VOSviewer based on data from Microsoft Academic, we refer to a recent blog post by Aaron Tay.

                  Next steps

                  Over the past few years, we have invested considerable effort in extending the range of bibliometric data sources supported by VOSviewer. The software now offers support for all major data sources. Next steps in the development of VOSviewer include opening the source code of the software and releasing a web-based edition of the software.

                  ]]>
                  Nees Jan van Eckhttps://orcid.org/0000-0001-8448-4521Ludo Waltman
                  Why are global health needs unmet by research efforts?https://www.leidenmadtrics.nl/articles/why-are-global-health-needs-unmet-by-research-efforts2019-10-24T15:50:00+02:002024-05-16T23:20:47+02:00Not all diseases receive equal research attention across the globe. This phenomenon, often referred to as the 10/90 gap in health research, has a long history, rife with contention and debate on its accuracy. New research seeks to uncover various factors perpetuating these inequalities.Research efforts in health are well known to have unequal distributions: there is much more research on diseases more prevalent in rich countries than in diseases more prevalent in poorer countries. Why is this imbalance so persistent in spite of initiatives to support health research in the global south? In a new working paper, we provide evidence of three drivers of this inequality: the high concentration of research in the global north, the similarity of disease focus between public research and big pharma, and the higher visibility (in terms of citations) of diseases more prevalent in rich countries. Our analysis shows that a systematic underinvestment in research concerns not only diseases such as malaria, mainly affecting developing countries, but also diseases with a major burden in high and upper middle income countries such as depression or stroke.

                  Comparing disease burden with research efforts

                  How is science responding to pressing and diverse health needs at the global level? One way to think about this response is to compare the burden caused by a disease with the amount of research conducted on that disease. First, we estimate the burden of a disease in a given country using so-called DALYs (Disability Adjusted Life Years) for 2010. DALYs account for the years of life that a person loses due to death or disability. Second, the amount of research on a given topic can be proxied using publication data (2010-14), as illustrated for instance by the web-based tool for the visualisation of research funding landscapes made available by the newly established Research on Research Institute (RoRI).

                  Combining these sources, one can contrast the amount of research with the disease burden. To make this comparison, we classified diseases into five categories depending on whether their burden is smaller or larger in High Income Countries (HICs) or in Lower and Middle Income Countries (LMICs). As shown in Table 1, these categories go from Type 1a (diseases more prevalent in HICs, such as pancreas cancer or multiple sclerosis) to Type 1b (equally prevalent), to Type 1c (a bit more prevalent in LMICs) to Type 2 and 3 (much more burden in LMICs, such as malaria or tuberculosis).


                  Type

                  Relative disease burden per capita1

                  Description

                  # Diseases

                  Exemplary cases

                  1a

                  < 0.75

                  More burden in HICs

                  34

                  Colon cancer, breast cancer, Alzheimer’s disease

                  1b

                  0.75 ≤ x < 1.25

                  Equal burden

                  28

                  Depression, schizophrenia, ischemic heart disease

                  1c

                  1.25 ≤ x < 3.00

                  A bit more burden in LMICs

                  26

                  Cirrhosis, stroke

                  2

                  3.00 ≤ x < 35.0

                  More burden in LMICs

                  22

                  Maternal conditions, HIV

                  3

                  x ≥ 35.0

                  Quasi exclusive of LMICs

                  24

                  Malaria, diarrhoeal diseases

                  Table 1. Classification of diseases according to the relative of burden per capita in High Income Countries (HICs) compared to Low and Middle Income Countries (LMICs)

                  1 Note: Relative disease burden per capita is calculated as the ratio of disease burden per capita in Low and Middle Income Countries (LMICs) over disease burden per capita in High Income Countries (HICs).


                  Research efforts systematically increase for diseases with higher burden in the global north

                  In analysing the proportion of publications in relation to the disease burden in global terms, we find that, in relative terms, there is ten times more research on Type 1a diseases than on Type 3 diseases. In fact, relative research efforts decrease steadily for diseases with less burden in the global north (see Figure 1). Even the diseases with highest burden in middle income countries (Types 1b and 1c) receive two to three-fold less attention than Type 1a diseases.

                  Surprisingly, the relative efforts for different types of diseases follow the same pattern for public research as for research published and financed by big pharmaceutical companies (orange and brown bars in Figure 1). Pharma R&D is assumed to respond to market demands, which are generally much higher for diseases affecting people in the global north. Since public research is expected to respond to health needs rather than market demands, one could not anticipate a priori this high degree of concordance. This finding supports the view that public and big pharma research are strongly coupled.

                  Figure 1: Research effort relative to disease burden (% Publications / % DALYs) per disease type, for all research compared to research published or funded by big pharma


                  The geographic distribution of research efforts is highly uneven

                  Imbalances in research attention to global health needs can also be partly explained by the high concentration of research in high income countries (79%, see Figure 2) and the fact that research tends to follow national priorities. When we compare research efforts by countries to their own disease burden (see Figure 3), we see that high and upper middle income countries are carrying out more research on diseases prevalent in lower income countries (Type 3) than would be expected according to their own current needs (in Types 1a, 1b and 1c). Nevertheless, this bit of ‘solidarity’ is not enough to compensate for the tiny amount of health research (4%) carried out in lower and lower middle countries in comparison to their disease burden (64%).

                  Figure 2: Distribution of population (2010), disease burden (proxied in 2010 DALYs), and research efforts (as 2010-2014 publications) across country income levels


                  Figure 3: Research effort relative to disease burden (% Publications / % DALYs) per disease type and country income level

                  The influence of system’s incentives

                  It also worth noticing that in upper middle countries there is a relative 50% over-investment in Type 1a diseases as well as a relative under-investment in research for the diseases that affect them the most, i.e. Type 1b and Type 1c diseases, including for example depression and stroke (see Figure 3). This observation suggests that in upper middle income countries there might exist incentives, in terms of funding or academic rewards, for researchers to publish on Type 1a diseases.

                  We checked incentives, first, in terms of publication in prestigious journals (in top quartile impact), but did not find a bias. However, as shown in Figure 4, we observed that in upper and lower middle income countries publications have a decreasing citation impact as they move from Type 1a to Type 1c to Type 3. This pattern deserves further analysis, as it may relate to publication incentives: it might be related to the influence on agenda setting of scientific communities based in the global north, or to national evaluation systems reliant on international bibliometric criteria.

                  Figure 4: Citation impact by disease type by country income level (without international collaboration)

                  Rethinking priority setting in health research

                  In summary, the findings of this analysis show that there is relative underinvestment not only for disease most prevalent in lower income countries (that is for ‘neglected’ diseases) but also in high and upper middle countries for diseases such as stroke and depression, which have a similar burden across country income levels.

                  To correct these pervasive imbalances observed, it is necessary to make investments (or lack thereof) in health R&D more visible, as done for example by the Observatory of Global Health R&D. Yet it is also necessary to more resolutely and strategically re-orient research towards public health outcomes.

                  ]]>
                  Ismael Rafolshttps://orcid.org/0000-0002-6527-7778Alfredo YegrosMaría Francisca Abad-GarcíaWouter van de Klippe