


The CWTS Leiden Ranking 2020
At CWTS, we have just released a new edition of our Leiden Ranking. In this post, the core members of the Leiden Ranking team provide a quick update and illustrate some of the insights provided by the ranking.
Today CWTS is releasing the 2020 edition of the CWTS Leiden Ranking. As always, the release of the ranking requires a major effort involving contributions from a large number of colleagues at our center. This year, the COVID-19 crisis, combined with a major update of the internal data infrastructure at CWTS, created additional challenges, which has unfortunately led to a delay of almost two months in the release of the ranking.
We hope, however, that it has been worth the wait. In recent years, we have made improvements to the Leiden Ranking by enhancing the online interface, by promoting the responsible use of rankings, and by adding new indicators, in particular indicators of open access publishing and gender diversity. This year, we have focused on increasing the number of universities included in the Leiden Ranking. While the 2019 edition included 963 universities from 56 different countries, we now have 1,176 universities covering 65 countries. Below we present a breakdown of the number of universities per country.

For each university included in the Leiden Ranking, we carefully collect the publications indexed in the Web of Science database that belong to the university. This is a laborious process that involves a significant amount of manual work. For this reason, we need to limit the number of universities in the Leiden Ranking, often leading to universities expressing their disappointment about not being covered by our ranking. This year, in order to increase the number of universities in the ranking, we have decided to make an additional effort. Rather than including all universities with at least 1,000 publications in the Web of Science database, we have chosen to include all universities that have at least 800 publications in the database (time period 2015-2018; fractional counting). This is the main explanation for the large increase in the number of universities covered by the ranking.
The Leiden Ranking 2020 provides a huge amount of statistics. The ranking covers 1,176 universities, six main fields of science, and ten time periods (2006-2009 through 2015-2018). For each combination of a university, a main field, and a time period, the ranking provides values for 50 indicators, yielding a total of 1,176 × 6 × 10 × 50 = 3.5 million indicator values. This clearly offers lots of interesting insights. To illustrate this, there is one particular insight that we would like to share.
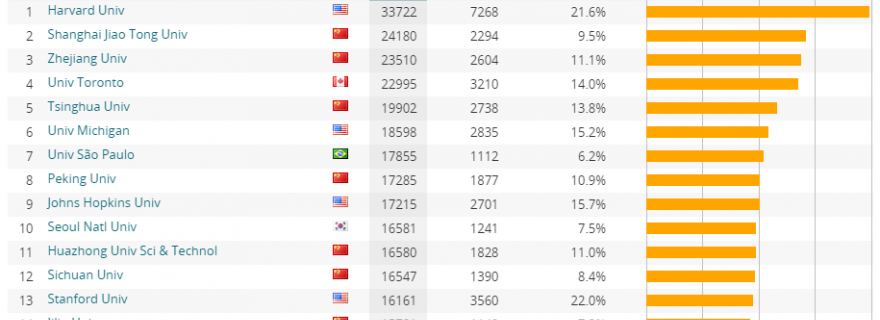
The 2020 edition of the Leiden Ranking turns out to be the first edition that includes more Chinese universities than US universities. In 2019, the Leiden Ranking included a few more universities from the US than from China (173 vs. 165). This year, the situation has reversed. The Leiden Ranking now covers 204 Chinese universities, including six from Hong Kong and one from Macau, and 198 US universities. The scatter plot below shows for each university from China (in blue) and the US (in orange) the number of publications (horizontal axis; time period 2015-2018; fractional counting) and the percentage of highly cited publications (vertical axis; publications belonging to the top 10% most highly cited of their field and publication year).

The scatter plot shows that US universities dominate among the universities with the highest percentage of highly cited publications. Rockefeller University, located in the top-left in the plot, is a clear outlier, with a small output of fewer than 1000 publications, but more than 33% highly cited publications. In terms of output, Harvard University, located in the far right in the plot, surpasses all other universities, with almost 34,000 fractionally counted publications, of which 22% are highly cited. However, among the runners-up, we find many Chinese universities, often with a fairly decent percentage of highly cited publications.
The chart below offers some insight into the growth of the publication output of Chinese universities over time. For all Chinese and US universities included in the 2020 edition of the Leiden Ranking, the chart displays the number of universities with at least 800 fractionally counted publications in each of the time periods covered by our ranking. Going from the earliest (2006-2009) to the most recent (2015-2018) time period, the number of Chinese universities with at least 800 publications shows a major increase, from 77 to 204, while the increase in the number of US universities with at least 800 publications is relatively small, from 172 to 198.

This is just one illustration of the insights that can be obtained from the Leiden Ranking. We invite you to explore the ranking in full detail at www.leidenranking.com. As always, we welcome your feedback on the Leiden Ranking. To contact us, please use this contact form.
0 Comments
Add a comment