


An open approach for classifying research publications
In this post Nees Jan van Eck and Ludo Waltman introduce an open approach for classifying research publications, contributing to a broader development toward open approaches to bibliometrics.
Classifying research publications into research topics or research areas is crucial for many bibliometric analyses. While there are lots of approaches for classifying publications, most of these approaches lack transparency. Although there are exceptions (see here and here), these approaches are typically based on data from proprietary sources or they rely on non-transparent algorithms.
We introduce an open approach to the algorithmic classification of research publications. This approach builds on a methodology we developed more than a decade ago. While this methodology was originally applied to closed data from proprietary sources, we now apply it to open data from OpenAlex. We make available a fully open classification of publications. The research areas in this classification are labeled using a new labeling approach, and the classification is presented visually using the VOSviewer Online software. We also release open source software that enables anyone to reproduce and extend our work.
Building the classification
We built our classification based on OpenAlex data, using the snapshot released on November 21, 2023. Over the past years, our methodology has been used to create classifications based on Web of Science and Scopus data. These classifications are available in InCites and SciVal, respectively. Compared to Web of Science and Scopus, OpenAlex has the benefit that its data is fully open and that it offers a broader coverage of the scholarly literature.
To build our classification, we used the so-called extended direct citation approach in combination with the Leiden algorithm. The source code of the software we used is available here. Our classification covers the 71 million journal articles, proceedings papers, preprints, and book chapters in OpenAlex that were published between 2000 and 2023 and that are connected to each other by citation links. Based on 1715 million citation links, we built a three-level hierarchical classification. Each publication was assigned to a research area at each of the three levels of the classification. Research areas consist of publications that are relatively strongly connected by citation links and that can therefore be expected to be topically related. At each level of the classification, a publication was assigned to only one research area, which means research areas do not overlap.
Using the parameter values reported in Table 1, we obtained a classification that consists of 4521 research areas at the lowest (most granular) level, 917 research areas at the middle level, and 20 research areas at the highest (least granular) level. We also algorithmically linked each research area in our classification to one or more of the following five broad main fields: biomedical and health sciences, life and earth sciences, mathematics and computer science, physical sciences and engineering, and social sciences and humanities.
| Parameter | Value |
| resolution_micro_level | 2.2e-6 |
| resolution_meso_level | 4.9e-7 |
| resolution_macro_level | 2.2e-8 |
| threshold_micro_level | 1,000 |
| threshold_meso_level | 10,000 |
| threshold_macro_level | 500,000 |
| n_iterations | 100 |
Table 1. Parameter values used to build the classification.
Given the huge size of the citation network based on which we built the classification, the process of building the classification was computationally demanding. We used a computer with 200 GB internal memory. The process took about 70 hours on this computer.
Labeling the research areas in an algorithmically built publication classification is a challenging problem. The labeling approach introduced in our original methodology yields a list of five characteristic terms for each research area. While these terms usually give a reasonably good impression of the topics covered by a research area, our experience is that users often want to have a single term that summarizes what a research area is about.
Large language models (LLMs) offer important new opportunities to label research areas. We therefore used the Updated GPT 3.5 Turbo LLM, developed by OpenAI, to label the 4521 research areas at the lowest level in our classification. The source code of our software can be found here.
For each research area, we provided the LLM with the titles of the 250 most cited publications in the area, along with the prompt shown in Box 1. Using this prompt, we asked the LLM to return a label for each research area, both a short one (max. three words) and a longer one (max. eight words). We also requested the LLM to provide a few sentences that summarize what the research area is about.
You will be provided with the titles of a representative sample of papers from a larger cluster of related scientific papers.
Your task is to identify the topic of the entire cluster based on the titles of the representative papers.
Output the following items (in English) that describe the topic of the cluster: 'short label' (at most 3 words and format in Title Case), 'long label' (at most 8 words and format in Title Case), list of 10 'keywords' (ordered by relevance and format in Title Case), 'summary' (few sentences), and 'wikipedia page' (URL).
Do not start short and long labels with the word "The".
Start each summary with "This cluster of papers".
Format the output in JSON.
Box 1. Prompt provided to the LLM.
Table 2 presents the results provided by the LLM for one of the 4521 research areas. The results show that this research area is about bibliometrics. Although we did not perform a systematic evaluation of the quality of the LLM results, our impression is that the results are a substantial improvement over the results obtained using our original methodology, or variants of that methodology. We also tried to use the LLM to label the research areas at the middle level and the highest level in our classification, but this did not yield satisfactory results.
| Short label | Bibliometric Analysis |
| Long label | Bibliometric Analysis and Research Evaluation |
| Keywords | Bibliometric Analysis; Research Evaluation; Scientific Impact; Citation Networks; Collaboration Patterns; Open Access Publishing; Social Impact Assessment; Altmetrics; Co-authorship Networks; Interdisciplinary Research |
| Summary | This cluster of papers focuses on bibliometric analysis, research evaluation, and the assessment of scientific impact. It covers topics such as citation networks, collaboration patterns, open access publishing, social impact assessment, altmetrics, co-authorship networks, and interdisciplinary research |
| Wikipedia | https://en.wikipedia.org/wiki/Bibliometrics |
Table 2. Output provided by the LLM for a selected research area.
While the LLM results are promising, we stress that the use of LLMs such as GPT 3.5 raises complex legal and ethical questions that require further consideration. Also, the use of GPT 3.5 requires a payment. We paid slightly less than USD 50 to label 4521 research areas. We also considered the use of GPT 4, but this LLM is more expensive and did not seem to yield better results.
Visualizing the classification
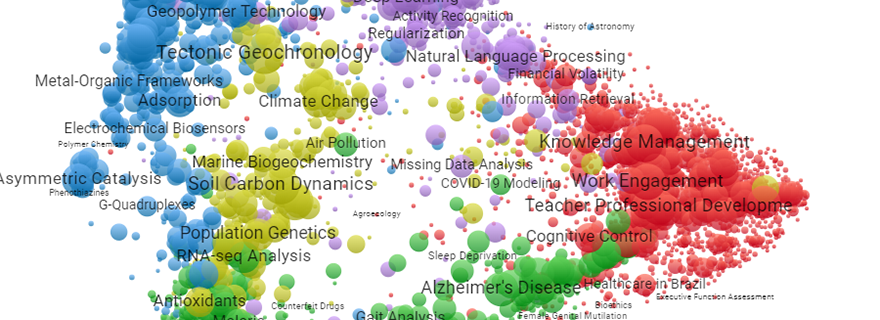
A powerful way to use our publication classification is to create interactive landscapes of science. Figure 1 presents an example of such a landscape. It was created using the VOSviewer Online software. We used the software to visualize the 4521 research areas at the lowest level in our classification. Each bubble represents a research area. The larger the bubble, the larger the number of publications in the research area. The distance between bubbles approximately indicates the relatedness of research areas in terms of citation links. In general, the smaller the distance between two bubbles, the stronger the citation links between the two research areas. The color of a bubble shows the primary main field to which a research area belongs. For instance, research areas in the physical sciences and engineering (blue) are located on the left side of the landscape, while research areas in the social sciences and humanities (red) are located on the right side. Finally, for some bubbles, the landscape also shows the label obtained using our LLM-based labeling approach.
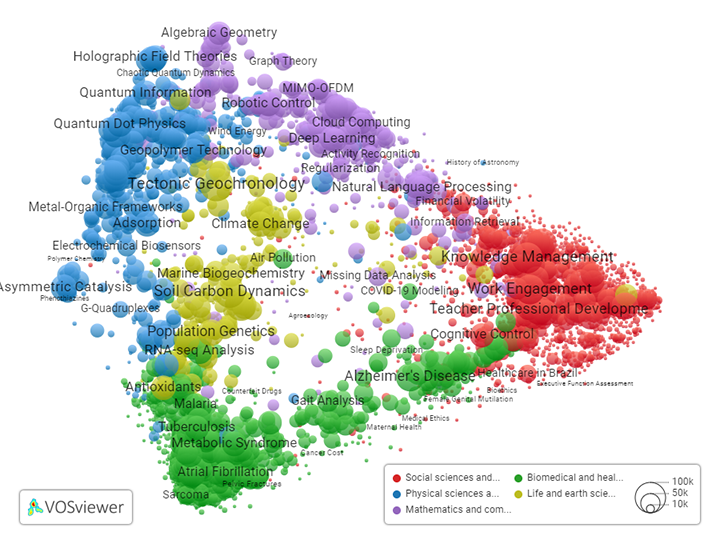
Figure 1. Landscape of science showing the 4521 research areas at the lowest level in the classification. Colors show the primary main field to which a research area belongs. (interactive version)
The landscape of science presented in Figure 1 can be explored in more detail in this interactive webtool. The webtool enables zooming in on specific parts of the landscape. It is also possible to see the list of publications included in each research area.
To illustrate the power of landscapes of science, we use our landscape to show the publication activity of our own institution, Leiden University. The landscape presented in Figure 2 is identical to the one in Figure 1, except that the color of a bubble now indicates the proportion of publications in a research area with authors affiliated with Leiden University. Purple bubbles represent research areas in which Leiden University has a strong publication activity. For each research area, the list of publications authored by Leiden University can be explored in our interactive webtool. The webtool for instance reveals that Leiden University has 570 publications in the period 2000-2023 in the research area labeled ‘Bibliometric Analysis’. This is one of the research areas in the social sciences and humanities in which Leiden University has its strongest publication activity.
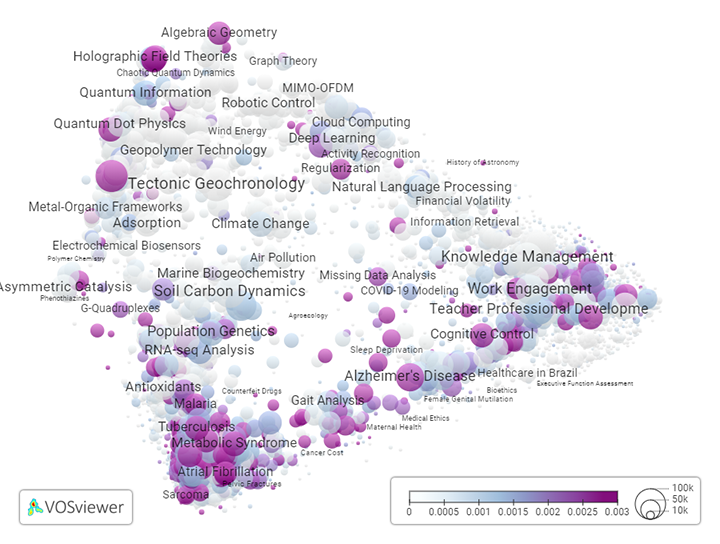
Figure 2. Landscape of science showing the 4521 research areas at the lowest level in the classification. Colors show the proportion of publications in a research area with authors from Leiden University. (interactive version)
Opening up bibliometrics
We have introduced an open approach for classifying research publications into research areas: Our approach relies on open data from OpenAlex, our software is open source, and our publication classification is openly available. The work presented in this blog post is part of an ambitious agenda we have at CWTS to move to fully open approaches to bibliometrics, and to openness of research information and research analytics more generally.
The publication classification discussed in this blog post is a crucial building block for the Open Edition of the Leiden Ranking that CWTS is going to release on January 30. The classification is also used by the OpenAlex team as a foundation for a new topic classification for OpenAlex. We hope our work will help to advance the transition to open approaches to bibliometrics!
0 Comments
Add a comment