


The global map of science according to EU funding
In this blog post, we report a global funding landscape created using semantic relations of all EU R&I Framework Programme grants that helps locate regions, organisations and funders in the disciplinary space of science without relying on citation data.
Mapping grants rather than publications
Since the 1980s, quantitative science studies have developed methods to generate large-scale maps of science using publication and citation data. Although initially contested, advances in computational techniques in the 2000s enabled the construction of maps covering all disciplines (thus ‘global’) that have proven reproducible across disparate methods, with a consensus on the main structural relationships among disciplinary fields.
These global science maps are used in science policy and management to analyse the topical distribution of research activities, investments, and performance across organisations or territories. By visualising epistemic positions and relationships, these maps can support portfolio analysis and strategic decision-making, for example, to diversify risk or orient funding towards societal challenges. However, most global maps rely on citation data from journal publications, which limits their scope and excludes funding information such as grants. Yet semantic techniques, topic modelling in particular, have opened new possibilities by enabling large-scale mapping based on natural language (e.g., titles and abstracts). These methods allow bottom-up classification systems applicable across diverse document types, including grants and policy documents.
Building on these developments, in a recently completed joint research project, we developed a global map of science based on funding schemes of the R&I Framework Programs managed by the European Commission. Specifically, we analyzed approximately 82,000 projects funded by the Framework Programmes from 2003 to 2024 (FP6, FP7, Horizon 2020, and the first part of Horizon Europe).
Rather than relying on predefined classifications or citation clustering, we generated a mapping based on the emerging topics of European projects using the semantic approach of a BERT-based topic modeling powered by Large Language Models. This method allowed us to assign, based on the project description, each of the 82,000 funded projects to a unique research topic according to its semantic similarity.
To make the resulting structure of science interpretable, we developed two complementary visualisations of the grant-based map. The first is a more detailed interactive visualisation built with Cosmograph, which displays all individual grants and the second is a topic-level map comprising 60 research areas generated with VOSviewer (shown in Figure 1 and available as interactive map). In Figure 1, we observe, in clockwise direction from the top left: physical and mathematical fields (purple), material science and chemistry-related fields (turquoise blue), health sciences (red), neurosciences and robotics (orange), biology, agricultural and environmental sciences (yellow), social sciences, research policy interventions and digital research (blue) and engineering (green). For readability, some labels are not shown.
To the best of our knowledge, this represents the first global map of grants (rather than publications) derived from the semantic content of project titles and abstracts. Our results are consistent and complementary to previous citation maps (a torus-like shape), as well as to recent global maps using semantic approaches and based on (Czech) publications. However, the grant map shows a much larger presence of applied sciences and mission-oriented research and innovation topics, notably in engineering, environmental transitions, and sustainability sciences, following the thematic orientations of the EU Framework Programmes.
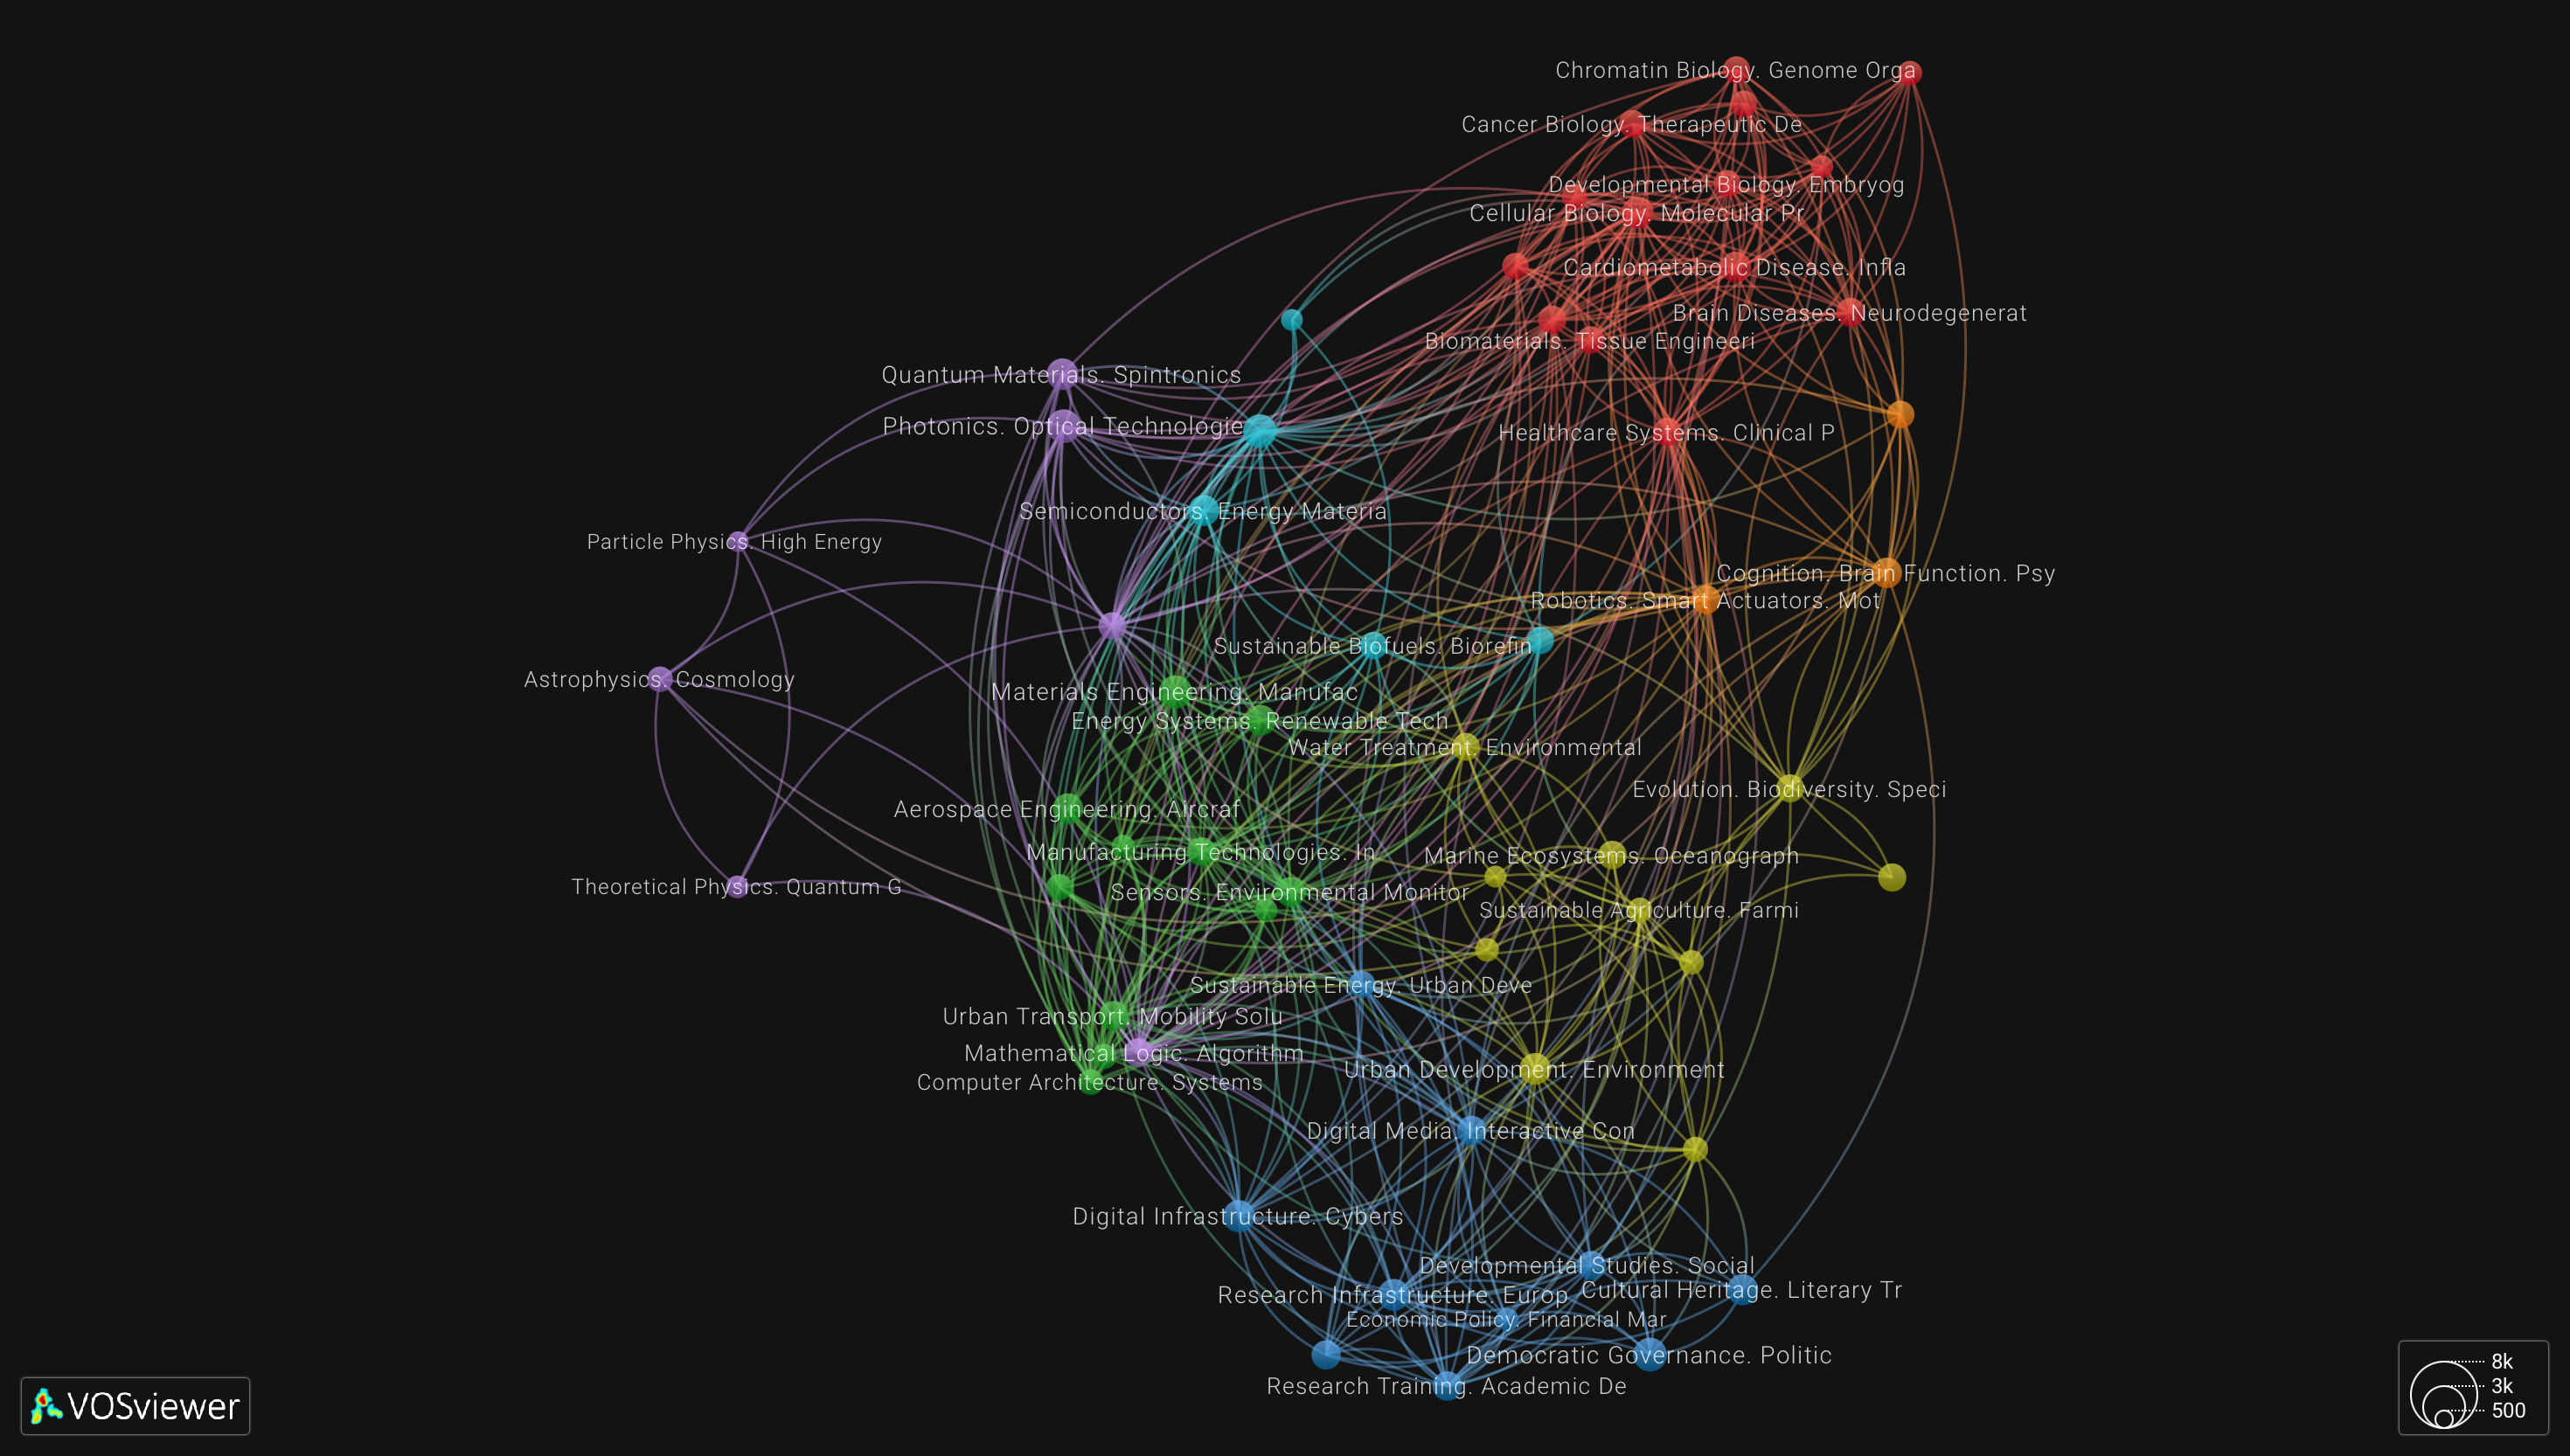
Figure 1. Global map of EU grants, with sixty topics grouped in seven disciplinary groupings.
Comparing organisations, regions, and funding programmes across the global map
We have used the VOSviewer global map to visualise the disciplinary differences in funding between organisations, regions, and funders’ programmes. This includes six universities, including cases of comprehensive universities, as well as universities with technical, social science, and medical profiles; four European regions with different knowledge and economic specialisations; and various EC funding programmes. All of these are investigated separately, as illustrated in Figure 2. The size of the nodes is proportional to the relative funding obtained from EU grants for a given territory, not to the volume of funding. The colour scale indicates relative specialisation: yellow is high specialisation, green is no specialisation, and blue is low specialisation. All details can be found in the interactive map. Different entities can be investigated separately by selecting the respective items in the menu bar on the left of the VOSviewer map.
Since the map captures the amount of research funding rather than publications, it is particularly useful to visualise research fields with less propensity to publish – as it is the case in applied science and those that collaborate with non-academic stakeholders such as industry, public administration or NGOs. These characteristics suggest that grant maps may be better suited than publication maps for studying research involving socio-technical challenges such as climate change.
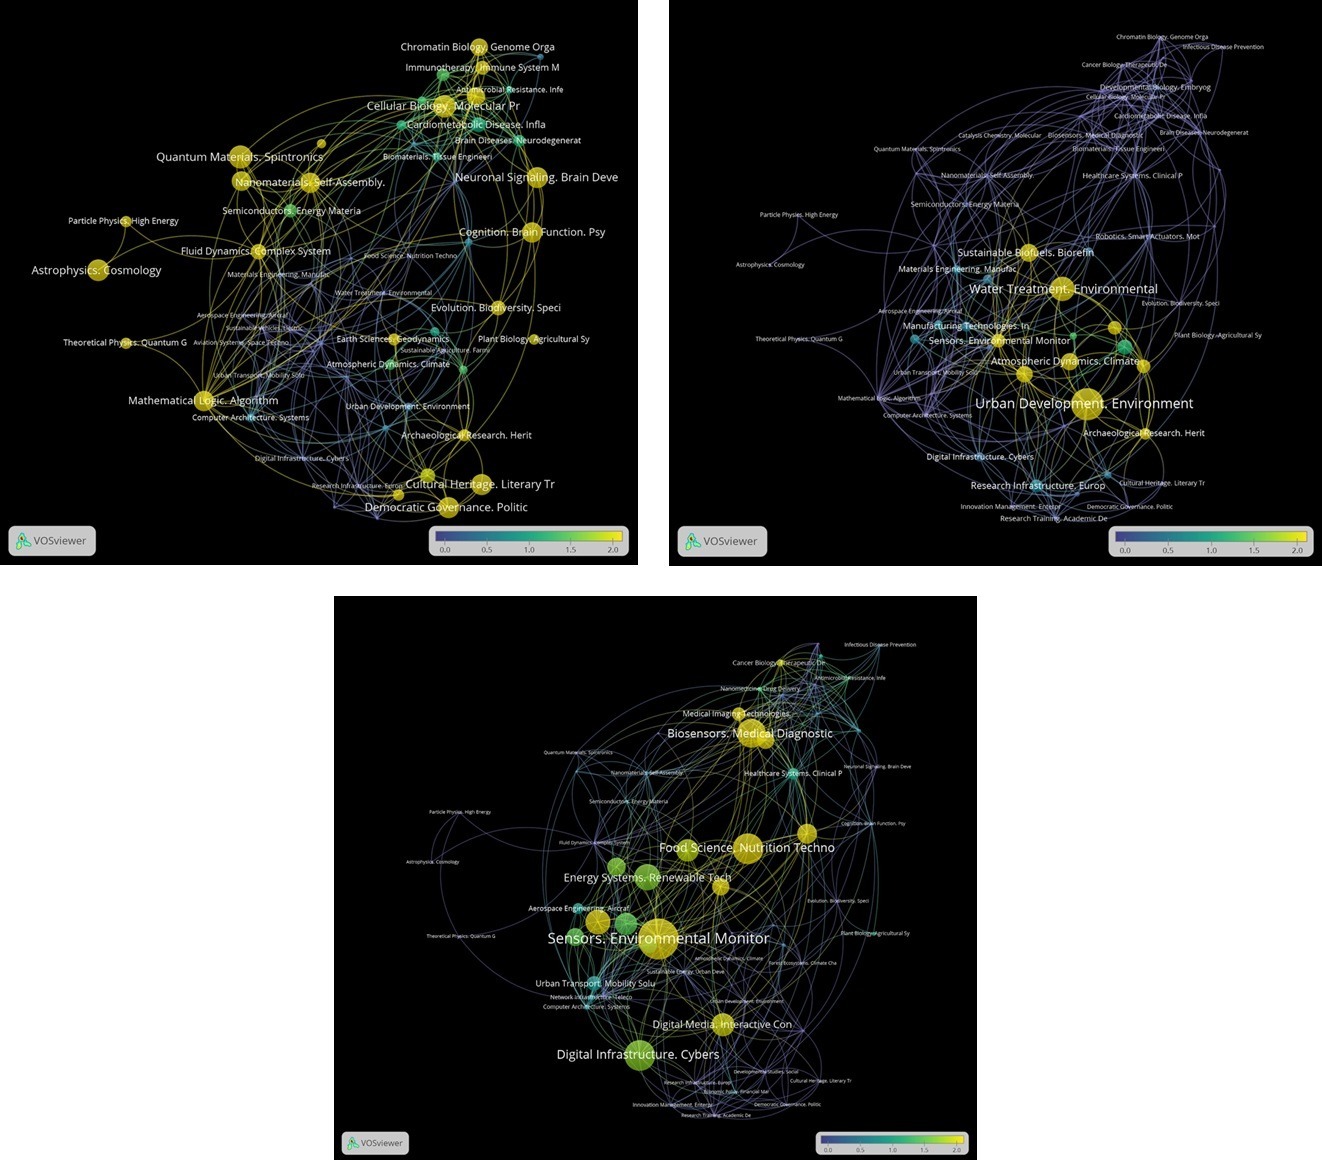
Figure 2. The relative position of two funding instruments of the European Commission on the global map: the European Research Council (ERC) (left); Societal Challenges - Climate (top right); and the SME Instrument plus the European Innovation Council (EIC) (bottom).
Missing funding data
A major hurdle for the broader application of scientific mapping is the scarcity of comprehensive grant data sources. Whereas in the case of publications, there are various databases (both open and under subscription) that aggregate information from a variety of journal publishers, when it comes to grants, the coverage of funding agencies is more patchy. Currently, there exist some resources that aim at aggregating funding information at a global scale, such as OpenAIRE and Dimensions. The latter database (under subscription) has been used, for example, in analyses of mental health and cancer funding. However, in all existing resources there are significant gaps in the data and metadata coverage that remain to be addressed. This constraint explains why the Barcelona Declaration on Open Research Information has prioritized the development and adoption of open standards for funding metadata, as well as other textual metadata such as project abstracts. To this purpose, the Wellcome Trust announced last July an award of £2.9 million to support the indexing of grants from funders across the world into the OpenAlex database.
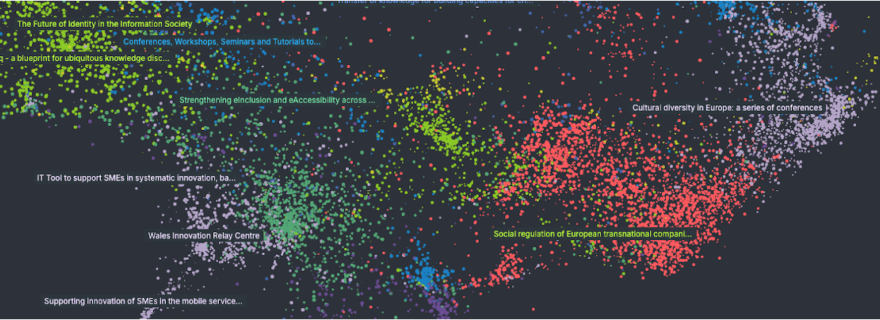
Header image: Screenshot of the Cosmograph visualization
DOI: 10.59350/8hwj6-qh279 (export/download/cite this blog post)
Note: This blog post has been updated to (1) include Hermes Carretero as a contributing author in the author list and (2) to edit a sentence in the last paragraph to mention OpenAIRE as another source for funding information.
2 Comments
We are an informal group of research managers and science communicators at the University of Coimbra, Portugal, who is beginning to explore these issues, and we found this article very insightful.
This post led us to discuss research evaluation and the importance of considering this for strategic decisions at the organisational level – the resources here presented would be of great importance.
The integration of both (publications and grants) in the same global mapping of science would enable to capture science impact and the distinct dimensions of scientific activity: from Publications – the responsibility of authors (scientific output), Citations – the responsibility of peers and the scientific community/society (scientific recognition and validation), to Funding – political and institutional responsibility (setting strategic priorities) [ability to identify areas less likely to result in publication — such as applied research or collaborative research with industry and public administration].
We are very interested in exploring with you how we could transpose this to our institution.
Thanks for your comment and sorry for not seeing it earlier! Happy to engage if you are interested to explore how this methodology may serve your institution's needs.
Add a comment