


ORION dashboard: Bringing open research data within reach
The ORION dashboard enables easy exploration of CWTS OpenAlex data on BigQuery, letting users analyse institutions, funders, and research topics via interactive visualisations and reproducible SQL queries without any coding skills required.
Open science has made enormous advances in recent years. Large-scale bibliometric databases, covering millions of publications, institutions, funders, authors, and citations, are now freely available to anyone. The ORION-DBs initiative (Open Research Information on BigQuery) goes a step further by hosting several of these datasets directly on Google BigQuery, making them queryable at scale without the need to download or manage data locally.
Yet freely available does not mean easily accessible. Running SQL queries against a multi-terabyte database requires familiarity with BigQuery, knowledge of the data model, and the patience to translate research questions into code. For most researchers, research managers, and science policy analysts, this remains a significant barrier.
The ORION dashboard is my attempt to bridge that gap. It is a web application that gives non-technical users a clean interface to explore the CWTS OpenAlex data on BigQuery without writing a single line of SQL themselves.
What the dashboard does
The current version centres on two types of entities: research institutions and funders. From a simple search interface, users can:
- Search institutions and funders by name, country, or type, and see how many works they are associated with over a chosen year range.
- Build a basket of institutions or funders of interest (think of it as a custom research portfolio) and run analyses on the papers published by that set as a whole. Baskets can be built in bulk, for example by selecting all institutions in a country at once.
- Count total works for a basket across a selected time period, with full deduplication (a paper co-authored by two basket institutions counts once, not twice). The Dashboard also provides the SQL code needed to download the paper IDs and guidance on how to join them with other tables to obtain further attributes, such as titles.
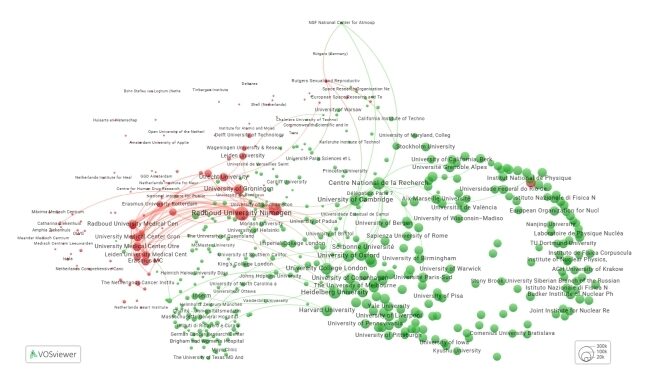
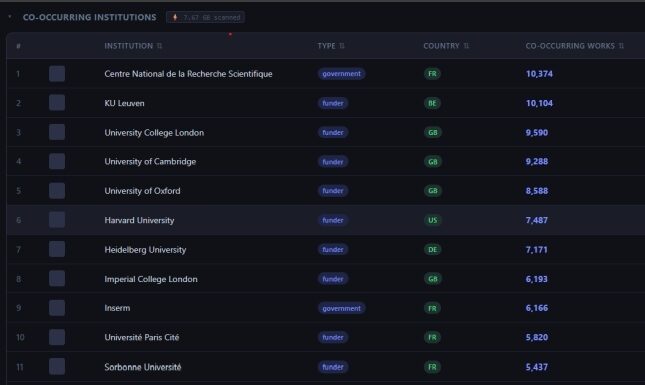
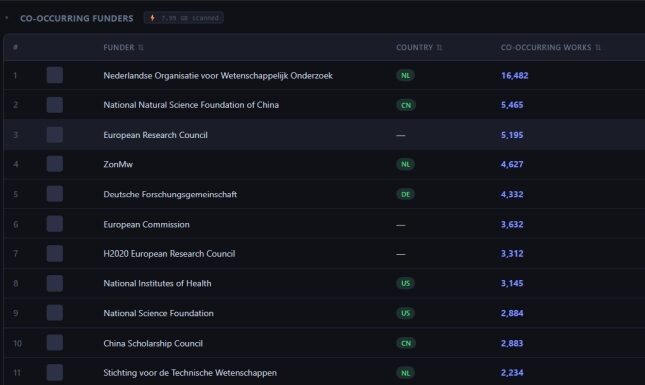
- Discover co-occurring institutions and funders, which means which other organizations appear most frequently on the same papers as your basket.
- Visualize those co-occurrences as an interactive network in VOSviewer Online with a single click, without any data export or manual setup.
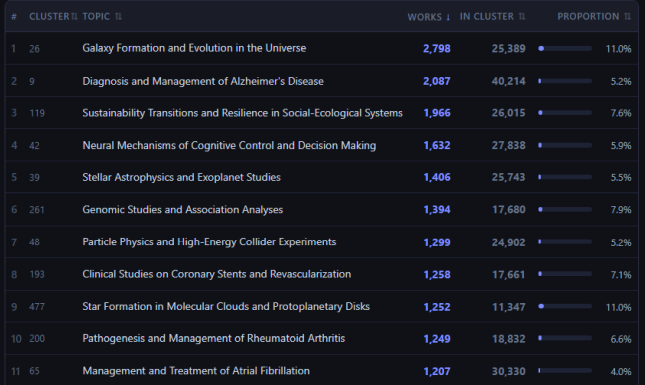
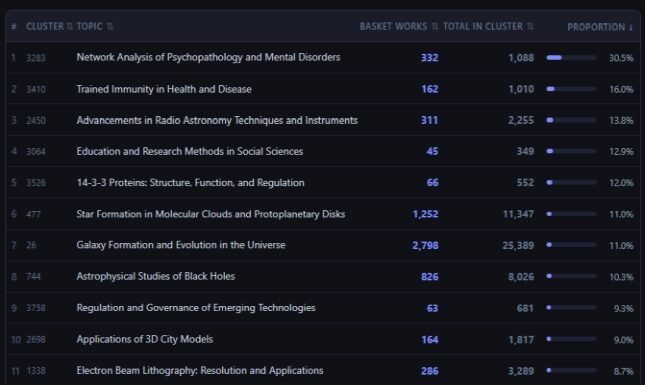
- Explore the topical profile of a basket: how its publications are distributed across 4,521 thematic clusters. All clusters are shown, including those with zero basket publications, so the full landscape of a field is visible.
All the data comes from the openalex_2025aug dataset, except from the clusters that come from openalex_2023nov_classification.
Transparency and reproducibility by design
One of the design principles I cared most about is that the ORION dashboard should never be a black box. Every result it produces can be traced back to an explicit SQL query, and that query is always one click away via the “Get export query” button.
Users can copy that query, run it themselves in the BigQuery console, and verify or extend the results independently. Results are fully reproducible: the same basket, the same year range, and the same dataset version will always produce the same output, whether run through the interface or directly in BigQuery.
This also means that the dashboard is a steppingstone, not a dependency. Users who grow more comfortable with the data can take the generated queries as a starting point and build on top of them, like joining with additional tables, adding filters, or automating analyses in their own pipelines. The tool is designed to help users move away from it when they are ready.
Example: Dutch research institutions
As an example, consider a user wanting to characterise the Dutch research system. Searching for country code “nl” in the Institutions tab returns 1,729 institutions, which can be added to the basket in bulk using the “Add all” option. Together, they account for 509,326 papers between 2015 and 2020. In the images below, you can see different analyses that were performed using the basket tab and the insights obtained from them. The online VOSviewer map can also be found here.
Cost: the free tier is enough
The ORION dashboard runs queries on behalf of the user, billed to their own Google Cloud project. This is not as complicated as it sounds. Creating a GCP project is free, and Google provides 1 TB of BigQuery query data per month at no charge, enough for a very large number of Dashboard searches.
The dashboard shows exactly how much data each query scanned, displayed as a small badge next to every result. In practice, typical searches use a small fraction of the free tier. If a user exceeds their quota, they receive a clear error message. There are no silent failures or hidden costs.
The login screen includes a plain-language setup guide that walks new users through the two one-time configuration steps needed before their first query, supported by a short walkthrough video. The Dashboard is designed to be approachable for users who have never used Google Cloud before.
What comes next
The ORION dashboard is an ongoing development project. The current version is functional but deliberately focused. Features I am actively considering include:
- Expanding the data sources to other ORION-DBs datasets.
- Journal, author, and topic analysis.
- Citation scores.
- Visual navigation of papers based on interactive science maps.
- Implementation of several original bibliometric innovations developed during my PhD research.
- Integration of other open-source bibliometric projects into the dashboard.
A note on how it was built
The ORION dashboard was developed entirely in my spare time. My background is in research evaluation and bibliometrics, not software development, but I wanted to build something real and useful rather than a proof of concept.
The entire codebase was developed with substantial assistance from AI (specifically Claude by Anthropic). I described what I wanted, iterated on the results, and guided the architecture, but the actual code was written with AI support throughout. This experience showed me that, for this kind of data platform, AI-assisted coding makes it feasible to build and iterate on a technically complex system, even when working only in evenings and weekends.
The code is open source (MIT license) and available. Feedback and contributions are very welcome through GitHub and you can also connect with me on LinkedIn.
Try it
If you work in research policy, bibliometrics, science evaluation, or just enjoy exploring scholarly data, I would love for you to try the dashboard (please follow the instructions after clicking the link). Your feedback is greatly appreciated, especially insights on any issues you encounter and suggestions for features that would make the tool more useful.
2 Comments
Hello, this is great, thanks for sharing! I was able to set up everything in 2 minutes without much prior experience with google cloud :) I often do co-occurrence maps myself, so it was nice to see such a fast way of producing them for any institution. A filter to remove papers with >N authors\institutions before such an analysis would be great, along with filters for primary subfields etc.
What about data snapshot updates? Should we expect them quarterly or yearly?
Generally, regarding ORION: there are several major projects of SQL-enabled OpenAlex on BigQuery with similar goals but different table structure, underlying snapshots etc. This is great, but also confusing. From the user perspective it would be nice if you, Campinas and SUB joined forces (with some EU funding?), or at least provided some info on Orion website on which one to choose for different tasks.
Hello Ivan,
Thank you for your feedback! Let me answer it.
F: I was able to set up everything in 2 minutes without much prior experience with google cloud :) I often do co-occurrence maps myself, so it was nice to see such a fast way of producing them for any institution.
A: Thank you! I am very happy to hear that, that is exactly what I had in mind when I built the tool.
F: A filter to remove papers with >N authors\institutions before such an analysis would be great, along with filters for primary subfields etc.
A: Thank you for the suggestion. I have been thinking about improving the map making part of the tool. What I have in mind is to make the map making process into its own tab, where you have more control to select which papers go into making the map.
F: What about data snapshot updates? Should we expect them quarterly or yearly?
A: The updates of the snapshots depend on the people that upload the data to Big Query. Currently, ORION Dashboard uses the openalex_2025aug dataset for most data, except the topics that use the openalex_2023nov_classification, so the dashboard will place the papers past 2023 in the “no classification” category. There are plans to upload the openalex_2025aug_classification this year, and I hope that we will get a new OpenAlex snapshot at least once a year. I’m also thinking about a way of giving the user control over which snapshots they want to use. The most simple solution would be to give the option to select the snapshot, but that could be problematic if some of the snapshots change their schema. I’m still thinking about a solution.
F: Generally, regarding ORION: there are several major projects of SQL-enabled OpenAlex on BigQuery with similar goals but different table structure, underlying snapshots etc. This is great, but also confusing. From the user perspective it would be nice if you, Campinas and SUB joined forces (with some EU funding?), or at least provided some info on Orion website on which one to choose for different tasks.
A: Thank you for the feedback. I understand that it can be frustrating from the point of view of a user that just wants to make a scientometric analysis, to have data fragmented across several databases, without clear criteria for choosing one over the other, or even for joining them. I believe ORION-DBs could benefit from providing some guidance about which databases are best for which tasks. For most bibliometric analyses I would use OpenAlex, so for simplicity I created the tool that uses that database. If you are interested in the topic, you can also contact the people behind ORION-DBs, they are very knowledgeable about this topic.
I hope these answers are helpful, and thanks again for your feedback!
Add a comment