


Incorporating the human factor in the study of universities
University evaluation is done, in part, by evaluating the papers produced by the university. However, universities don’t produce papers, right? People produce papers! In this blogpost we illustrate how you can use the number of papers produced by individuals to evaluate universities.
Why should you care?
How do you evaluate a university? This question does not have an easy answer. However, there is an attribute that is typically considered relevant: the production of scientific papers. However, papers are not created by the university per se, they are created by individuals who are affiliated to a university. Currently, how individuals contribute to the scientific output of a university (e. g. number of papers produced per individual) is not a parameter considered in university evaluations, in part because it is difficult to get the necessary data. But now this data has become more readily available thanks to advances in machine learning and improvements in the metadata available in most scientometric databases. In this post we briefly illustrate how we can use such data to analyze universities differently, incorporating a more human dimension in the discussion of how science is being produced.
We would like to know the contribution of each individual to the university production of papers and analyze how the contributions are distributed among the individuals affiliated to that university. Recently, new disambiguation algorithms allow us to more accurately identify the different individuals active in the production of scientific papers. At the same time, new developments in the tracking of the linkages between authors and their affiliations at the publication level have opened the possibility of determining who is affiliated with what university in each scientific paper. These developments pave the way to more advanced forms of scientometric analysis, like for example mobility studies.
In this blogpost we illustrate how these data also allow us to study the individuals affiliated to universities, and how they contribute differently to the scientific output of their universities, thus allowing for a far more in depth analysis on how universities produce their results, moving beyond the mere publication analysis of the university outputs.
How does it work?
Take a university and all its publications. Then identify all the individuals (i.e. disambiguated authors) that are affiliated to that university in the set of publications. Count the publications for each individual. Of course, the sum of the number of papers of all individuals affiliated to a university is greater than the number of papers affiliated to the university because the same paper can be authored by several individuals from the same university. To fix this, we need to divide the weight of a paper among the authors of the same university. This represents the contribution of an individual to that paper. If we sum all the contributions of an individual, we get the contribution of that individual to the paper production of her university. Figure 1 illustrates this process. Let’s suppose a university has 3 publications, and no external collaboration. These publications are represented in column B (P1, P2, P3). Column A represents the weight of that publication for the count of publications of the university (i.e. in total the university has produced 3 publications). These publications have been authored by 3 different individuals represented in column D (I1, I2, I3). Column C captures the different contributions of each individual to each of the publications, while column E captures the net contribution of each individual to the overall output of the university. Et voilà, from a plain set of publications, we now have a much richer set of information of how these publications have been carried out within the university.
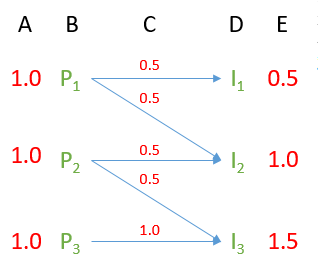
Figure 1: How to calculate the contributions of individuals. A: Contributions to productivity per paper. B: Papers. C: Mapping of contributions from papers to individuals. D: Individuals. E: Contributions to productivity per individual.
Based on this much richer information, it is now possible to perform much more advanced analyses on the output of the university. For example, now it is possible to analyze the distribution of the contributions. To do so, we use a Lorenz curve, which is used by economists to analyze the distribution of income in a country. From this curve, we can calculate the Gini index, which will tell us how concentrated the distribution of contributions is. Gini index 0.0 means perfect equality and Gini index 1.0 means that all the papers are produced by one person.
Applying it to real life
We created a Lorenz curve for each of the ~1000 universities of the Leiden Ranking (LR). With this data, we calculated the average Gini index of the LR universities (0.59 +- 0.03) and the average values of the curves at 9 points (see Figure 2). In order to illustrate how this can be used to analyze specific universities, we also plotted the Lorenz curve of Tilburg University and Erasmus University, since these universities have the most extreme values of the Gini index for the Dutch universities (0.56 and 0.65, respectively).
The most revealing finding is that 70% of the least productive individuals in a university contribute to about 25% of the papers of a university, which is in line with previous observations about the skewness of scientific productivity. However, the distributions of Tilburg University and Erasmus University sit at opposite extremes of the world average. Tilburg is somehow more egalitarian than Erasmus in terms of individual contribution to its production.
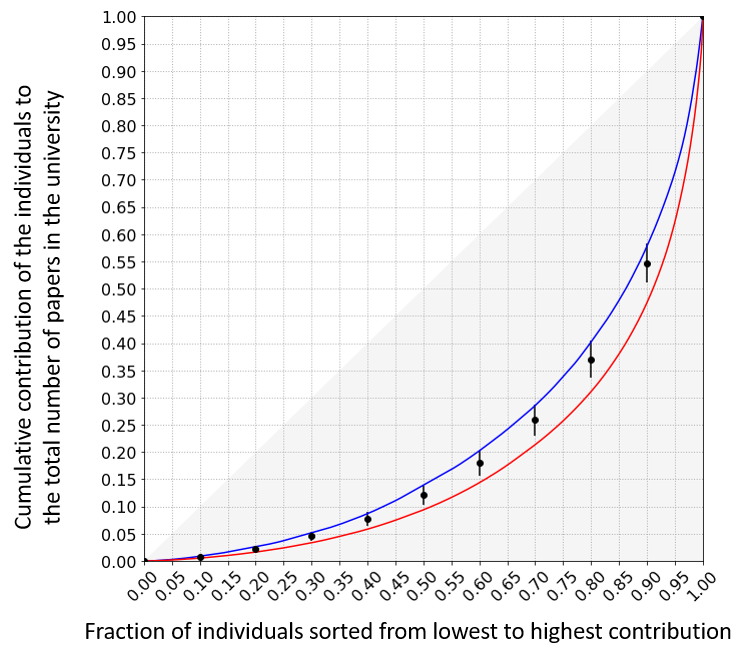
Figure 2: Lorenz curve of the individual contributions within a university. Gray area: The area of an absolutely equal distribution. Blue: Tilburg University, Gini 0.56. Red: Erasmus University, Gini 0.65. Black: Leiden ranking average, Gini 0.59 +- 0.03.
As a mode of conclusion
We have illustrated how new data science developments in scientometric databases allow for new approaches to analyze universities, illustrated by the use of the Gini index to characterize the contributions of individuals to the scientific production of universities. This approach opens the possibility of measuring new attributes of universities, more related to their workforce than just their output, thus positioning the individual at the center of the academic system, and supporting a more anthropogenic perspective in science studies. Our intention is to continue the exploration of this perspective, and to start a discussion on which of these attributes could become more supportive evaluation metrics.
0 Comments
Add a comment